
Abstract
Mining in the production area Block 19 in the LKAB Kiirunavaara Mine has resulted in extensive seismic activity and several serious rockfalls. This paper describes a modelling study aimed at quantifying the seismic potential for future mining of Block 19, considering several different mining sequences. A three-dimensional discontinuum model was used, in which geological structures were included explicitly to simulate the development of fault slip seismic events. Four different mining sequences were simulated: three of which involved leaving the whole, or part of, Block 19 as an unmined pillar. Mining was simulated from the current active mining level and for a production period of >20 years ahead in time. The results were evaluated in terms of stress influences on critical infrastructure in the footwall of Block 19 and, more importantly, the possible extent of fault slip seismic events due to mining (by calculating seismic moments). The results showed that leaving a pillar in Block 19 may be less desirable as higher seismic moments will develop in the final mining stages. However, continued mining without a pillar will also likely result in an increased seismic activity in Block 19, which needs to be addressed appropriately. Block 19 should be mined before the neighbouring production areas, but additional and more detailed numerical modelling may be needed to fine-tune the extraction sequence for each level mined.
Introduction
LKAB is operating one of the world's largest underground metal mines: the Kiirunvaara iron ore mine. The mine is located in the city of Kiruna, ∼150 km north of the Arctic Circle in northern Sweden. Mining is conducted using large scale sublevel caving with a high degree of automation. Annual production in 2010 amounted to 26·5 million metric tonnes of crude ore.
The tabular Kiirunavaara orebody is ∼4000 m long, striking almost north–south and dipping 55–60° toward east, and with a width of 80–160 m. The mine is divided into 10 production blocks, named after the Y coordinate in the mine coordinate system (from 9 to 45). Each production block has its own system of ore passes and ventilation shafts, and shares a ramp with its neighbouring block (see also Fig. 1). The current main haulage level is at the 1045 m level. A new main haulage level is being developed at the 1365 m level. Currently, mining is conducted mainly at the 935 and 964 m levels, except in the Sjömalmen Area (production Blocks nos. 9 and 12), where mining is at the 767 m level. The ground surface at the mine entrance is at around the 230 m level in the mine coordinate system (the 0 m level is at the former, now excavated, top of the Kiirunavaara Mountain at 736·2 mamsl).
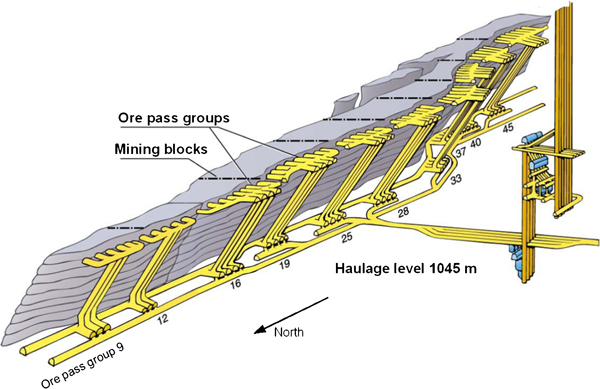
Schematic figure showing Kiirunavaara orebody with production blocks and infrastructure
Mining of the Block 19 production area in Kiirunavaara has, during recent years, resulted in significant seismic activity and several large and serious rockfalls (included one fatality). It is anticipated that the seismic activity will continue to be high during future mine production from this area. The larger seismic events that have been recorded have, almost exclusively, been interpreted as fault slip type, indicating an activation of geological structures in the rock mass.
For the continued mining of Block 19 several mining alternatives have been proposed. There is a need to quantify the effects, with respect to stability and seismicity, for each of these alternatives. This issue may be addressed through numerical modelling, which was the outset for the present study. This paper presents a three-dimensional modelling study in which geological structures were included explicitly. The objective of the study was to:
increase the knowledge of the origin and cause of seismic events in Block 19 and how these were affected by mining
recommend a suitable mining strategy for continued mining of Block 19 down to the 1500 m mining level.
Seismicity and rockfalls in Block 19
The Kiirunavaara orebody is primarily fine grained magnetite, with a varying content of fine grained apatite (decreasing with depth). The footwall comprises trachyte, internally designated as syenite porphyry, whereas the hangingwall consists of rhyolite, internally designated as quartz porphyry. All rocks are of Precambrian age. Contact zones of limited width are found on both the footwall and hangingwall side. The rock mass quality is generally good for all rock units, but locally, rock conditions vary from high strength, brittle rock to altered, slightly weathered rock with clay- and chlorite-filled discontinuities. The dominating joint orientations are steeply dipping, striking north–south (parallel to the orebody) and east–west.
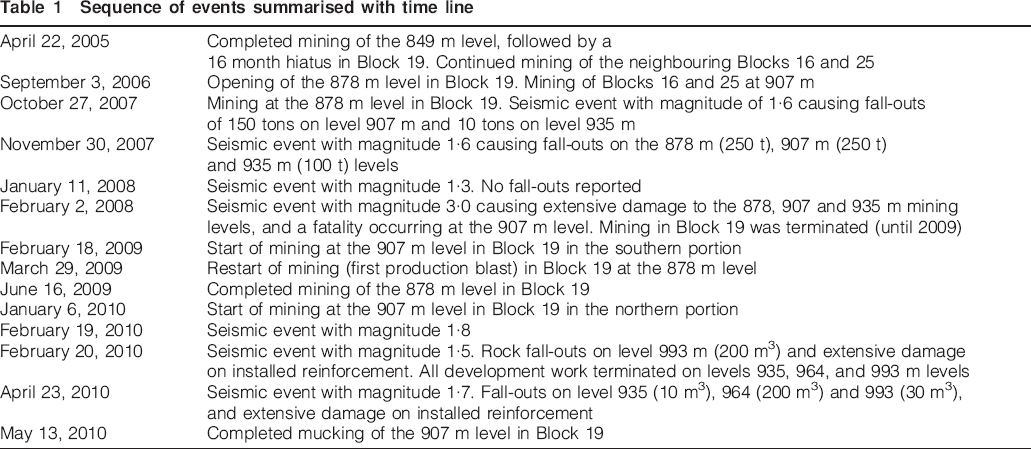
Block 19 is, comparatively speaking, a geologically and geometrically more complex area in Kiirunavaara. The ore is inhomogeneous with the host rock splitting it into small, irregular portions. The contact between the ore and the host rock is normally weak. Historically, this area is known for its poor rock conditions causing problems both in the development and production phases. Starting in 2007, the seismic activity in Block 19 has increased significantly. This increase can, to a large extent, be linked to the mining configuration created in this production area. The sequence of events may be summarised with the following time line (Table 1).
Sequence of events summarised with time line
The fatality of 2 February 2008, prompted closure of Block 19 for about 1 year. Before this event, large seismic events were rare and did not pose a major ground control issue, and no mine wide seismic monitoring network was installed. During the closure time, a mine wide seismic monitoring network was installed, enabling 24/7-monitoring of all active mining areas. The system currently comprises 133 geophones, with a location accuracy of ∼20 m, and a sensitivity of −1·5 (local magnitude). Moreover, dynamically resistant (yielding) rock reinforcement has been installed in all production areas, comprising friction bolts or in some cases grouted rebars, 100 mm fibre reinforced shotcrete, and welded mesh fastened with 150 mm face plates. Stringent re-entry protocols for areas that have suffered rockbursts have been developed, and a revised opening sequence has been adopted in high seismicity areas.
Nevertheless, with the commencement of mining in Block 19, three fairly large seismic events were observed during the period of February to April 2010. The resulting fall-outs occurred in the footwalls drifts (which are ore-parallel) on the 935, 964 and 993 m levels (see Fig. 2). All fall-outs followed seismic events localised close to previously interpreted seismically active structures in Block 19. Development was terminated on all three levels. A study of these fall-outs and the associated seismic data has shown that the major seismic events were of fault slip type. The likely orientation and location of the seismically active structures have been identified based on interpretation of clustered events in Block 19. In total, four structures were identified as illustrated in Fig. 3, and denoted as B19Ab, B19B, B19C and B19D.
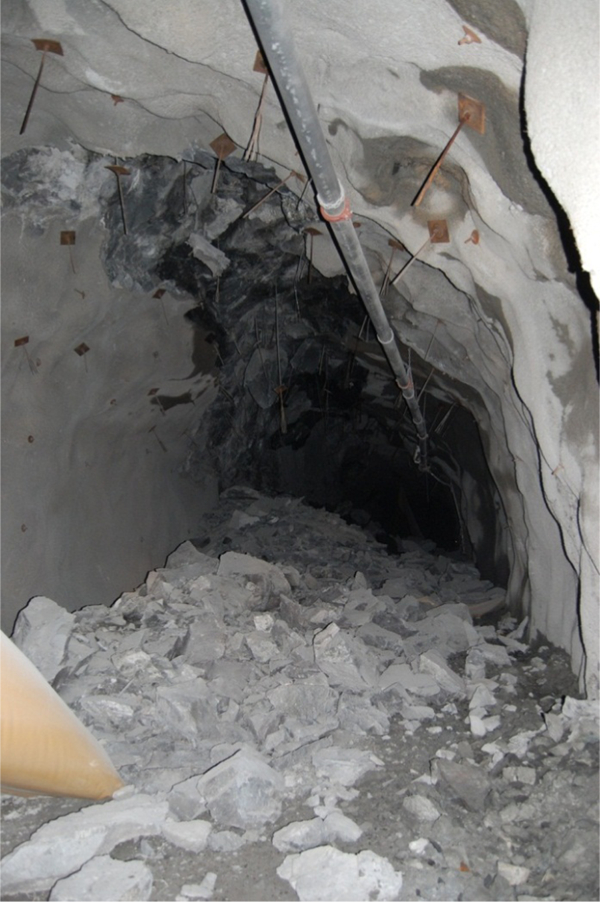
Fall-outs in access drift of Block 19 at 964 m level following seismic event on 23 April 2010
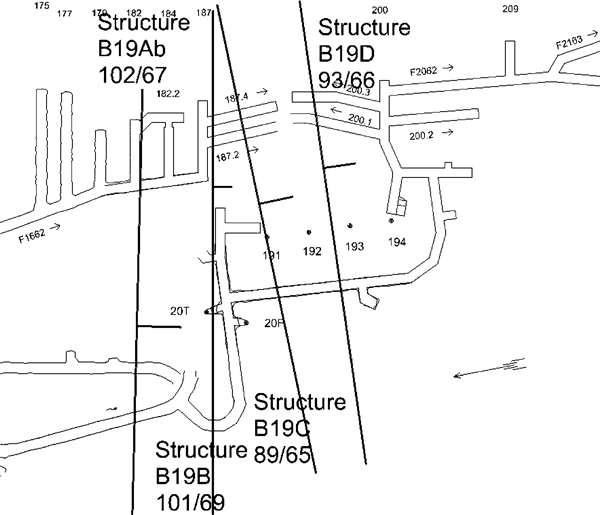
Plan of Block 19 showing identified seismically active structures
Modelling approach and model set-up
General approach
The mine geometry and, in particular, the mining sequence in Block 19, is three-dimensional and thus, a three-dimensional modelling approach is required. It was also deemed important to be able to explicitly simulate shear displacements along geological structures. Hence, the tool of choice was the three-dimensional distinct element code 3DEC (Itasca, 2007), in which slip, separation, and rotation between rock blocks can be simulated, as well as material yielding within the blocks.
A mine scale model was required, in which the neighbouring production areas (Blocks 16 and 25) were included. The overall model size was determined after some initial parametric studies, to minimise possible boundary effects. The caved rock was simulated as a void, and with a cave angle of 90°, in accordance with previous studies (Sjöberg et al., 2011) and based on an initial parametric study.
The rock mass was simulated both as a continuum and a discontinuum (with the geological structures included). The continuum models were primarily used for model verification purposes, whereas the discontinuum models were used to simulate fault slip. A linear–elastic perfectly plastic (Mohr–Coulomb) material model with tension cut-off was used for the rock blocks in both models. For the discontinuum model, joints were simulated with a Coulomb slip model with zero residual cohesion and tension. Although seismic events are dynamic phenomena, only static analyses were conducted. With the focus on identifying the underlying causes of seismicity, the actual seismic event (wave propagation, etc.) need not be simulated explicitly.
Criteria and data for calibration and interpretation of seismic events
An important ingredient in this work was parametric studies and comparisons with observations from the mine. The expanded seismic monitoring network has resulted in a significant amount of data for the last 2 years, which can be used to better validate numerical models. However, it is not obvious what quantities should be used (for validation) or what parameters to adjust to calibrate a numerical model.
For strainburst events, there have been several attempts at predicting the occurrence of these, based on evaluating overstressed volumes of the rock mass. Andrieux et al. (2004, 2008), Andrieux (2010) and O'Connor et al. (2010) describe the calibration of locations of seismic events against yielded areas in the numerical model. A strain softening material model was used and the methodology has proven to work well for prognosis of the seismic activity in high stress situations. Buss (2010) describes a similar approach in which the deviatoric stress and yielding is compared with the location of the seismic front, in this case applied to the Creighton Mine in Canada. Other examples of this type of work, in this case using three-dimensional modelling in Abaqus, are presented by Beck et al. (2009).
Andrieux et al. (2008) further states that calibration against fault slip events is much more difficult. The work that has been done in this area was initially built on the excess shear stress (ESS) concept, which was first presented by Ryder (1987, 1988). For this criterion, it is assumed that slip along a discontinuity occurs when the Mohr–Coulomb slip condition is satisfied. Once the static shear strength has been overcome, the (lower) dynamic shear strength is acting (cohesion is eliminated). The difference between static and dynamic shear strength is termed ESS. Salamon (1993) and later Board (1994, 1996) developed a methodology for static simulation of seismicity using ESS. In this methodology, a fracture pattern was simulated in the rock mass and the shear and normal stresses at the location of each fracture determined, and the corresponding ESS calculated. Only continuum modelling was used for this, thus not simulating shear displacements explicitly. Examples of where the ESS concept has been used in practical mine design can be found in works by van Aswegen (2005) and Mungur (2005).
To account for the kinematics of shear slip and possible interaction between discontinuities, discontinuum modelling must be used. Several examples of such modelling can be found in CAMIRO (1996). A general conclusion from those studies was that simple elastic models in many cases were not sufficient to explain the underlying causes of mine induced seismicity, in particular for mining in high stress conditions, where significant damage to the rock mass is expected. By including material models that can fail (yield) as well as slipping discontinuities, shear deformations may be calculated and the resulting seismic moment (shear displacements times the area of slip times the shear modulus) can be determined. Hildyard et al. (2006) noted that the cumulative seismic moment was a representative measure of the total seismic deformation. Potvin et al. (2010) and Hofmann (2010) used such an approach and calibrated the results against measured seismic moments (from the seismic monitoring system of a mine).
It should be noted that none of the above described approaches provide any information on whether a failure will be violent or not. Calculation of seismic moments from joint shear displacements will indicate the maximum possible seismic event that may occur, but not whether the release of energy will be seismic or not, or if it will be in a series of several small events or as one large event.
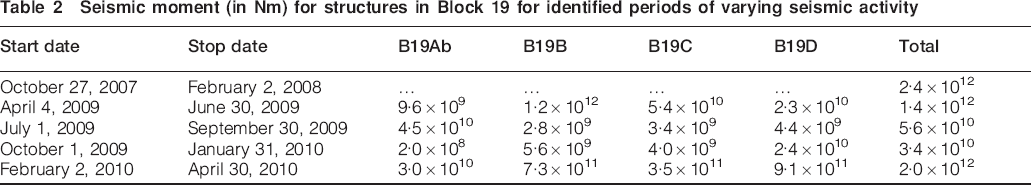
To summarise, it appears that seismic moment is a quantity that can be used to compare results from a numerical model with actual observed behaviour. The seismic moment is reliably registered by the seismic network system in Kiruna starting November 2008 (with the mine wide network in place). For the periods of high seismic activity before 2009, seismic moments from NORSAR have been used (Kværna and Gibbons, 2011). Based on the seismic data, five time periods with varying seismic activity were defined, with the corresponding recorded seismic moments (for the group of clusters associated with each structure) as shown in Table 2 (cf. the timeline in Table 1). These data were subsequently used for comparison with the modelling output for Block 19. Note that for the data before 2009, the contribution from individual structures could not be separated.
Seismic moment (in Nm) for structures in Block 19 for identified periods of varying seismic activity
Model set-up and analysed cases
A slightly simplified geological representation was used with three lithological units: hangingwall, orebody and footwall. These were modelled for Blocks 16, 19 and 25, based on horizontal (plan) maps for each mining level. The plan maps were compiled into a solid model, which was subsequently input to 3DEC. Single drifts, ore passes, etc., were not included in the model. The final model geometry is shown in Fig. 4. The seismically active structures according to Fig. 3 were included in the model, assuming that they extended from the 849 m level to the 1700 m level. Since the four identified structures dip toward south, it was also assumed that four additional structures with the same characteristics existed in the northern portion of Block 19 at larger depth (see Fig. 5). From experience at the site it is known that the rock conditions within a certain production area is fairly constant with depth, thus this assumption is realistic.
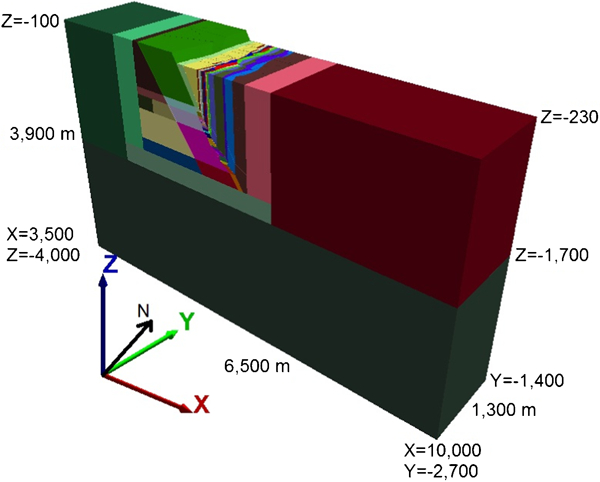
3DEC model geometry with coordinates and different regions
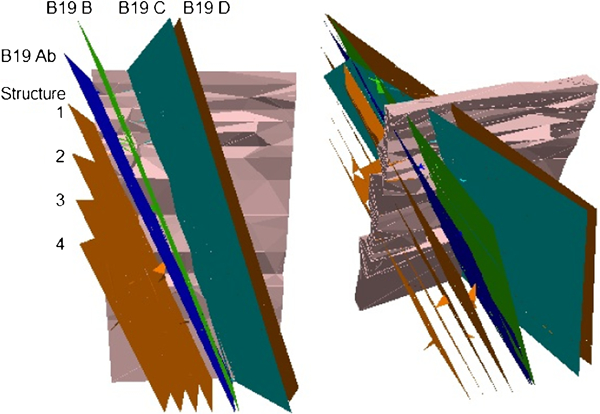
Structures included in model shown together with orebody geometry
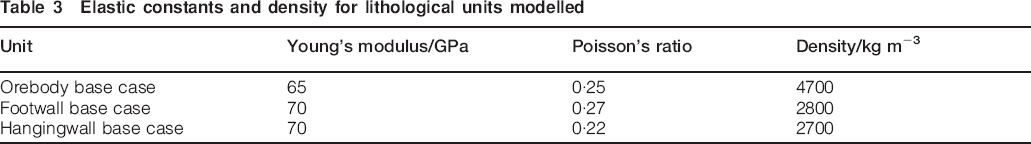
Initial (virgin) rock stresses were taken from Sandström (2003), which involved a compilation and interpretation of all conducted stress measurements in the mine. Roller boundaries were used for the bottom and vertical sides of the model, whereas the upper boundary was simulated as a free surface (corresponding to the ground surface). Mechanical properties for the rock mass units were based on previous studies (Sjöberg et al., 2003; Sjöberg and Malmgren, 2008), which, in turn, were based on compilations of laboratory tests and rock mass classification, used in conjunction with the empirical Hoek–Brown failure criterion to estimate equivalent rock mass properties. The elastic constants are summarised in Table 3, and the Hoek–Brown parameters and characterisation data are presented in Table 4. Five sets of strength properties were derived, accounting for the intrinsic variability in the rock mass, as summarised in Table 5. Joint properties were taken from laboratory tests and field observations presented in Malmgren and Nordlund (2006) and a total of 10 parameter sets were defined, as shown in Table 6.
Elastic constants and density for lithological units modelled
Input data to estimation of mechanical properties of rock mass*
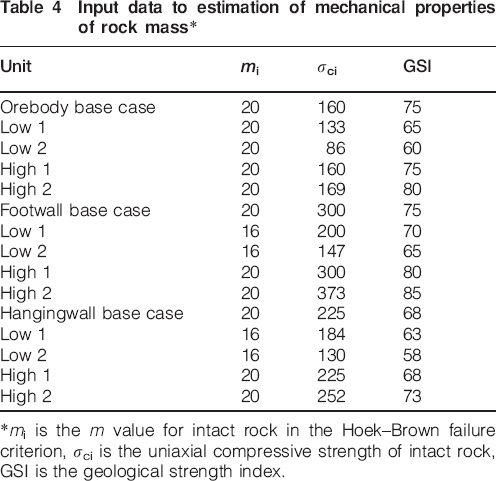
mi is the m value for intact rock in the Hoek–Brown failure criterion, σci is the uniaxial compressive strength of intact rock, GSI is the geological strength index.
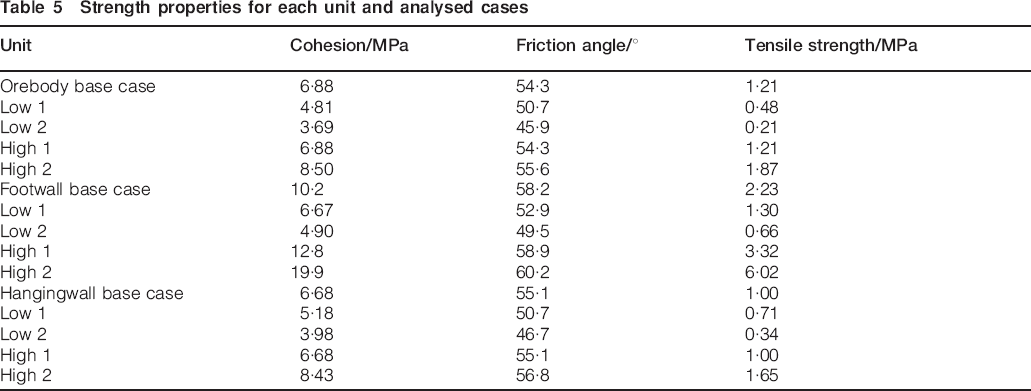
Strength properties for each unit and analysed cases
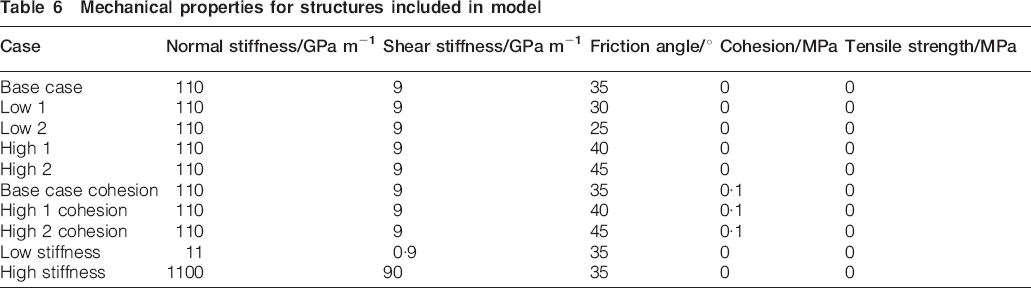
Mechanical properties for structures included in model
Previous mining was simulated in 10 stages with mining starting at the 740 m level. Stages 1 through 5 corresponded to mining up until 27 October 2007. From this time and onwards, mining stages corresponded to the periods defined in Table 2 (based on variations in recorded seismic activity). Mining stage 10 corresponded to mining as of April 2010 (refer to the section on ‘Seismicity and rockfalls in Block 19’).
Several different mining alternatives were simulated for the future mining of Block 19 (see Fig. 6). Case 1 corresponds to mining of all three blocks more or less simultaneously, with the exception that Block 19 is mined with a two level layout for the 993 m level (thus including the 964 m level), to catch up with the mining in Blocks 16 and 25. In case 2, the whole of Block 19 is left unmined, whereas in cases 3 and 4, mining is continued below a pillar extending to the 1365 and 1200 m levels respectively.
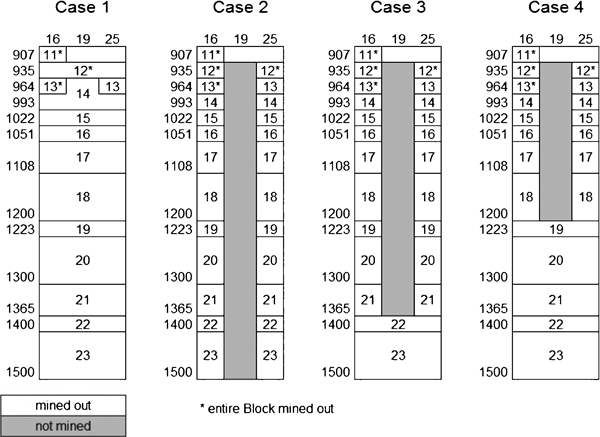
Vertical longitudinal projection showing alternatives for continued mining in Block 19
For the previous mining (stages 1 through 10, until 30 April 2010), a sensitivity study was conducted. The continuum model was run for the five parameter sets of Table 5. The discontinuum model was run with the base case properties for the rock mass and with the 10 parameter sets according to Table 6 for the large scale structures simulated in the model.
Model verification and sensitivity studies
Initially, a comparison with previous three-dimensional (Sjöberg et al., 2011) and two-dimensional (Sjöberg and Malmgren, 2008) models was conducted to verify the new 3DEC model. A comparison of calculated stresses showed generally good agreement between the two- and three-dimensional models; however, stresses are slightly lower in the three-dimensional models, as could be expected. The amount of yielding in the models also agreed well.
The mine scale model proved to be relatively insensitive to a change in strength properties (Table 5) for the rock material for mining down to the 907 m level (relatively little yielding). Therefore, the base case properties (which appear reasonable) were used for the continued modelling.
In the corresponding sensitivity analysis using the discontinuum model, the seismic moment arising from shear slip along the large scale geological structures was calculated and compared with the recorded seismic moment (Table 2). Interpretation of the discontinuum model showed that joint shear slip primarily occurred near the mined areas. Therefore, there does not appear to be any significant activation of structures far away from active mining. However, the calculated seismic moment was lower than the recorded seismic moment, regardless of which parameter set was used. An example is shown in Fig. 7 for the cases in which the friction angle of the structures was varied. The observed discrepancy in calculated versus recorded moments can be due to more structures (with the same general orientation) being activated in reality, thus contributing to the seismic moment recorded for the group of clusters belonging to each structure. The results from the parametric study can still be interpreted qualitatively and compared with each other (similar to what was done by Potvin et al., 2010).
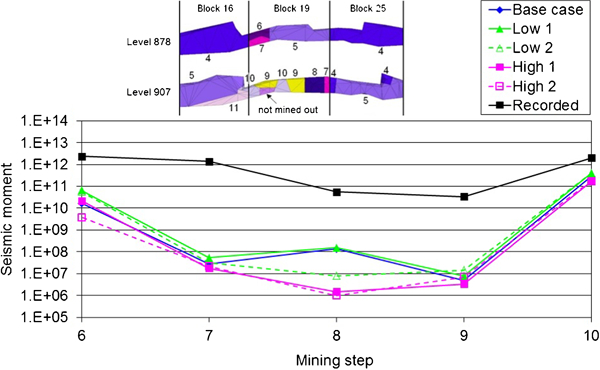
Calculated total seismic moment in Nm (from all structures) and for different values on friction angle (cf. Table 6) compared to recorded seismic moment
Several of the analysed cases show trends similar to the recorded seismic moment. The results from each parameter set analysed were studied in more detail. It was found that the friction angle had a relatively small influence on the total seismic moment when summarising the contribution from all structures (Fig. 7). Similarly, the effect of varying joint shear and normal stiffness was relatively small. Interestingly, it was found that by applying a small cohesion, a better fit with recorded seismic moment was obtained for some of the structures.
A possible interpretation is that the structures have asperities (which result in an initial cohesion), which subsequently are sheared through thus causing momentarily larger shear displacements. A summary of the observed trends in calculated moments compared to recorded moments is shown in Table 7. It can be noted that by including the four additional (and assumed) structures in the northern portion of Block 19, a better fit is found compared to when these are not included. This finding is a further indication that there are more structures contributing to the seismicity in Block 19, than those presently identified. However, based on the existing data it is not possible to suggest that one particular parameter set is more realistic than another. Therefore, for the simulation of future mining the base case properties were used for both the rock mass and the structures.
Summary of comparison between calculated and recorded seismic moments for different parameter sets (cf. Table 6)
Simulation of future mining alternatives
Simulation of future mining for the alternatives described in Fig. 6 was evaluated in terms of:
seismic moments from shear displacements along the large scale structures in Block 19
stresses at the location of critical infrastructure in Block 19 (locations for footwall drifts, transportation and chute drifts on the planned new major haulage level at 1365 m level, etc.).
The results for these two issues are presented in the following. The presentation is focused on cases 1 and 2, as these cases represented the extremes in terms of mining, either leaving a pillar in the whole of Block 19 (case 2) or continuing mining as before after opening on the 993 m level (case 1). Only the base case strength properties were used for the simulation of future mining.
Seismic moments
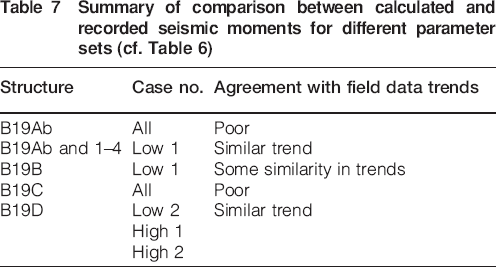
Calculation of the seismic moment resulting from shear displacements was conducted for all mining stages and for all structures included in the model. Seismic moment is only calculated for the areas which are at slip (at the failure envelope). The total seismic moments for all mining stages are shown in Fig. 8 for cases 1 and 2. It should be noted that the difference in seismic moment between the different mining stages is not entirely comparable, as the mining stages are different in size (between one and three levels in height). The different cases can, however, be compared with each other. From Fig. 8 it is seen that case 1 gives a slightly higher seismic moment in all mining stages, except in the last two stages when case 2 gives a significantly higher seismic moment. It can be noted that case 4 (starting mining below the pillar at the 1200 m level) results in even higher seismic moments for the final mining stages (not shown in Fig. 8).
Calculated seismic moment in Nm (from all structures) and for future mining according to cases 1 and 2
Common to all cases is that the seismic moment generally increases as mining continues toward depth. The magnitude is similar, or higher, compared to that of mining stage 10 (corresponding to April 2010). In the final mining stages, the increase in calculated seismic moments corresponds to two orders of magnitude.
The contribution to the seismic moment is different for the different structures in the model. Structure B19D generally contributes more to the seismic moment than the other structures. However, this is less pronounced for case 2, for which the other structures have a relatively larger contribution to the total seismic moment than for case 1. This is particularly true for the final mining stages, in which also the highest seismic moments were found.
Stresses at location of critical infrastructure
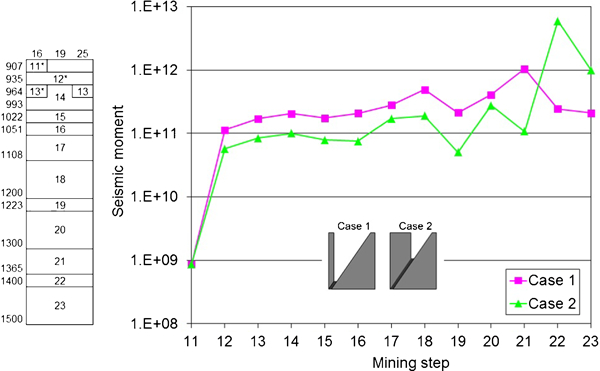
Stresses were evaluated at the location of identified critical infrastructure in the footwall of Block 19. This included primarily the major haulage level at the 1365 m level, and the intermediate level at 1165 m. An example is shown in Fig. 9. The highest deviatoric stresses generally occur for case 1 (no pillar), with the maximum values developing when mining is approximately two levels above the studied point. Case 1 is similar to the situation in all production blocks in the mine, meaning that one can expect (and must cope with) these stress levels for all infrastructure. For case 2 (no mining in Block 19), the highest stress occurs in the last mining stage, and a more favourable stress situation can be expected. Similar results and trends were found at the locations of other critical infrastructure, but the stress levels decrease with increasing distance from the orebody.
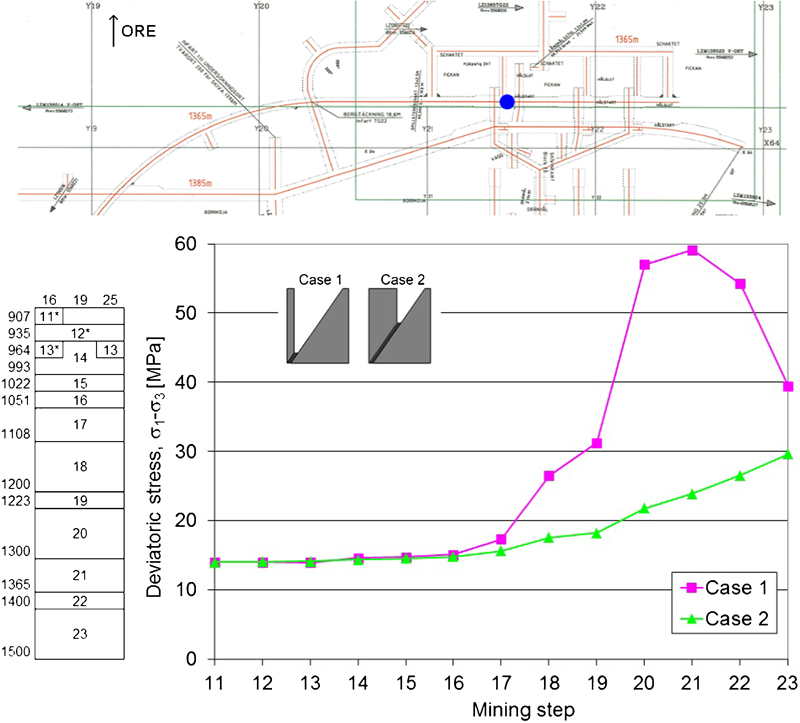
Calculated deviatoric stress (bottom figure) at location of chute drifts on 1365 m level (filled circle in top figure) for cases 1 and 2
Discussion
The potential for fault slip rockbursting has been studied by calculating the seismic moment caused by shear displacements along large scale geological structures. The seismic moment is proportional to the magnitude of the seismic events that may arise due to these shear displacement. However, it should be noted that the fact that shear displacements develop does not mean that a seismic event will occur. The calculated seismic moment will thus provide information on the largest event (or series of events) that may occur, but not whether the energy release through shear displacements will be seismic or aseismic. An increased seismic moment can, nevertheless, be used to infer an increased potential for seismic events in the mine. It is judged that this interpretation may be slightly conservative (not all shear displacements will result in seismic events). On the other hand, there may also be structures presently not included in the model, which contribute to the seismic moment, thus making the model results non-conservative.
The three-dimensional modelling approach was deemed necessary considering the orebody geometry, the employed mining sequences, and the orientation of the seismically active structures. The level of detail is believed to be sufficient to compare mining alternatives on the production block scale, but to analyse the effect of various opening and retreat strategies within a production block, a finer discretisation is required. This can prove to be important, as a geological structure can be activated differently depending on the local mining sequence (how the mining front approaches the structure).
The conducted analyses were of more of the type sensitivity studies, rather than a stringent calibration (or validation). There are still significant uncertainties, which need to be addressed. Some of the major uncertainties are:
the location, orientation and number of seismically active structures at depth (below active mining level and thus not covered by existing microseismic data)
the mechanical properties of the structures (likely to be different for different structures, but currently not possible to quantify)
the mechanical properties of the rock mass (also likely to vary within a production block, but not quantified in enough detail today).
Conclusions and recommendations
From the work conducted, the following conclusions may be drawn.
By using the seismic moment as an evaluation parameter, relevant comparisons between modelling results and field data could be conducted.
The numerical model used can provide information on the potential for fault slip rockbursting, but cannot quantify whether shear displacements along structures will be seismic or aseismic energy release.
Calculated seismic moments are smaller than recorded seismic moments, which can be due to not all real joints and large scale structures being included in the numerical model. The calculated seismic moments can thus only be interpreted qualitatively.
For the future mining alternatives, the effect on critical infrastructure in the mine has been assessed through calculated stresses at the location of such infrastructure. The results showed that by leaving a pillar in Block 19, lower stresses will result in the footwall infrastructure, compared to conventional sublevel caving (without a pillar).
Using the calculated seismic moment as an index, the alternative future mining scenarios were compared. It could be shown that the seismic moment generally increases with increasing mining depth. Moreover, the highest calculated seismic moment is found for case 2 (pillar in Block 19) and for the final mining stages. However, with the exception of the last two mining stages, slightly higher seismic moments were found for case 1 (no pillar).
By leaving a pillar, it is possible that the potential for fault slip rockbursting is reduced for a rather long time period, but eventually, higher seismic moments will develop for this alternative.
The recommendations for future work are given as follows.
Continued mining of Block 19 can be conducted without leaving a pillar in portion of Block 19. The rock mechanical conditions are more predictable for this case, compared to leaving a pillar in Block 19. The latter is particularly true if mining is to be resumed below a pillar.
It is essential that Block 19 is mined simultaneously (by level) or preferably slightly ahead of the neighbouring Blocks 16 and 25.
The effects of including additional structures with different orientations (thus increasing the kinematical freedom) in the model should be studied, preferably through additional modelling.
A more detailed model in terms of mining sequence within a production block should be considered to analyse the possible effects of slip activation of a structure as the mining front approaches. This is currently a large remaining uncertainty.
Footnotes
Acknowledgements
This study was funded exclusively by LKAB. The authors wish to thank the LKAB Seismic Mine Advisory Board, consisting of Yves Potvin (Australian Centre for Geomechanics), William Hustrulid (Hustrulid Mining Services), and Per-Ivar Marklund (Boliden Mineral AB), for valuable discussions and suggestions.
This paper is part of a special issue on Deep and High Stress Mining