
Abstract
Dragline productivity is strongly influenced by swing cycle times, comprising between 60–70% of all dragline operational time. The ability to classify and report on dragline swing cycles according to their limiting motion is essential for identifying performance losses and deriving continuous improvements. This paper presents an algorithm for the automatic classification of dragline cycle dependencies. The algorithm adopts a simple graphical approach, based on coincident limits defined by the locus of points where the swing and hoist motors work at full capacity for equivalent time periods. The algorithm is capable of distinguishing three cycle dependencies; swing, hoist, and drag limited cycles. The coincident limit algorithm was applied on a dragline at a coal mine in Queensland's Bowen Basin. A data set of 200 000 cycles consisted of: 70% swing limited cycles; 27% hoist limited cycles and 3% drag limited cycles. The coincident limit algorithm permits an equivalent swing angle to be calculated for draglines in hoist limited situations. This facilitates the possibility of measuring dragline work as BCMs multiplied by the equivalent swing angle. This measure could potentially be applied to benchmark the performance of draglines in different operational contexts in which varied pit and block geometries influence the proportion of hoist limited cycles.
Introduction
Since the 1980s dragline performance monitors have evolved from closed systems, which employed proprietary databases and communications links, to today's systems that provide open access to data and to software applications.
A number of researchers have contributed to this development. Lumley and Haneman (1994) analysed performance data from Tritronics monitoring systems installed on sixteen Australian draglines; these authors developed software for processing the critical parameters for dragline performance to differentiate operator performance and to identify productivity enhancements for different dig modes (key cut, main bench, bridge and rehandle, etc). They considered a number of key process variables including hoist dependent swings (defined as a slowing of the swing motion to facilitate hoisting). Abnormally high percentages of hoist limited cycles were found to be related to one or more of the following: the pit and/or block geometry (due to depth of overburden); restrictions on spoiling sometimes caused by a proximity to ramps, or by geology; the dragline's chosen digging method (the ratio of chopping/digging, stand-offs and proximity to spoil, etc.); swing and/or hoist motor capacity; bucket rigging geometry (an incorrect geometry can slow the swing-to-dump process by requiring tighter trajectories closer to the boom to maintain bucket carry angles); and, the operator's training (who might position the dragline too close to spoil piles or might leave hoisting operations until too late into the swing).
Thornton (2001) developed appropriate statistical techniques for interpreting the large quantity of data generated by dragline performance monitors. This researcher investigated the use of data clustering techniques and statistical process controls (SPC) to detect unplanned changes in operating conditions. Hettinger and Lumley (1991) also provided a general set of tools for processing dragline performance data and to facilitate benchmarking by introducing the concept of specific functional analysis. This helps to determine cause-and-effect relationships and to provide continuous improvement opportunities for dragline operations.
Erdem and Duzgun (2005) analysed performance data from two draglines operating in a Turkish mine and suggested cycle time improvements. The majority of cycles analysed were swing dependent, but these authors found that cycles became hoist dependent for deep, narrow key cuts; cycles also had a high probability of being drag payout dependent for swing-angles smaller than 50°.
Statement of problem
The time management of draglines requires monitored data (uptime and the nature and extent of process and equipment delays) and key performance indices (KPIs), which are related to productivity; these include the BCM/hr, the cycle times, and the swing angles.
Much of this data related to dig, swing and dump times can be automatically captured and parsed, but the monitoring systems commonly rely on the dragline operators to identify, to classify and to manually input the dig mode explanations or descriptors. These identify the different types of dragline digging operations such as: key cut; blocks; and chop cut. This process is highly subjective and often results in missing information and in unintentional errors, which occur when the operators differently assess similar digging conditions. Operators may also deliberately misclassify some dig modes to misrepresent their failure to meet production targets.
Such deficiencies may not only be related to poor operator practices; the operating context of a dragline (whether deep digging, high spoiling, blocky ground, etc.) can significantly affect productivity. Hoist limited cycles (where swing cycles are slowed to enable the bucket to clear any obstacles) and drag limited cycles are two variations of operating context. Drag payout dependent cycles include swing angle cycles; it takes longer in these for the drag payout to reach the boom point to enable the dumping of the bucket. This typically occurs when the dragline is building a bench using chop cut materials.
The dragline performance (BCM/h) must thus be determined in relation to the dragline's operating context, to the mine plan and to the extraction sequence. The rate of over-burden removal changes as a dragline moves through a block. Hoist limited cycle times, for example, should not be compared to situations of unrestricted cycle times.
The benefits of developing context sensitive, dragline performance indices, and of feeding these back to the dragline operator in the form of benchmark indices are:
an enhanced dragline productivity as a result of providing less efficient operators of their potential performance delta with respect to an optimum level. This effect is difficult to quantify but a study by Lumley (2005) of the performance of dragline operators found that two out of eleven operators consistently achieved less than 95% of the dig rate target
an extended asset life. This same study also found that three out of eleven operators had caused excess boom stress and had compromised the boom's fatigue life. The feedback of context sensitive KPIs was also found, in ∼18% of cases, to reduce the incidence of boom and mechanical damage; this finding was, admittedly, based on a limited data set.
This study aims to add value to data captured by existing dragline performance monitors, by developing and by testing an algorithm capable of classifying cycle dependencies and of automatically distinguishing the dig modes employed by operators (Knights et al., 2012).
Methodology
Mathematical development
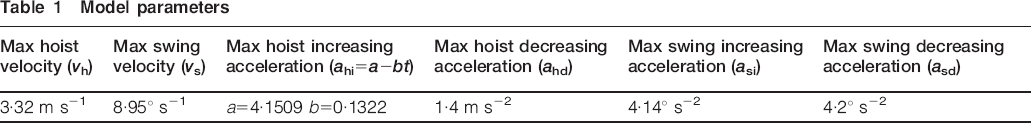
A coincident point is a point in space, which is defined by the position of the loaded dragline bucket, where the swing and hoist motors work at full capacity for an equivalent amount of time (Sargent, 1990). The potential vertical lift is small for correspondingly small swing angles but larger lifts are possible for larger swing angles up until the full dump height capability of the dragline is achieved. The use of a coordinate system, which is defined by the dragline swing angle on the x axis and by the vertical lift height on the y axis, enables the visualisation of a trajectory or curve that is defined by the loci of such coincident points. This curve has been designated as the coincident limit (Fig. 1). It is also possible to define coincident limits between the swing and the drag, and between the hoist and the drag movements. The vertical and horizontal lines near the origin define these limits respectively.
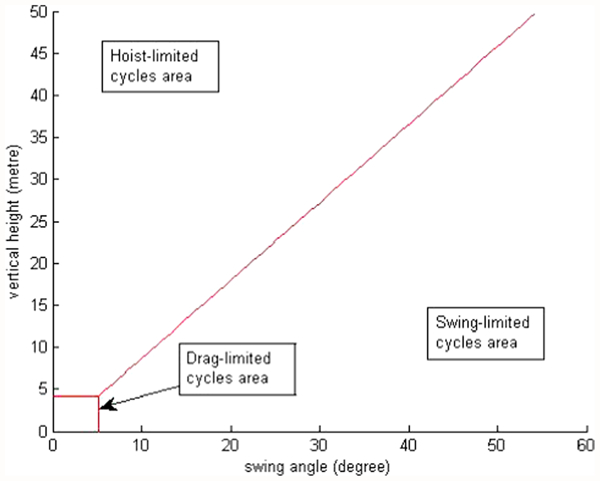
Locus of coincident points making up coincident limit diagram
The bucket dump position will fall below the swing/hoist coincident limit if comparatively little hoisting is required within a cycle, or if hoisting is slowed for any reason. The lower half of the graph (below the swing/hoist limit) thus denotes swing limited cycles. Conversely, the resulting cycle will be hoist limited if more hoisting time is required; this necessitates a slowing of the swing motors. The upper half of the graph (above the swing/hoist coincident limit) thus represents hoist limited cycles. If, however, the bucket dump position falls within the rectangle that is defined by the swing/dump and hoist/dump limits, the resultant cycles are then drag limited. This could occur, for example, as a result of bench preparation work.
It is necessary to model the dragline's hoist, swing, and drag movements to quantify the coincident limit functions. The function is the relationship between hoist height h and swing angle θ, as follows


The torque–velocity curve follows the current–voltage characteristics of direct current (DC) motor drives (Fig. 2). This means that, from a rest position, the motors will accelerate with a constant acceleration until they encounter a saturation zone, which is governed by a limiting electromagnetic flux. A velocity limit is imposed by the motor drives.
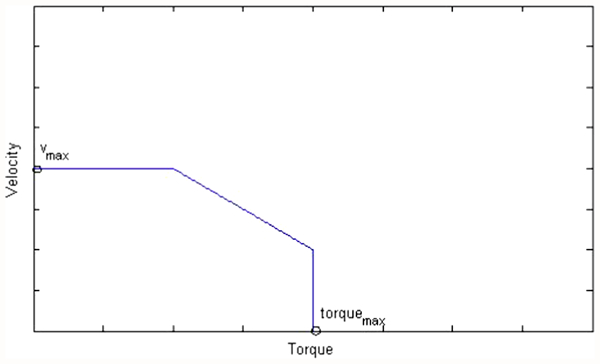
DC motor velocity–torque curve (first quadrant only)
The following assumptions were made to produce a model of the angle-time and distance-time relationships for the swing and drag functions:
swing velocity would increase with a constant acceleration for the first few seconds of the swing phase. The velocity would then remain unchanged for a period and would be followed by a uniform deceleration motion (Fig. 3)
drag payout would increase with a constant acceleration at the beginning of a swing phase and then would maintain a constant velocity for the remainder of the swing; drag distance would generally be limited by the distance from the bucket fill disengagement point to the boom radius
swing velocities and acceleration values would be evaluated from the sample cycle data and would represent maximum capability across a range of payloads
the effects of the payload variance on the swing performance would be ignored
differences in the operators’ performances would be ignored.
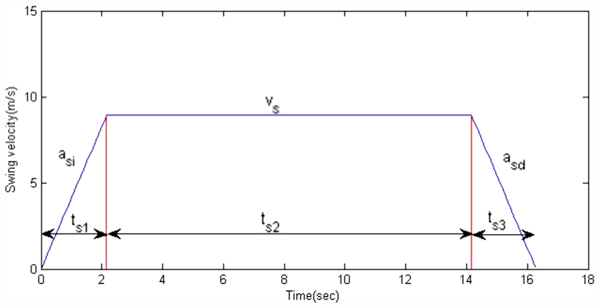
Swing–velocity diagram
A mathematical model can be developed as follows:
The area under the graph in Fig. 3 represents the swing angle θ and is estimated by
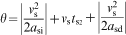
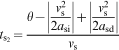
If ts2 = 0, then


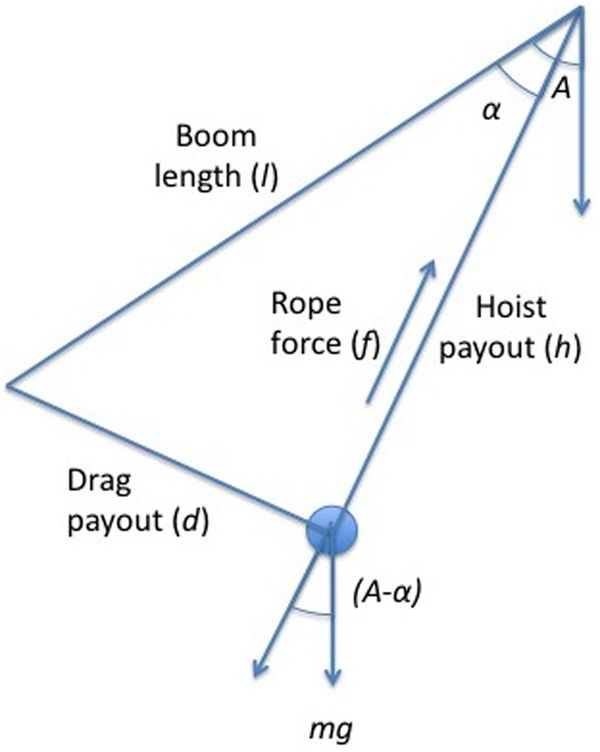
Hoist and drag forces vector diagram
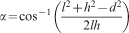
The bucket is modelled as a point mass, which is suspended by weightless ropes, with the dragline boom l, drag payout d and hoist payout h defining a triangle. The boom angle is (90−A)o and the angle between the hoist and boom is αo. Applying the cosine rule
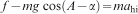
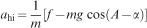
 ) and will increase as (A−α) decreases. Following the hoist rope force [f−mg cos(A−α)], hoist acceleration can thus be approximated as a linear function (ahi = a−bt) that will have a negative gradient (Fig. 5).
Hoist rope force model
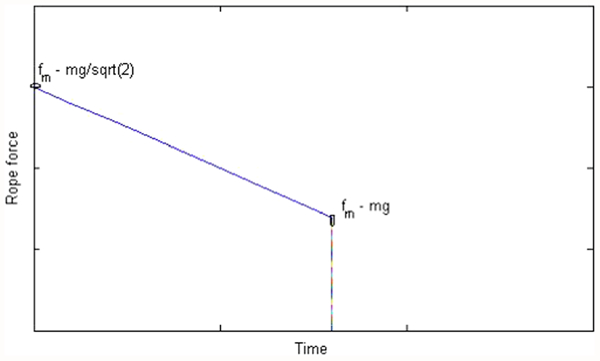
The hoist velocity profile, which is the integral of the acceleration curve, begins with a quadratic relationship (Fig. 6). A constant deceleration is assumed as the bucket is suspended approximately vertically just before dumping.
Hoist velocity profile
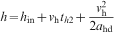
The area under the hoist velocity profile gives the total hoist distance h that is defined by
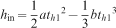
Three discrete time periods can then be calculated as
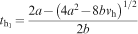
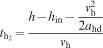


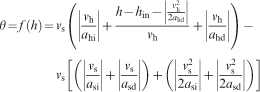
A special case occurs when h≤ho, θ≤θo; this means that neither the hoist nor the swing motion is able to attain maximum velocity. In these drag-limited scenarios, swing angles and hoist distances are determined by


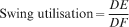
For a swing limited cycle (Fig. 7), where point B represents the dump point and OC represents the coincident limit, utilization of hoist capacity is defined as
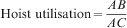
Utilisation of hoist capacity
Utilisation of swing capacity
The latter is potentially useful for calculating the work that is performed by a dragline. Traditional measures of dragline productivity consider the number of BCMs per hour of operation. This measurement takes no account of the percentage of hoist limited cycles. Just as haul truck work is calculated in tonnes multiplied by equivalent horizontal kilometres, the development of the swing/hoist coincident limit graphs provides an opportunity for measuring dragline work as BCMs multiplied by the equivalent swing angle. This can potentially be applied to the benchmarking of dragline performance across different operations where different pit and block geometries will influence the proportion of hoist limited cycles.
Parameter fitting
Performance monitoring data from a Mineware Pegasys dragline monitoring system on an operating dragline was collected for the period January to April 2011. Data for 22730 cycles was obtained and then imported into the MATLAB Analysis Program for determination of hoist and swing parameters.
Hoist and swing acceleration and velocity parameters were estimated from 5000 random successive cycles taken from this dataset. The velocity profiles exhibited considerable noise and a finite impulse response (FIR) filter, which employed moving averages, was used to smooth the signals before the estimation of the parameters. Another issue encountered during this parameter estimation concerned statistical outliers. Such points can bias results by having a disproportionate influence on the sample statistics. A further filtering of these outliers enabled the following model parameters to be estimated (see Table 1).
Model parameters
These parameters were substituted into equation (19) in order to calculate the coincident limits for the dragline.
To enhance the accuracy of cycle classification and to account for the payload variance, coincident limit functions were calculated for five different payload categories: less than 50 t; 50–80 t; 80–120 t; 120–150 t and greater than 150 t.
The solid line (mid-point) in Fig. 9 represents the coincident curve that was calculated for average payloads in the range of 80–120 t. The upper dashed line represents the coincident limit for an empty bucket (bucket tare weight), and the lower dashed line represents the case of maximum total suspended load (greater than 150 t).
Coincident limit graph with upper and lower payload limits
Implementation
The algorithm was subsequently implemented on the Mineware Pegasys performance monitor installed on the dragline. Data for 215034 cycles was obtained for the period May to August 2011 for each cycle and dig mode, and then imported into the MATLAB Analysis Program for statistical analysis.
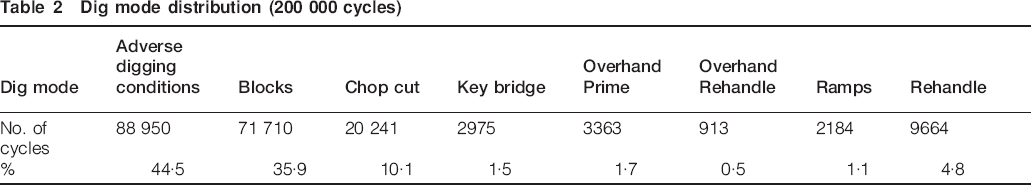
The Pegasys monitor requires dragline operators to manually input the dig mode code. Eight were in use at the time of the site visit. These were: adverse digging conditions, block, chop-cut, key-bridge, overhand, prime overhand, rehandle and ramps and rehandle.
Results and discussion
Table 2 shows that the operators classified 44·5% of the cycles as adverse digging conditions. This dig mode classification is open to interpretation for it could refer to poor fragmentation and/or to the presence of mud, which complicates the digging process and reduces the bucket fill factors. It could also refer to hoist limiting scenarios where deep digging and high spoiling complicate the swing phase. Frequent use of this code led the authors to believe that it is open to abuse. Mine management therefore decided to decommission this code from further use.
Dig mode distribution (200 000 cycles)
A density plot of dump points for all 200 000 cycles was prepared as a function of the swing angle and hoist height using MATLAB (Fig. 10).
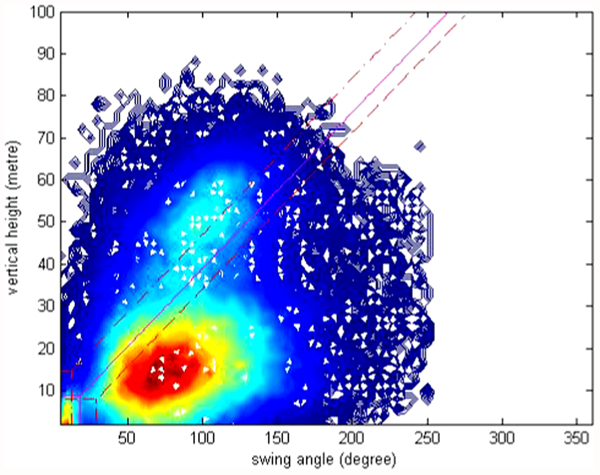
Density plot of dump points relative to coincident limits (all data)
Figure 10 shows two, high density, cluster areas for dump points (in red). One occurs in the swing limited zone and the other in the drag limited zone near the origin of the graph. Correlation with dig mode data indicated that this latter was related to overhand rehandle and ramp construction work being undertaken by the dragline during the sample period.
The coincident limit graph (Fig. 10) allowed for classification of the entire dataset according to cycle dependencies. Seventy per cent of the cycles were found to be swing limited, 27% were hoist limited, while only 3% were drag pay-out limited.
Cycle classification was also undertaken for data grouped by dig mode (Fig. 11). The dig modes with the highest proportion of cycle dependencies were:
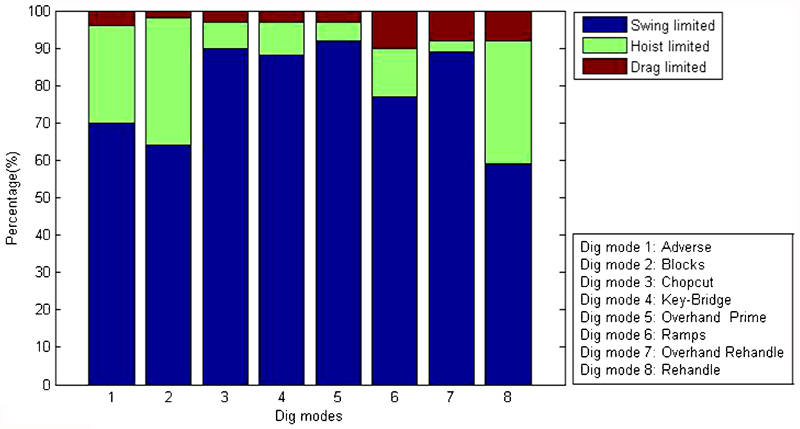
Cycle dependencies as function of dig mode
swing limited cycles (> 88%): chop cut, key bridge, overhand prime, and overhand rehandle
hoist limited cycles (>26%): adverse digging conditions, blocks, and rehandle
drag limited cycles (> 8%): overhand rehandle, ramps, and rehandle.
The coincident limit algorithm cannot, however, discriminate hoist-then-swing from swing-then-hoist cycles. An alternative algorithmic approach such as using artificial neural networks might usefully be investigated to overcome this problem.
Conclusions
An algorithm using a simple, graphical approach has been developed to classify dragline cycle dependences. This is based on coincident limits as defined by the locus of points where the swing and hoist motors work at full capacity for equivalent amounts of time. It is capable of distinguishing three cycle dependencies for swing, hoist and drag limited cycles.
The coincident limit algorithm was applied to data from 200 000 cycles on a dragline at a mine in Queensland's Bowen Basin. Seventy per cent of these cycles were found to be swing limited, 27% of cycles were found to be hoist limited and the remaining 3% were found to be drag limited.
The development of coincident limit graphs facilitates the possibility of measuring dragline-work as BCMs multiplied by the equivalent swing angle. This could be applied to benchmark dragline performances across different operations where differing pit and block geometries influence the proportion of hoist limited cycles.
There is also potential to apply the coincident limit algorithm to compare dragline swing-performances against historical performances in similar circumstances, and to compare current swing-performance with optimal-performance targets. This is currently being investigated in the ACARP-funded continuation project C21044.
Footnotes
Acknowledgements
The authors would like to thank the Australian Coal Association Research Program (ACARP) together with two nominated industry monitors for their support for this study.