
Abstract
It is well known that a major ventilation problem during deep cut mining is delivering the required amount of air into the immediate face zone. Line brattice face ventilation systems are commonly applied for medium and low coal seams in room and pillar mining method utilising continuous miner. It is assumed that the blowing curtain, as opposed to the exhaust curtain, generally achieves greater efficiency in delivering air to ventilate the immediate face zone. However, in real mining conditions both, the blowing and the exhaust curtain face ventilation systems suffer from one significant disadvantage – the intake air separates early from the rib and does not fully penetrates to the immediate face zone. This phenomenon is called flow separation. The portion of the intake air reaching the face can be <20% with the exact amount being a function of various parameters associated with the mine and ventilation design. The results presented in this publication clearly shows that curtain tight-rib distance, width of the entry, and curtain setback distance govern the flow behaviour at the face area. The performed analysis confirmed that changes in the intake air quantity have no significant impact on the flow patterns and the amount of air delivered to the immediate face zone.
Keywords
Introduction
Improper ventilation of the immediate face zone has both serious safety and health ramifications. Methane increases the risk of mine explosions and dust increases the risk of coal workers pneumoconiosis. Many of the methane ignitions in underground coal mines could be attributed to poor face ventilation. The advances in mining technologies had eliminated most ignition sources from coal mines, but the number of frictional ignitions at the mining faces increased following the introduction of continuous miners (Taylor and Karacan, 2010).
Although, significant progress has been made in the United States with the reduction of coal workers pneumoconiosis, severe cases continue to occur among coal miners (NIOSH, 2008) (see Fig. 1). Based on statistical data of the US Bureau of Labor, currently 8480 operators of continuous mining machines are employed in the US which is 10·66% of industry employment.
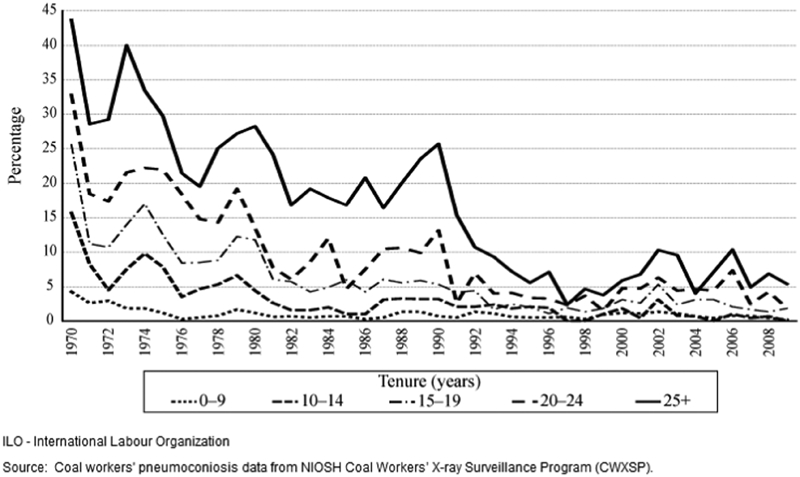
Percentage of examined underground miners with coal workers’ pneumoconiosis by tenure in mining (NIOSH, 2008)
Research in the last three decades have shown, that the use of scrubbers and water sprays during extended cut mining help to reduce dust at the face area and provides satisfactory face methane removal only if adequate air quantity is delivered to the face (Volkwein and Divers, 1988; Thimons et al., 1999).
One of the earliest studies of the airflow and methane distribution patterns in immediate face area ventilated by blowing curtain was performed by the Bureau of Mines (Luxner, 1969). Using smoke for flow visualisation, Luxner observed that flow patterns changed with the curtain tight-rib distance. Also, the tests showed that the airflow patterns were independent of the volume of air delivered by the line brattice system. Other studies conducted by number of authors (Gillies, 1982; Taylor and Goodman, 1997; Taylor and Zimmer, 2001) showed flow patterns that differ from Luxner's observations and the latest experimental results. The flow patterns in immediate face area and the flow separation phenomenon, while previously observed (Luxner, 1969) but ignored, has been confirmed in scaled, full scale and numerical tests (Wala et al., 2001). Results of this study showed that due to the flow separation the air penetrated to the immediate face zone is not sufficient for adequate face ventilation. This publication presents an extended study of the blowing curtain face ventilation systems and discusses the parametric effects on flow behaviour based response variables utilising results obtained from physical experiments and a statistically designed test program for computational fluid dynamics (CFD) simulations. Scaling analysis was used to derive analytical relationships among the investigated parameters and the response variables.
Experimental
During experimental study (Wala et al. 2000) different face ventilation arrangements have been investigated using 1∶15 scaled and full scale physical models. The scaled model is equipped with particle image velocimetry (PIV) measurement system. The PIV system consist of a dual head Nd:YAG laser, one megapixels CCD camera connected to a PC card frame grabber, and a timing control block to synchronise the triggers of the laser heads with the CCD camera. The flow is seeded with 1 μm size tracer particles. The laser optics creates a light sheet and illumines the tracer particles in a desired plan. The CCD camera records 50 image pairs at a rate of 10 Hz, storing them onto the PC memory. This image pairs are analysed with PIV software to determine velocity vectors. The processing software applying fast Fourier transformations and cross-correlation methods to produce a resulting set of velocity vectors. The result is a time averaged planar velocity vector map similar to the vector fields obtained by CFD simulations. That makes PIV systems invaluable tool for CFD code validation.
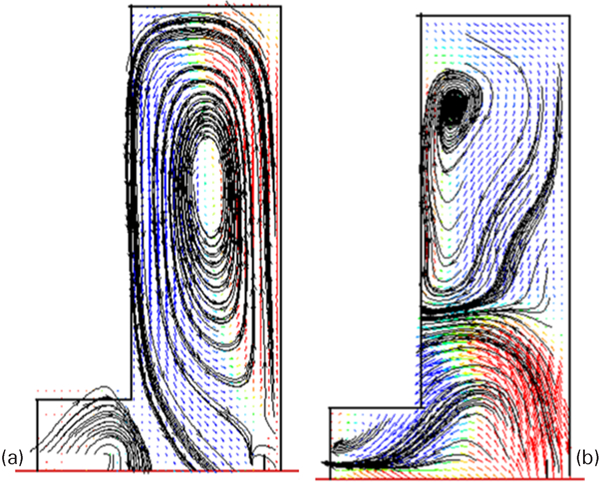
Two of the obtained by PIV flow patterns of face ventilation systems during deep cut mining are shown on Fig. 2. Both, the blowing and the exhaust system, showed flow separation. The results obtained on the scaled model were confirmed by full scale experiments (see Fig. 3) (Wala et al., 2001).
Images (PIV) of flow separation for blowing and exhausting curtain face ventilation systems (1∶15 scaled test)
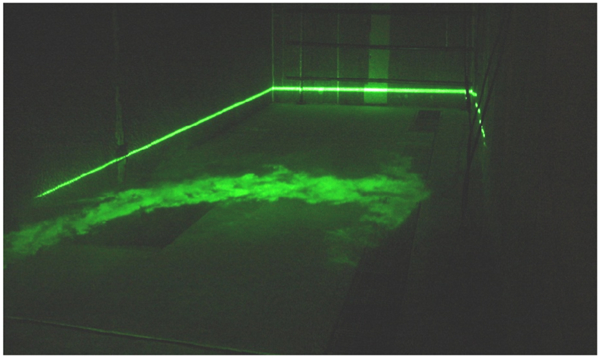
Full scale test: curtain is on left hand side of entry
Owing to its ability to deliver more of the intake air to the immediate face zone this research is focused on the blowing curtain face ventilation systems. The results showed that the flow behaviour changes for certain width of the entry (Fig. 4) and curtain tight-rib distance (Fig. 5). The observed flow behaviour showed no change and remained consistent for inflow rates of 1·3 m3 s−1 (2700 cubic feet per minute (cfm)), 1·7 m3 s−1 (3500 cfm) and 2·6 m3 s−1 (5500 cfm). For widths of entry close to 4·6 m (15 ft), the flow fell into a state of unsteadiness, where the jet stream flip-flops between the face and the off-curtain side rib.
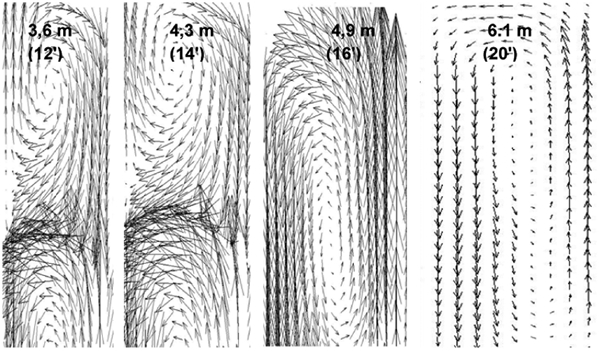
Data (PIV) for flow behaviour at face area for different entry widths: curtain is fixed at 0·6 m (2 ft) from rib
Data (PIV) for flow behaviour at face area for different curtain tight-rib distances
Further tests showed that changes in height of the entry and roughness of the wall have very little or no impact on the flow behaviour at the face area.
According the obtained results the flow behaviour at the face area was divided into three categories: A, flow penetration; B, flow separation and C, unsteady flow.
The experimental results organised into categories of flow behaviour depending of the entry width and the curtain tight-rib distance, are summarised in Table 1.
Observed categories of flow behaviour for blowing curtain face ventilation systems regardless of inflow rate
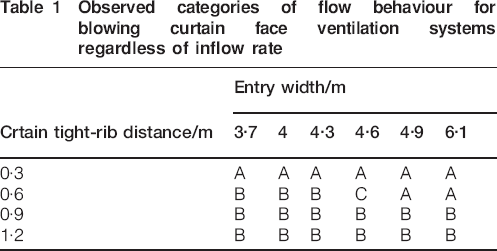
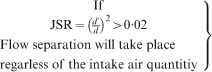
In US mine practice, the curtain is placed 1·05 m (3·5 ft) to 1·2 m (4 ft) from the rib, dependent of the bolting plan. For this arrangement of the blowing curtain, the experimental results showed that flow separation takes place for the whole range of entry widths regardless of the intake air quantity.
Study of flow separation phenomenon by CFD in blowing curtain face ventilation systems
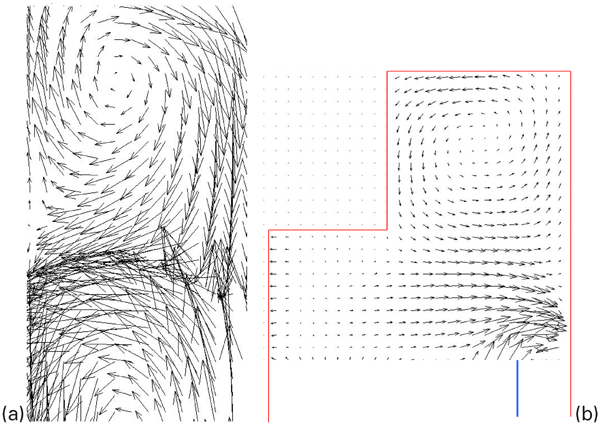
For this study, the authors used commercial software SC/Tetra Thermo-fluid Analysis System. The grid used for simulations of a face ventilation system is an unstructured mesh consisted of approximately 1·2 million elements. Renormalisation Group k-epsilon turbulence model was used to solve the Navier–Stokes equations in double precision. The code has been validated utilising experimental data obtained by scaled and full scale experiments (Wala et al., 2004). Figure 6 depicts two results of the performed CFD code validation for flow penetration and flow separation respectively. The setup represented blowing curtain face ventilation system with 10·7 m (35 ft) setback, 4·3 m (14 ft) box-cut and inflow rate of 1·3 m3 s−1 (2700 cfm). Figure 6a shows flow penetration velocity field created by blowing curtain fixed at 0·3 m (1 ft) from the rib. Figure 6b shows flow separation, when the blowing curtain is fixed at 0·6 m (2 ft). Figure 7 ilustrates flow separation phenomena in three dimensions. At the discharge of the blowing curtain, the intake flow almost immediately separates from the rib - thus forming a primary air stream. The primary air stream flows across the entry toward the opposite rib and separates again. Tests showed that after the separation around 80% of the primary air stream joined to the return stream. The rest of the air flows along the off-curtain rib inby the face, thus forming the secondary air stream. Only the secondary air stream ventilates the face.
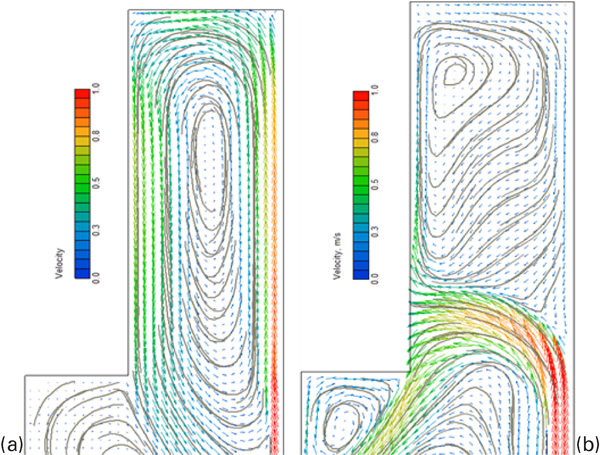
Simulated velocity fields for CFD code validation study
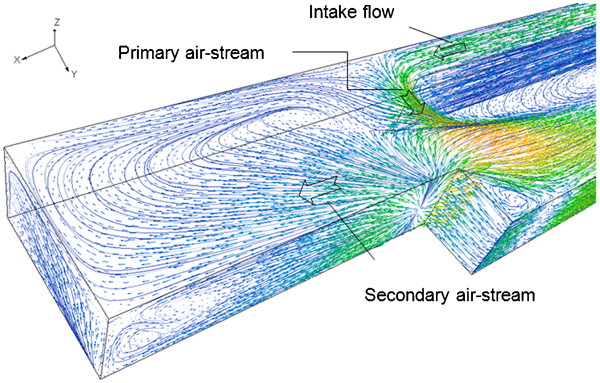
Simulated flow separation using validated CFD code
Pressure forces need to be considered in addition to the velocity field to provide enough information to understand the phenomenon and to explain its independency of intake flowrate. It can be seen that the changes in the inflow rate caused change in the static pressure distribution and have very little impact on the flow patterns (Fig. 8).
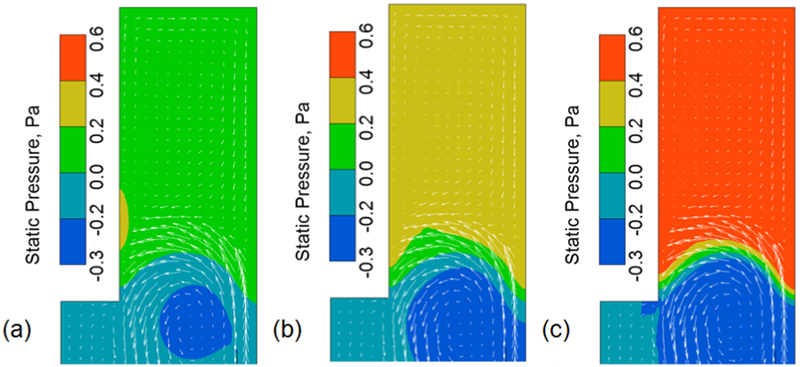
Static pressure distributions at face area for three different inflow rates
As the flowrate increases positive static pressure builds up in the confined space between the face and the primary air stream. The intake flow separates relatively at the same location, regardless of the intake flowrate. The full scale experiments for CFD code validation (Wala et al., 2004) confirmed the Luxner's observations, that the methane concentrations in areas ventilated by secondary air stream show little response to the intake air volume changes. Methane concentrations in areas ventilated by the primary air stream are those, directly affected by variations in intake air volume. The air flow velocities were measured using three-dimensional anemometer. The methane concentrations were measured using a matrix of three layers with 36 methane sensors in any of them. Figures 9 and 10 show results of SC/Tetra CFD code validation for flow and methane concentration.
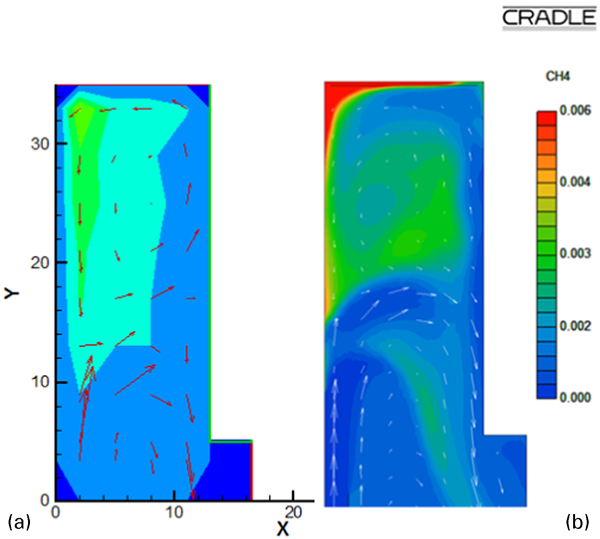
Results of SC/Tetra CFD code validation for flow and metahne
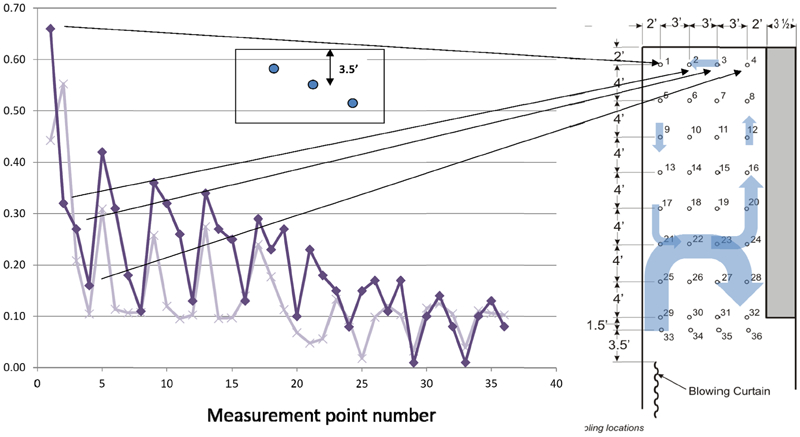
Experimental data (bold line) v/s simulation results for midplane
The experiment set-up represented an equipment free entry ventilated by blowing curtain face ventilation system with 10·7 m (35 ft) setback, 2·83 m3 s−1 (6000 cfm) air flowrate and 0·00249 m3 s−1 (5·27 cfm) methane flowrate. The blowing curtain is on the left hand side placed at 0·6 m (2 ft) from the rib.
Corelation test of the experimental data v/s simulated methane concentrations showed correlation factor equal to 0·72.
It can be seen clearly (Fig. 9) how the secondary air stream transports methane from the face forming recirculation area between the face and the primary air stream. Part of the secondary air stream penetrates underneath the primary air stream and joined the return stream. The methane concentration at that zone increased. Second recirculation can be seen in the return zone of the face area.
Analitical study
Evidence provided from previews studies clearly shows that the geometry of the entry is a critical factor for the flow separation at the face area. Surprisingly, the air streams showed little response to the wall roughness changes. The effect of changes in the air viscosity to the flow patterns was assumed not to be taken into account, but the viscosity participated in the wall boundary conditions and into the Navier–Stokes momentum conservation equations. Therefore, the air viscosity cannot be eliminated from the research by default. The observed independence of the flow patterns from the intake air quantity also need to be generally proven and supported by theoretical explanation.
Analysis of variance (ANOVA) method (Box et al, 1978) was used to perform a parametric study for the flow behaviour of the blowing curtain face ventilation systems. Seven parameters were included in this study:
inflow rate Qin
width of the entry w
curtain tight-rib distance d'
height of the entry h
curtain setback distance s
wall roughness r
air viscosity
The technique of ANOVA was used to determine the impact of this seven parameters to the primary air stream's separation distance from the curtain discharge Xsep and the air quantity delivered to the face Qf. The sensitivity of Xsep and Qf to the variance of the listed parameters were analysed using data by series of CFD simulations particularly designed for this study. The theory of design and analysis of experiments (Montgomery, 2009) required parametric matrix of 27 to perform this study. Therefore 128 simulations were performed using validated CFD code. The obtained results were introduced into a Matlab program to implement the ANOVA technique. To test the ability of a model to accurately predict the response parameter value a diagnostic check was performed using Normal plot of residuals (Fig. 11). The performed diagnostic check indicates the model appears reasonably appropriate for the conducted analysis.
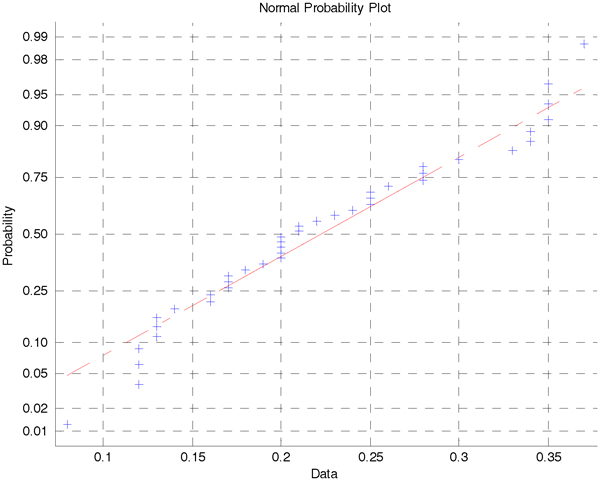
Diagnostic check
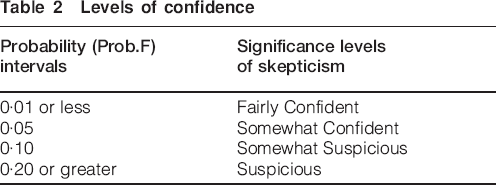
Analysis of variance was conducted under the null hypothesis H0: the modification has made no difference. If the H0 is rejected, the alternative hypothesis H1: a statistically significant difference has occurred. The levels of confidence to reject H0 hypothesis were accepted as given in Table 2.
Levels of confidence
The significance of the individual parameter effect was first measured by running one way ANOVA tests for Xsep and Qf respectively. Then the model was modified based on the rejected terms (Prob.F⩾0·20) and the sensitivity of Xsep and Qf to the variance of the remained parameters and associated interactions was measured using four way ANOVA test.
The results of the analysis of variance supports the following conclusions:
The inflow rate Qin (Prob.F>0·95), the air viscosity and the height of the entry are not significant for the variation of Qf and Xsep.
It is fairly confident (Prob.F<0·006) that the variations of Qf and Xsep are caused by the impact of three significant parameters, namely tight-rib distance d’, width of the entry w and curtain setback distance.
It is confident (Prob.F<0·03) that the wall roughness plays role for the flow penetration scenarios. In this case it is fairly confident (Prob.F<0·002) that the associated parameter interaction is of type w*d'*s*r.
The primary air stream always follows the static pressure intercept zone (Fig. 8).
Analysis of covariance showed that the sought relationships Qf(d’), Qf(w) and Qf(s) are expected to be non-linear.
To obtain the relationship between the geometry of the face area and the dynamic parameters, a scaling analysis using the law approach method (Emory et al., 2009) were performed. Heuristic arguments to obtain the functional relationship among dimensionless quantities (known as pi-numbers) based on physical insight are described below.
Accordingly the performed analysis, flow separation occurs when the parameters tight-rib distance d′ and width of the entry w ( = d+d′) exceed a certain value (Fig. 12).
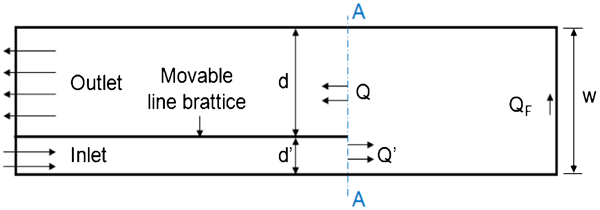
Simplified face area with blowing curtain
The flow behaviour in the studied face area is governed by the laws of mass conservation and momentum conservation. The Reynolds numbers determined for the intake jet Re’ were >60 000 which indicates developed turbulence conditions. Inertia and pressure forces in the motion of air are dominant compared with the forces of internal friction (viscous term).
When airflow separation takes place the air quantity delivered to the face Qf is less than the inflow quantity Q′


Taking into account the similarity of the airflow into the face areas in different scales and adopting scaling analysis as a tool for better understanding of the observed phenomena we obtain the first pi-number

Following the outcomes of the study, not the intake air quantity, but the kinetic energy of the inflow stream is a key parameter for the observed airflow behaviour.
Furthermore, the kinetic energy of the intake air stream K’ will always be greater than the kinetic energy of the return air stream K.
Air-stream kinetic energy is described by equation (8)

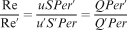
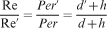
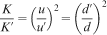
Scaling the kinetic energies of the return air stream to the intake air stream in the cross-section A–A (see Fig. 10), we obtain another important dimensionless pi-number
Using the experimental data we found an empirical criterion (10), called Jet Separation Ratio (JSR), to distinguish the flow separation cases (scenarios) from the cases where no flow separation occurs.
Conclusions
This paper discusses airflow behaviour at the face area ventilated by blowing curtain during deep cut mining utilising continuous mining technology. The obtained results could be generalised for all application of blowing line brattice for ventilation of confined spaces such as rooms and chambers. In conclusions, the following more important outcomes of this study should be highlighted.
The airflow separation phenomenon cannot be prevented by increasing the inflow rate, because it is independent of Reynolds numbers.
The flow separation of the intake flow governs by two parameters: curtain tight-rib distance d' and width of the entry w.
The air quantity delivered to the face Qf depends on d’, w and also on the curtain setback distance.
The intake flow immediately separates from the wall when the blowing line brattice hangs 1·2 m (4 ft) from the rib, regardless of the intake air quantity.
A criterion to predict flow separation, called JSR, based on the geometry of the face area was proposed.
A commercial CFD code n Cradle SC/Tetra for Windows has been validated. The authors see SC/Tetra CFD as a potential tool for mine ventilation system study and design.
The flow separation at the face area and its prevention is a subject of study that is still going on and will be publish in the future.
The insight obtained by this study changed the direction of our research for finding a solution about the flow separation at the face area. Currently there are ongoing tests on a prototype designed to significantly improve the effectiveness of the blowing curtain face ventilation systems during the deep cut continuous mining.
Footnotes
Acknowledgements
This work is a part of a project funded by the US National Institute for Occupational Safety and Health (NIOSH) (grant no. 2000-2009-30678).