
Abstract
Coiled tubing (CT) drilling offers more efficient drilling operations compared to normal drilling practises resulting in lower operational costs and drilling time in oil and gas operations. This technology is recommended to be used for mineral exploration drilling in hard rock. This requires drilling micro-boreholes at very high speed with small size cuttings. A large volume of such small size cuttings can influence the rheological properties of the drilling fluids significantly.
The aim of this study is to understand the effect of small size inert cuttings on the rheological properties of drilling fluids and its consequences on pressure drop changes in the annulus space. Experimental tests were performed on cuttings collected from a mining site, and the results indicated that the fluid rheology is sensitive to the cuttings size. This conclusion suggests that careful measurement of rheological properties of the mud is necessary when it is designed for drilling hard rocks.
Keywords
List of symbols
annulus area (m2)
best index value
d1 = 2R1 (m)
d2 = 2R2 (m)
hydraulic diameter (m)
friction factor (dimensionless)
annulus gap (m)
fluid consistency index (Pa s n )
local power law fluid consistency index (Pa s n )
inverse of n (dimensionless)
fluid behaviour index (dimensionless)
local power law fluid behaviour index (dimensionless)
given or actual flow rate (m3 s−1)
estimated flow rate (m3 s−1)
outer radius of inner pipe for annulus geometry; 0 for pipe geometry (m)
inner radius of outer pipe for annulus geometry; inner radius of the pipe for pipe geometry (m)
Reynolds number (dimensionless)
estimated Reynolds number (dimensionless)
average velocity (m s−1)
width of the slot (m)
measured values
predicted values

average value of the parameter
Greek letters
shear rate (1 s−1)
Newtonian shear rate at the wall (1 s−1)
pressure loss per unit length (Pa m−1)
plastic viscosity in Bingham Plastic model (Pa s−1)
= τy/τw (dimensionless)
fluid density (kg m−3)
shear stress (Pa)
wall shear stress (Pa)
yield stress (Pa)
middle values of yield stress to determine the best value (Pa)
minimum and maximum values of the yield stress boundary (Pa)
Introduction
A large volume of the world's mineral resources occur deep underground and need advanced drilling technologies to determine their extent. For example, in Australia exposed surface minerals account for only 20% of the total resources, leaving 80% of the underlying deeper hard rock deposits not having been exploited sufficiently yet. Hence with this vast amount of deep resources and high demand for minerals, deep exploration is a crucial need (Uncover, 2012).
Coiled tubing (CT) has been introduced for mineral exploration drilling to deliver a faster, deeper and cheaper operation (Hillis, 2012). However this technology transfer from oil and gas needs modifications to be applicable for mineral exploration. The challenges and recommended solutions for this technology transfer have been addressed in many investigations (Kamyab et al., 2012, 2013a, 2013b; Roufail et al., 2013; Mokaramian et al., 2012a; Mokaramian et al., 2012b).
The drilling fluid rheological properties need to be determined through laboratory tests in order to study the cuttings transport and pressure loss along the annulus space. Existence of small size cuttings in hard rock drilling can affect drilling fluid rheological properties. For coarse particles, Doron et al. (1987) and Doron and Barnea (1996) mentioned that the mixture (fluid and particles) viscosity can be assumed to be equivalent to liquid viscosity because the coarse particles do not affect the viscosity of the whole mixture. Similar conclusions have been reported by other investigators (Naganawa and Nomura, 2006; Xiao-le et al., 2010), all of whom did their studies with reference to oil and gas applications.
In oil and gas applications, the concentration of the cuttings in the annulus space should be kept below 5% by volume (Albright et al., 2005; Kelessidis and Bandelis, 2004). Also, the flow regime in the annulus section is usually laminar. Therefore, owing to low cuttings concentration and low velocity, the difference between the annular pressures exerted by the mud with and without cuttings is negligible. However, in mineral exploration drilling, because of the higher flow rate required to drive the turbine and a narrow annulus size, the velocity in the annulus space is high, which means the flow regime is in a transition or turbulent mode.
Pressure loss of smaller particles in liquid flow is higher than that of coarser particles. This is because smaller particles mix with the liquid and become part of the liquid mixture, whereas coarser particles dampen the turbulency of the flow (Fangary et al., 1997). Therefore, the effect of the cuttings on pressure loss of powder size cuttings needs to be considered.
In this study, the rheological tests of mud and mud-containing particles with different concentrations were carried out on some cuttings taken from a mining site in order to study the effect of small size cuttings on drilling fluids. This was followed by calculations of pressure loss considering turbulent flow in order to investigate the extent of pressure loss because of concentration of cuttings in the drilling fluid.
Rheological models of drilling fluid
In order to produce dry samples from wet drilling muds, several steps were undertaken in the lab. Different washing fluids were tested to clean a small quantity of cuttings. Then the best fluid was used to wash all the cuttings, namely the cleaning fluid providing the least change in cuttings size distribution from wet to dry samples. The details of the sample preparation procedure are presented in Appendix.
To examine the fluid flow characteristics, e.g. pressure drop, the rheological properties of the drilling fluid need to be determined. Several mathematical models have been proposed to fit the experimental shear rate (γ)–shear stress (τ) data. Among these models, the Bingham Plastic model (Bingham, 1922) represented as


This model has three parameters (τy, K and n) and is used by the American Petroleum Institute (API, 2010) standard (API RP 13D) for rheology and pressure loss calculation of oil and gas applications. API RP 13D is the standard for rheology and hydraulics of oil–well fluids. Kelessidis et al. (2006) performed an extensive literature review of previous investigations in rheological models used in the oil industry and proposed a golden search method to find the three unknown Herschel–Bulkley (HB) parameters. Under their method, yield stress is bound to a limited range in which the lower value of the range is 0 and the upper limit is the minimum shear stress value of the dial reading data. Yield stress values in the range are found using the golden search method to find the best value. To analyse if the determined values fit accurately, the best index value (BIV) optimisation method is used
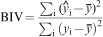
In this equation, yi represents the measured actual values of τ,  represents the predicted values of shear stresses and
  is the average value of the measured parameters. The closer the value of BIV to 1, the more accurate the fitting.
In oil industry applications, only the fluid rheological properties are measured but the effects of cuttings on the rheological properties are not considered. The reason for this is that the cuttings are large in size and the flow regime is laminar as the flow velocity is low. However, in this study the effect of cuttings on rheological properties is included because the cuttings produced in hard rock drilling using a diamond impregnated bit are of very small size and the annular flow velocity needs to be high to operate the downhole motor at a high speed, which results in the flow regime being in transition or turbulent.
The following section explains in detail the process of the experiments conducted to determine the rheological properties of the muds used in this study.
Experimental rheology tests
In this section, the process of preparation of three different muds used in this study and the lab experiments performed to determine their rheological properties are explained. Also, the results are presented and discussed.
Mud preparation
Three mud systems with different properties were prepared for the purpose of this study. The composite of these muds include
bentonite (Ausgel): 22 g; PAC L (AMC PAC L): 3 g; tap water: 1000 mL
PAC R (Ezee PAC R): 1 g; anionic PHPA (CR 650): 0⋅22 g; lubricant (Superlube): 2⋅17 mL; tap water: 1000 mL
Shale inhibitor (Shalehib NC): 9 mL; PAC R (Ezee PAC R): 2⋅7 g; PHPA (Clay Doctor): 3⋅56 g; tap water: 1000 mL.
The material in parentheses is the trademarked name of products developed by AMC.
Polymers provide viscous properties to the drilling fluid depending on their monomer. If they consist of long chains, they give higher viscosity, whereas shorter chain polymers provide moderate viscosity. PAC L is a short-chain polymer that gives the mud the filtration control properties by the formation of a non-permeable filter cake on the hole surface. A small amount of Ezee PAC R could provide higher viscosity than bentonite (Mandal, 2012).
CR 650 is a long-chain polymer that gives encapsulation, i.e. covering the particles to avoid them sticking together and preventing disintegration, as well as increasing the viscosity (Mandal, 2012).
Lubricants reduce frictional forces and provide easier movement of the inner tube inside the hole, and in small annulus space holes, this is a necessity. Shale inhibitors prevent shale and clay particles interacting with the mud. The Clay Doctor provides encapsulation properties without changing the viscosity (Mandal, 2012).
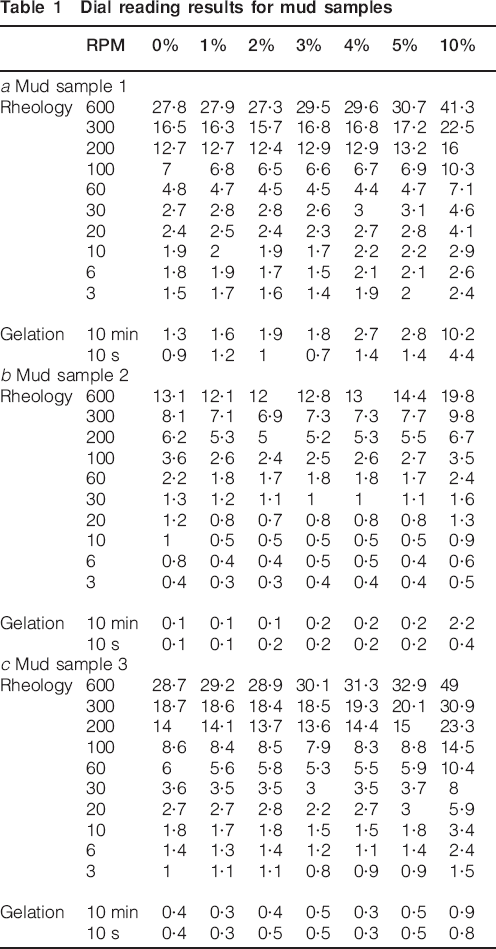
Different muds were prepared with different concentrations of cuttings of 1, 2, 3, 4, 5 and 10% by volume. The rheological tests were performed using a 12 speed Fann V-G viscometer. The rheology results are shown in Table 1a–c for the three muds, respectively.
Dial reading results for mud samples
Lab data analysis
Taking a closer look at the data presented in Table 1a–c indicates that at first there is a slight decrease in the dial readings as a result of an increase in cuttings percentage. However, this trend quickly takes on an increasing trend. The initial decline observed is because of the small amount of cuttings in the mud that do not contribute much to plastic viscosity but partially break the clay–clay and clay–polymer interaction and gelation network in the mud. Further increasing the amount of solid causes more particle–particle frictional force, predominantly contributing to the plastic viscosity, which would cause the overall viscosity to increase.
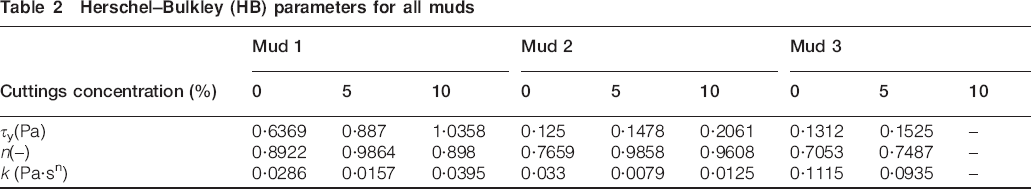
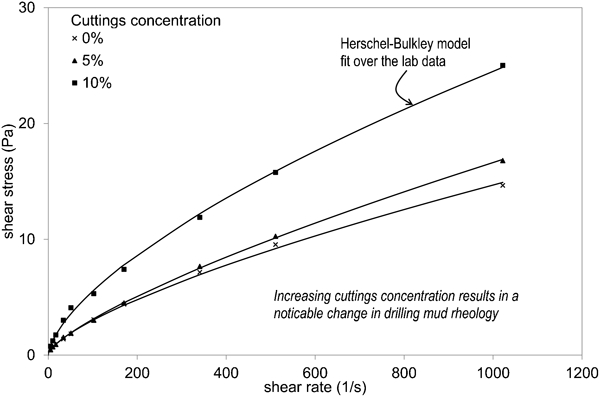
In this study, a HB model is fit to the lab data to find the model rheological parameters. These parameters will be used in the next section to calculate pressure drops as a function of changing the cuttings concentration in three different muds. Also, the BIV method was used to show the closeness of the fit. The results are shown in Table 2. It is important to note that in this table, the data corresponding to cuttings concentration of 10% for mud 3 are not shown. This is because of the fact that using the fitted curve the yield stress is estimated to be very low, which is not realistic. In real applications of hard rock drilling, however, the flow rate is very high, which corresponds to high shear rates. Therefore, the data used for pressure loss calculations in the Cuttings Concentration Effect on Pressure Drop section correspond to high shear rates where the curve shows a very good fit to the data, and this ensures that it has no impact on the presented results.
Herschel–Bulkley (HB) parameters for all muds
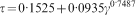
For example, for 5% cuttings concentration in mud sample 3, the following equation shows the relationship between shear rate and shear stress
As examples, plots of shear rate–shear stress data and the best HB fit corresponding to mud sample 3 for three cuttings concentration of 0, 5 and 10% are shown in Fig. 1. From this figure, it is seen that at low shear rates the shear stress for 0 and 5% cuttings is very close; however at shear rates larger than 200 s−1, the effect of cuttings will become apparent. This effect at a cuttings concentration of 10% is very significant. While in practice one may not expect more than 5% cuttings concentration in the mud, the calculations presented in the next section will indicate the pronounced effect of this volume of cuttings on pressure drops expected along the annulus space.
Herschel–Bulkley (HB) parameters for mud sample 3 at three cuttings concentration
Cuttings concentration effect on pressure drop
The pressure drop estimation formula considers two sets of equations. The rheology equations take into account the fluid properties, whereas the field or equilibrium equations consider the effect of the shape of the flow channel (Kelessidis et al., 2006). For an annular space, which is the flow channel considered in this study, developing field equations for exact annulus geometry results is complicated formulae; therefore, it is a common practice to simplify this geometry with a slot (i.e. two parallel planes) approximation. This generates a simpler model that offers reasonably accurate results especially when the annulus diameter ratio or aspect ratio is greater than 0⋅3 (Hanks, 1979; Bourgoyne et al., 1986; Fordham et al., 1991; Founargiotakis et al., 2008; Kelessidis et al., 2011).
The developed models for pressure drop estimation consider different flow regimes (laminar, transition or turbulent), fluid rheology models (Bingham Plastic, PL or HB), pipe eccentricity and pipe rotation.
A vast amount of research has been performed to study fluid flow in annular sections in the past decades, which includes analytical solutions, numerical simulations and experimental studies. For example, Zamora et al. (2005) performed a comparison of annulus pressure loss between the API standard model and field data. Laird (1957) proposed one of the initial fluid flow models that considered laminar flow of Bingham Plastic fluids in concentric annulus geometry. He solved semi-analytically the governing fluid flow differential equations. Later on, other investigators (Hanks, 1979; Iyoho and Azar, 1981; Hussain and Sharif, 1997) improved the laminar fluid flow with the help of analytical, semi-analytical and numerical methods in addition to the laboratory experiments. No analytical solution for turbulent flow exists as unlike laminar flow it does not follow any specific streamlines and therefore analytical solutions cannot be developed for a turbulent flow. Instead, correlations developed based on experimental tests have been presented for modelling turbulent flows (Hartnett and Kostic, 1990; Founargiotakis et al., 2008; Sorgun et al., 2012).
In this study, as stated in the previous section HB is considered as the fluid rheological model. The inner pipe is considered to be at the centre of the outer pipe (concentric geometry). In addition, to simulate the cutting and fluid flow transport in the CT drilling in the annulus space, the inner pipe is assumed not to rotate.
Kelessidis et al. (2006) developed an analytical solution for laminar flow of the HB rheological model in an annular space using the slot approximation. They proposed the following equation
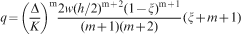
Figure 2 presents a flowchart explaining the various calculation steps to estimate the pressure loss based on equation (6) on a trial and error basis. The only unknown in this solution is pressure loss per unit length (Δ = dP/dL). However, the explicit formula for Δ is not available, so implicit solutions need to be used to find the results.
A flowchart to find the pressure loss of a laminar flow regime for a HB fluid in the annulus space
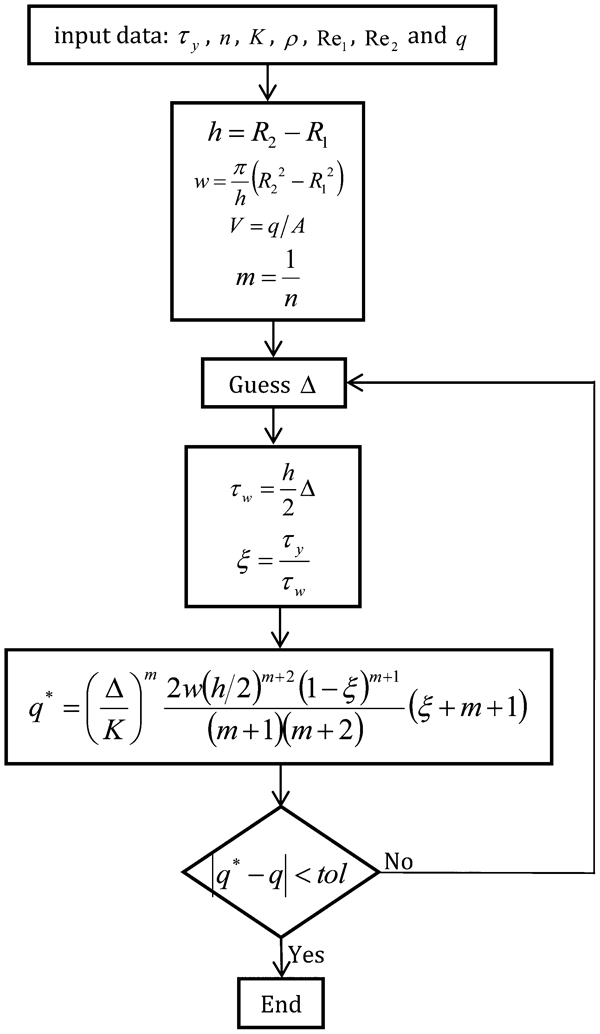
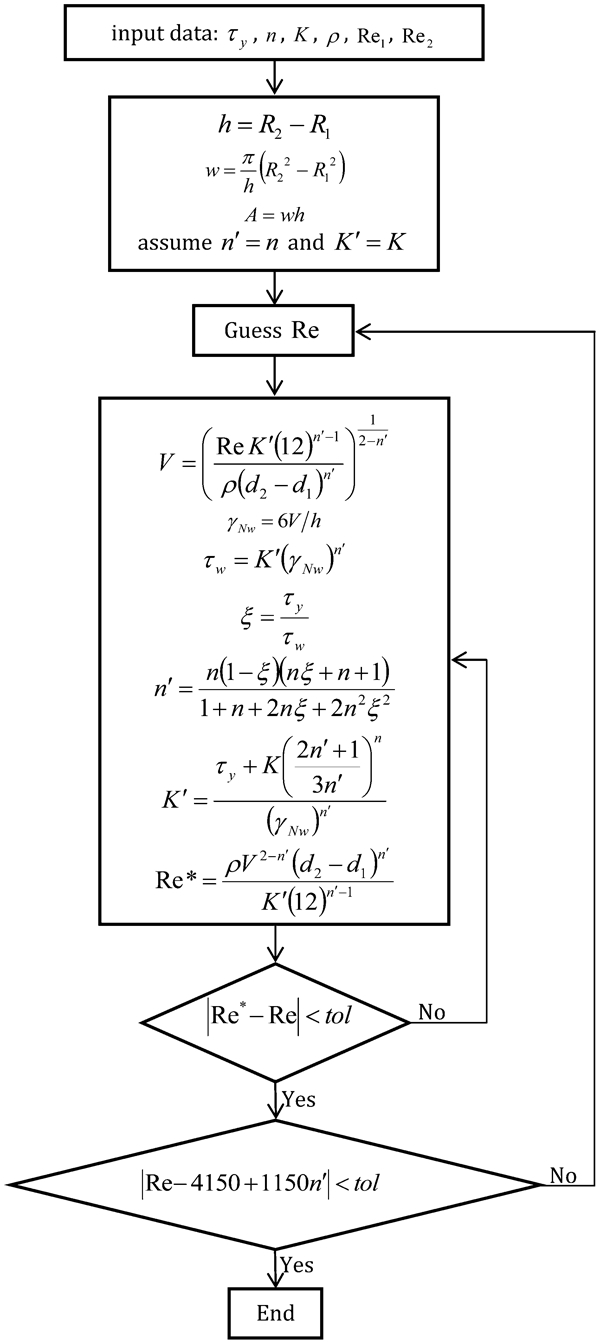
Founargiotakis et al. (2008) proposed an empirical solution for pressure drop estimation of a HB fluid at the transition and turbulent flow regime in the annulus space. The key to the solution in their approach is to convert the HB parameters to local PL parameters (n′ and K′) and then to find the Metzner and Reed (1955) Reynolds number. The flowchart explaining the steps to be taken in determining the pressure loss for a turbulent flow using this empirical solution is shown in Fig. 3. Similar to the model presented in Fig. 2, this is also an iterative calculation process. Also, the friction factor is calculated using an iterative approach. The calculation continues until the estimated flow rate converges to the original values presented by the user.
A flowchart to find the pressure loss of a turbulent flow regime for a HB fluid in the annulus space
The transition is assumed to be a region instead of a single point. Therefore, Metzner and Reed (1955) have suggested to use the following limiting boundaries for the transition boundary


Another trial and error method is used in Fig. 4 to find the solution for the transition boundary based on these limits.
A flowchart to find the transition–turbulent boundary Reynolds number for a HB fluid in the annulus space
In this study, the following data were used to calculate the pressure loss in the annulus space corresponding to the coil tube drilling introduced in this work
annulus size: the hole size is assumed to be 7 cm, and the pipe outside diameter is 5 cm
Density
for mud: 1010 kg m−3
for 5% cuttings in the mud: 1094 kg m−3 (mixture density = 0·95×1000+0·05×2700 = 1094)
for 10% cuttings in the mud: 1180 kg m−3
The flow rate required to operate the turbine is estimated to be about 6 L s−1. Therefore, the velocity in this annulus space would be approximately 3 m s−1
Rheological properties: rheology parameters of mud 3.
To understand the effect of different annulus spaces, another hole size (8 cm) was used while keeping the other parameters constant. For the flow rate of 6 L s−1, the velocity in the annulus (5 cm/8 cm) would be 1⋅96 m s−1.
Figure 5 shows the effect of cuttings on pressure loss for two different annulus configurations. The solid (left) and broken (right) vertical lines shown on each of the curves correspond to the laminar–transition and the transition–turbulent flow boundaries, respectively. However, for the 10% cuttings case only the laminar–transition boundary line is visible within the presented range of velocity. At low flow velocities where the flow is laminar, the difference between 0 and 5% cuttings concentration in the mud is small but at higher velocities, this difference becomes more pronounced. For example, for a 5 cm/7 cm annulus at 3 m s−1 velocity, the pressure loss is 7058 and 8101 Pa m−1 for 0 and 5% cuttings concentration, respectively. This means that an increase in the cuttings concentration from 0 to 5% results in an increase in pressure loss of 14⋅8%. This difference would be much higher considering a change in cuttings concentration from 0 to 10%. Likewise, for a 5 cm/8 cm annulus at 1⋅96 m s−1 velocity, the pressure loss is 2207 and 2486 Pa m−1 for 0 and 5% cuttings concentration, respectively. The increase in pressure loss as a result of this increase in cuttings concentration is about 12⋅6%.
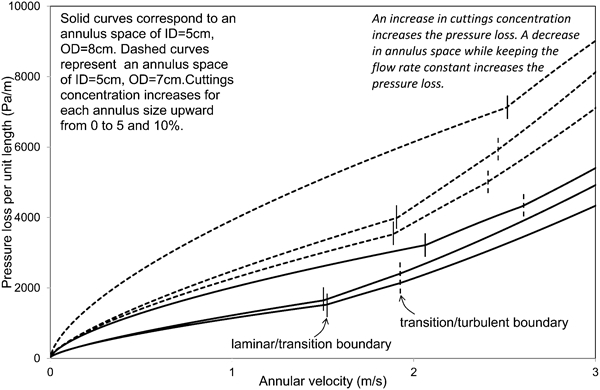
The effect of velocity on pressure loss for mud sample 3 with different concentrations of the cuttings and different annulus sizes
The above results show that there is a significant impact from cuttings concentration on pressure loss in micro-borehole coil tube drilling for mineral explorations because of the small size of the annulus space, large slurry velocity and specific rheological properties of the mud. The results of Fig. 5 show that while keeping the flow rate constant, increasing the annulus space would reduce the pressure loss considerably. However, drilling a bigger hole needs more energy that has to be provided with a more powerful turbine motor. Hence, the motor needs more flow rate to provide the desirable rotation speed to drill the hole with an adequate speed. Therefore, finding the best drilling parameters needs optimisation of all of the following parameters together in order to achieve a faster and cheaper operation: rate of penetration (ROP), flow rate, pressure loss, hole and CT size.
Conclusions
The results of this study indicate that in hard rock drilling, the effect of small size cuttings in drilling mud rheological properties is noticeable and should be considered. This is contrary to the applications in the oil and gas industry where the effect of large size cuttings on drilling fluid rheology is negligible. The results of lab experiments indicate that this effect is more pronounced at higher fluid velocities. This corresponds to the applications in hard rock drilling where high velocity is required to rotate the downhole turbine motor at a very high speed for optimised drilling. Using the rheological parameters of the drilling muds obtained from a mineral exploration site, the calculations indicate that pressure drop along the annulus could increase by 15% when the cuttings concentration increases from 0 to 5% considering an annulus size of ID = 5 cm and OD = 7 cm.
Footnotes
Acknowledgements
The authors would like to express their sincere appreciation to the Deep Exploration Technologies Cooperative Research Centre (DET CRC) for their financial supports towards this project (DET CRC Document 2012/071). The authors also express their thanks to Imdex: AMC Research and Development Laboratory for facilitating the execution of the experiments. A special thanks goes to Peter Kanck from the DET CRC for providing the cuttings samples and technical input.