
Abstract
The New Mine Level Project is a 130 000 tonnes per day (tpd) panel caving project set to start in 2017. The high stresses, complex structural setting and high mining rates present major challenges in terms of seismicity management and rockburst hazard reduction. This paper is a case study of the calculation of the energy requirements needed to design a dynamic support system for this operation. This analysis starts with the estimation of the seismic source, forecast through the use of numerical modelling and verified with observed past data; later peak particle velocity (PPV) is calculated at the drifts using a PPV attenuation model and an amplification factor is used near the excavations. The amount of fractured rock around the drifts that could be ejected by a seismic event is calculated through numerical modelling. With the ejection velocity estimated from PPVs, energy demand is obtained. All the values resulting from numerical analysis were compared to historical data of similar mine sectors. As the results show that the methodology used in this paper agrees well with previously observed rockburst episodes, it was used to calculate the yielding support of this new deep mine project.
Keywords
Introduction: New Mine Level Project and use of yielding support
The New Mine Level Project is a 130 000 tonnes per day (tpd) panel caving project that will be the deeper continuation of the current El Teniente copper mine, in the mountains of central Chile. This new project is planned to start production in 2017. Previously, seismic activity and rockburst events have occurred at El Teniente (Araneda and Sougarret, 2007; Rojas et al., 2000). New sectors will be located 250–300 m deeper, with increasing stresses where fault slip events are to be expected (Potvin and Wesseloo, 2008; Jarufe, 2010; Potvin et al., 2010). The management of the seismic response of the rock mass and the use of containing measures is required to increase the safety of the mining process.
This project is located approximately 250 m directly below current El Teniente mine operations and at a depth of 1·2 km below ground surface. This vertical load added to the horizontal East–West tectonic stress compression and also local geological events defines a stress field (Table 1) that when paired with a strong stiff rock mass (120 MPa UCS in andesite, the principal rock unit), create a very complex scenario for massive mining. The brittle nature of the andesite rock that hosts all the mineralisation, the several lithologies that occur in a ‘reduced’ space and the presence of faults defining shear zones makes this project a challenge in terms of mass mining production without mine-induced seismicity (as rockbursting) problems.
Estimated stress field for the New Mine Level Project undercut level (UCL)
To contain the rock ejected by a seismic event (rockburst), the use of yielding support has been implemented successfully in several mines around the world (Varden et al., 2008; Charette, 2012). The implementation of this support technology will be used to reduce the rockburst hazard that could exist in the new mine, but a methodology to define the correct support element must be defined. In this paper, the methodology defined by the Canadian Rockburst Support Handbook (Kaiser et al., 1996) is used to calculate the energy demand on the different mining levels of this new project.
Yielding support calculation methodology
The method used to calculate yielding support is based on the steps proposed in the Canadian Rockburst Research Project (Kaiser et al., 1996):
Estimate the most likely location and the maximum magnitude of future events.
Estimate ground motion decay from the source to each of the drifts.
Estimate the amplification factor in the degraded rock mass surrounding the drifts.
Estimate the yielded rock mass around the drifts, which could be affected by the ground motion.
Considering the peak particle velocity (PPVs) and the yielded rock mass (loose zone), calculate the energy demand for each level.
Even though there is no definitive way to quantify all the aforementioned steps and although much uncertainty exists in the measurements and forecasts, an attempt has been made to, using the best tools available, to predict an input value for the design of the support system.
Location and magnitude of future large events
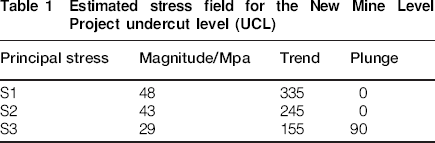
The energy that the support system will need to absorb depends on the magnitude of the expected events and the distance between the drift and the seismic event. This means that a reasonable estimation of the location and magnitude of the event is needed for the analysis. Given that past seismicity and large events have been related to a shear mechanism on faults and contact zones (Potvin et al., 2010, Ground Control internal reports), a Map3D fault slip model (Wiles, 2006) was used to calculate the zones of high non-linear displacement that can be related to large fault slip seismic events (Jarufe, 2008; Potvin et al., 2010) (Fig. 1). Experience from Map3D modelling has shown that the periods with higher seismicity and the location of the zones where the largest events occur can be correlated with non-linear displacement in Map3D simulated fault planes. The non-linear displacement calculation of the fault planes is based on the ESS criterion and assuming that the fault planes where seismicity occurs are in a limit equilibrium state in terms of strength and that any increase in shear stresses will generate non-linear displacements (Jarufe and Vasquez, 2008; Potvin et al., 2010; Jarufe, 2010; Jarufe et al., 2012).
a Interpretation of observed seismic data (Potvin and Wesseloo, 2008) defining a three source mechanism for El Teniente seismic data: caving events (Zone B), high stress (Zone A) and abutment stress below production levels (Zone C); b results from numerical modelling for the same time period showing high displacements in the abutment zone, below the production levels
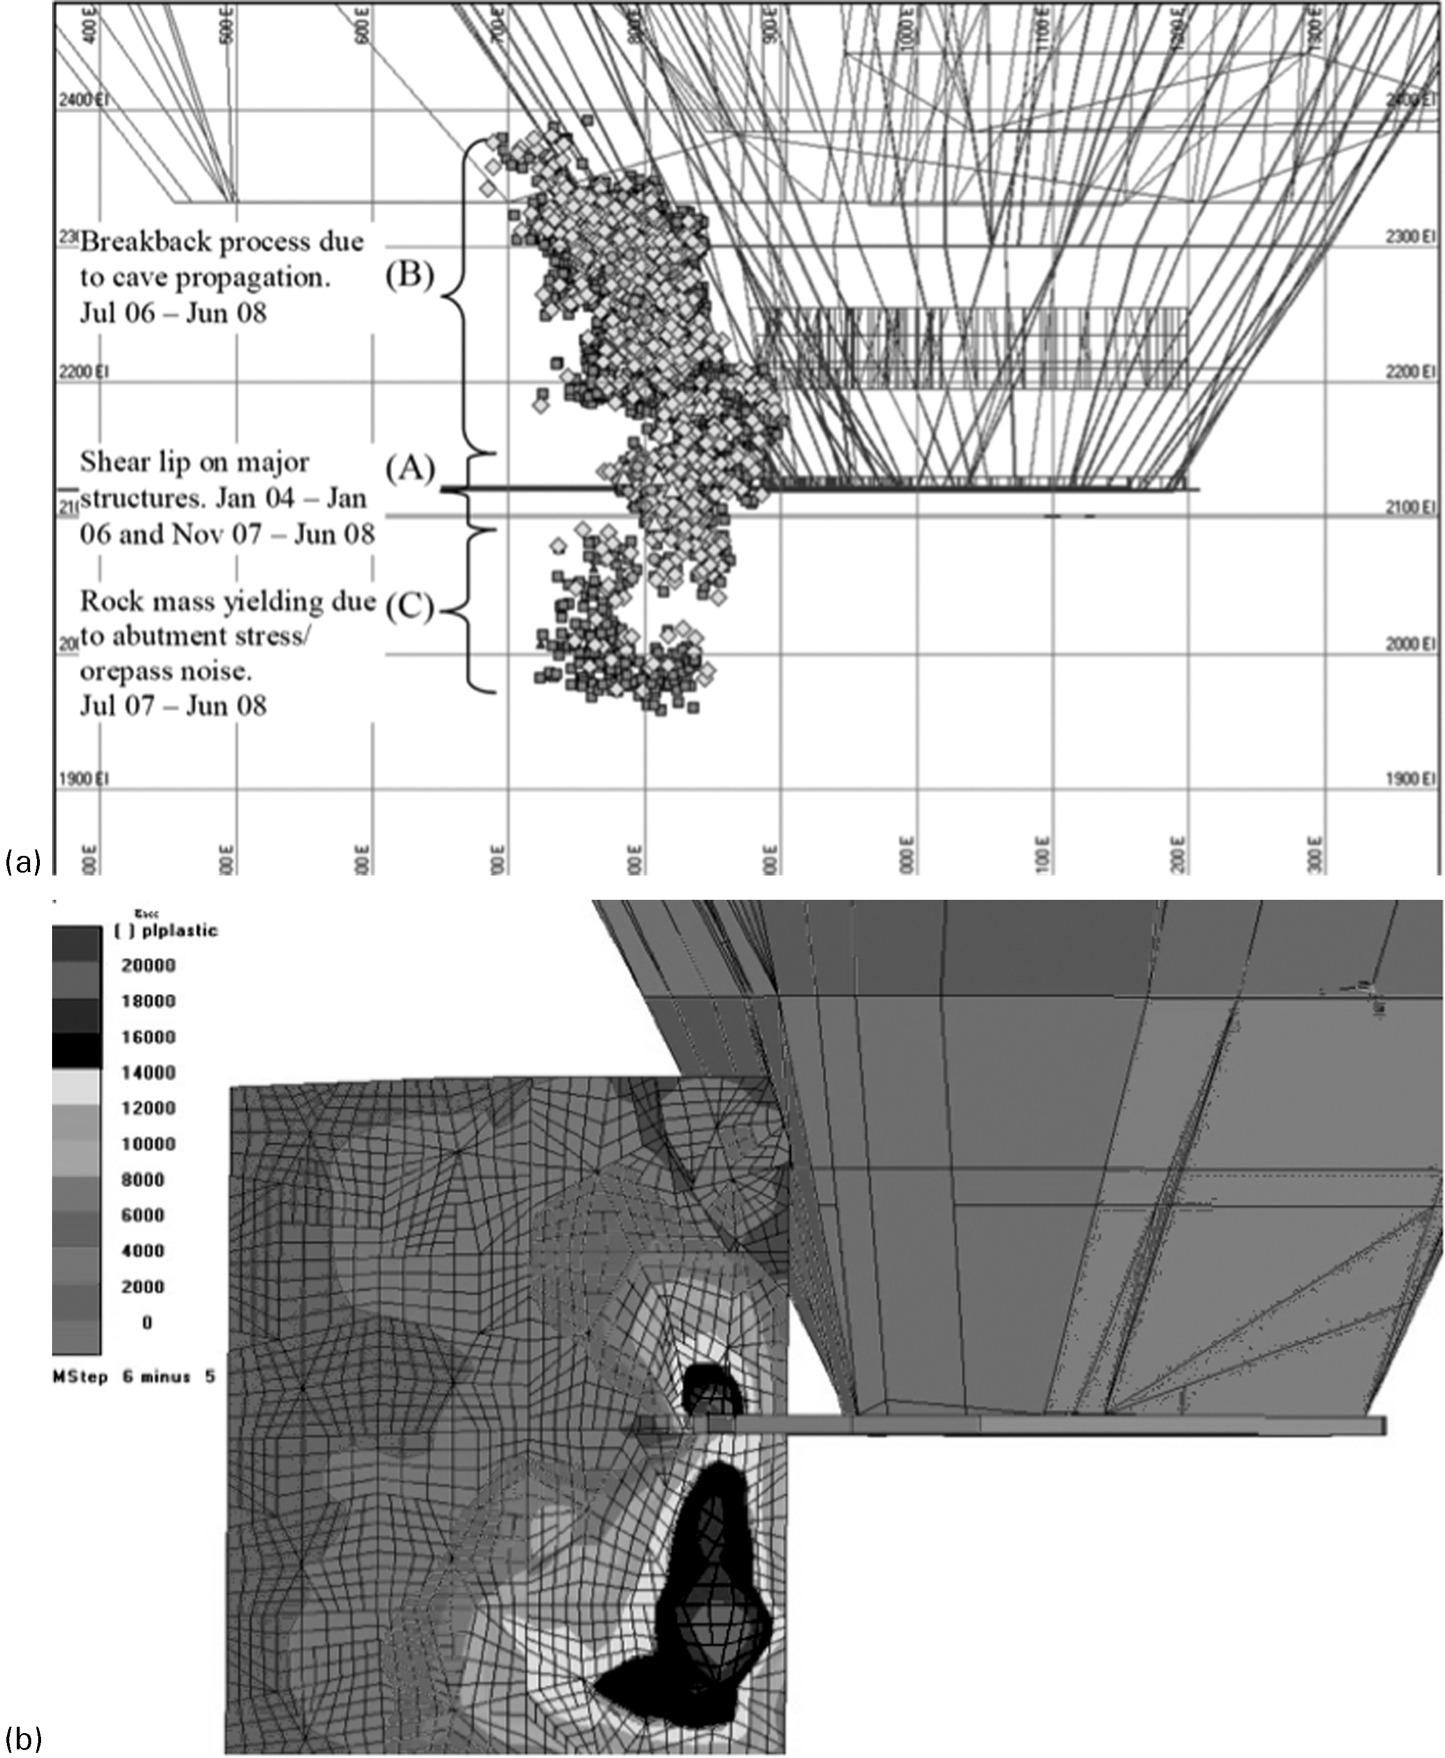
Using this method, it has been possible to predict that the largest events would likely occur 80 m below the undercut level (UCL) and that the expected maximum magnitude will be close to moment magnitude Mw = 3 (Fig. 2). Given that there are several fault planes and contact zones (which have been seismically active due to past mining) and that modelling results are similar in the location of maximum non-linear displacement for all fault planes (approximately 80 m below UCL), the full horizontal plane 80 m below the UCL is treated as a seismic source. These results have been confirmed by additional analysis.
New Mine Level modelling results for a specific fault zone, showing higher displacement values (total plastic ride) below and above the undercut level (UCL). Since the events above the undercut are related to caving propagation, the focus of this analysis is on the events below the undercut (grid size is 100 m)
Peak particle velocity decay through the rock mass
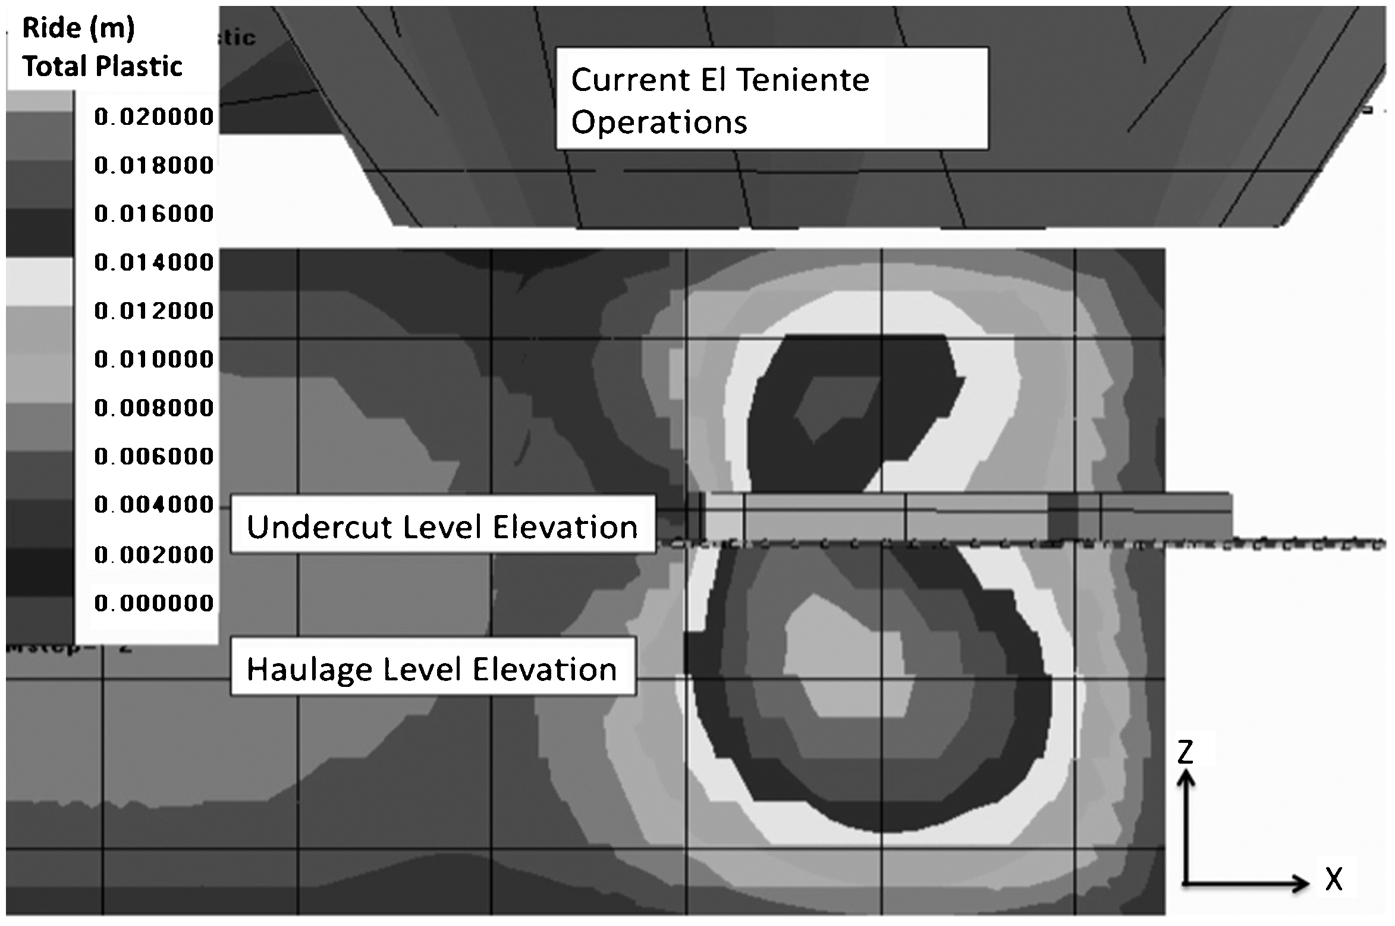
Once the locations and magnitudes of events are defined, the energy from the hypothetical event must travel through the rock mass to the different mine sublevels. To simulate this process, the PPV was calculated at the different drift locations through an attenuation function. To calculate this attenuation of PPVs, measured PPV values, at different locations in the mine (and at different distances from the source) and for different magnitude events, were used to create a chart (Fig. 3) that relates the magnitude of the event, the distance and the PPV to create a PPV decay model.
Scale represents the magnitude of the events, the horizontal axis the distance to the source and the vertical axis the peak particle velocity (PPV). The measured PPV for different distances at El Teniente are shown in a; the proposed PPV model for this analysis is shown in b. It can be seen that there are few values recorded for distances less than 100 m
Similar attenuation models can be found in the literature (Kaiser et al., 1996) but in this analysis a model based on the local database was used. Comparisons of the local model with models proposed in the literature (Kaiser et al., 1996) show good correlation at distances greater than 100 m. However, for distances less than 100 m, there are few observations and the measured data seem to be not as high as those estimated in the Canadian Rockburst Research Project (Fig. 4). In the rest of the analysis, a model based on the local data will be used. Using the proposed attenuation model, different velocities are obtained for the various sublevels of the New Mine Level Project (Table 2).
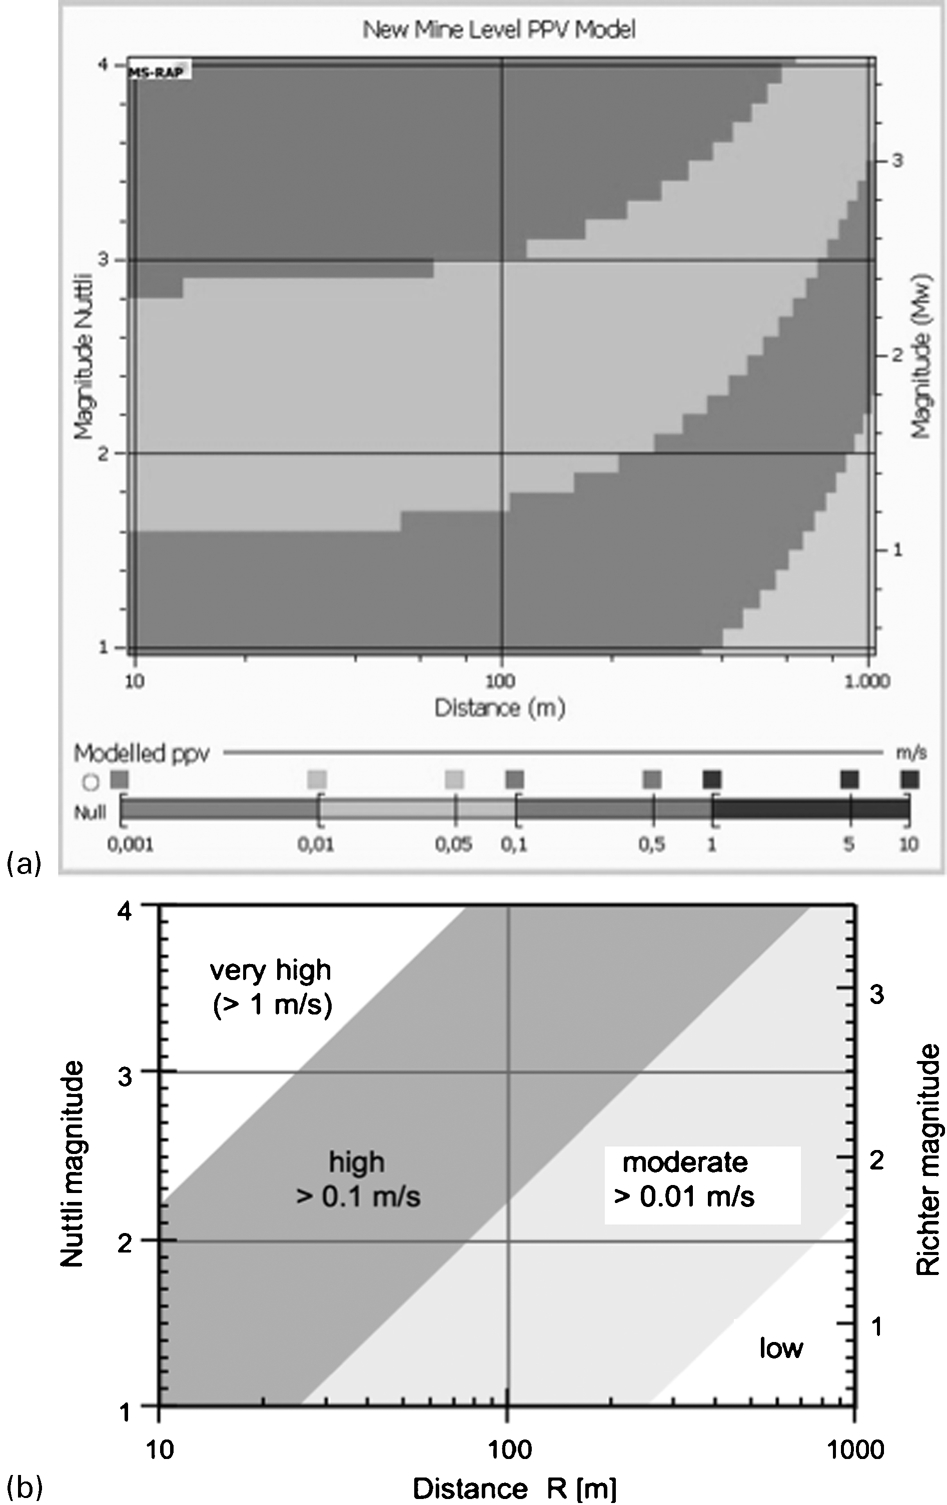
Peak particle velocity (PPV) values from the attenuation model for elastic medium of the New Mine Level a compared to Canadian Rockburst Research Project b Kaiser et al. (1996). For distances less than 100 m the difference between the New Mine Level Project model and the model proposed by Kaiser et al. (1996) is due to the lack of data in this range
Expected peak particle velocities (PPVs) at different New Mine Level sublevels due to the largest expected event (Mw = 3)
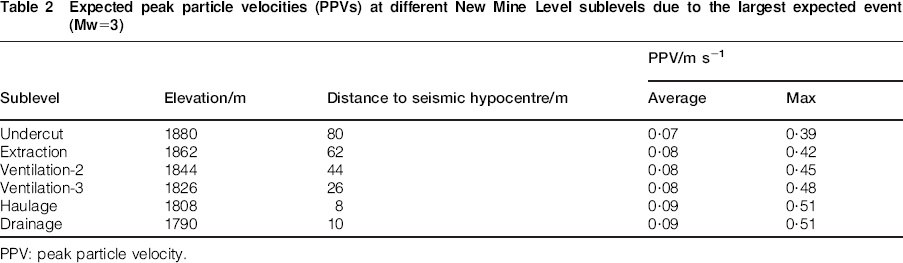
PPV: peak particle velocity.
Peak particle velocity amplification at contours of drifts
Several authors have stated that the PPV is amplified close to the boundaries of underground excavations. This amplification has been shown to depend on the magnitude of the events and, more specifically, on the corner frequency of the event, which is a seismic parameter taken from the seismic waveform that is part of the moment magnitude calculation. An example of the results obtained by Alviña, 2008 and Van Sint Jan and Alviña, 2008 is shown in Fig. 5, where numerical modelling results of PPV amplification at the edge of excavation are given. Note that the amplification factor changes for various circular excavations, of different circular radii (2, 3 and 4 m), corner frequencies (horizontal axis, in Hz), and stiffness E of the host rock mass, where the corner frequency is an indicator of the rupture length (Lee et al., 2007) and lower corner frequencies are related to larger seismic events.
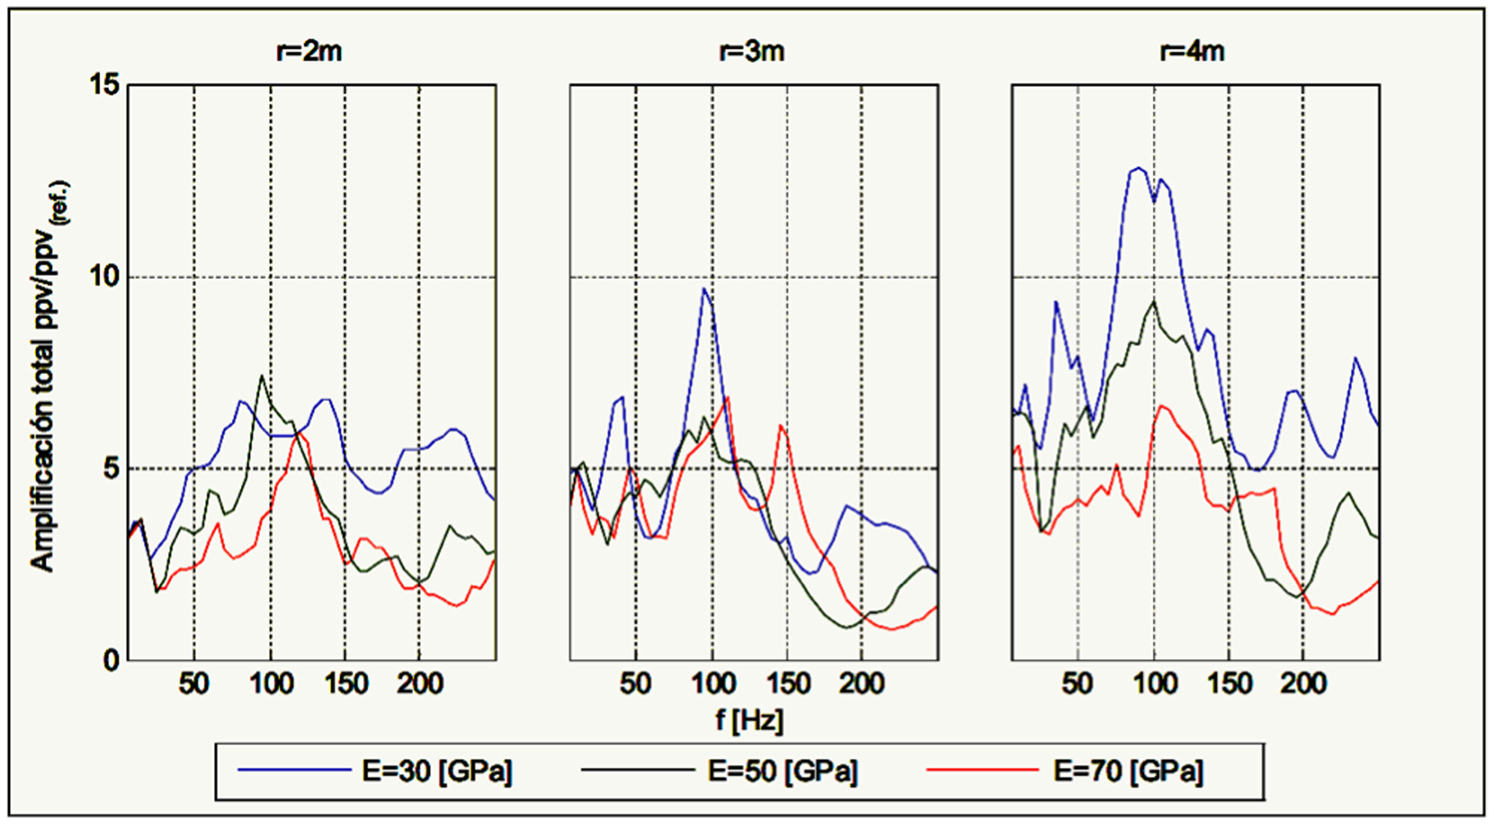
Maximum peak particle velocity (PPV) amplification for a circular drift as a function of the drift radius, the corner frequency of the event and the rock stiffness E (Van Sint Jan and Alviña, 2008)
In the current analysis, a two-dimensional analysis of wave propagation was used (Alviña, 2008). This 2D finite element analysis considers a wave propagating through elastic material where different several drift shapes, seismic event frequencies and degraded zone around several drifts were evaluated.
The previous analysis was applied to the New Mine Level Project conditions, using an amplification factor of 12. This amplification was imposed at the PPV values calculated previously with the decay function, see Table 3 for the results.
Expected peak particle velocities at different New Mine Level sublevel drift walls as a result of the largest expected event (Mw = 3)
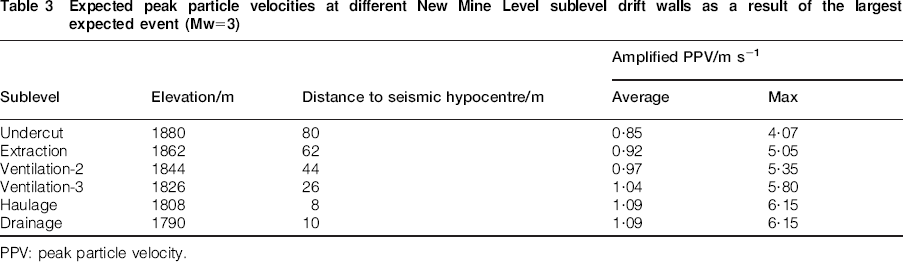
PPV: peak particle velocity.
The amplification value of 12 is close to the median of the values reported by Milev et al., 2002 (Fig. 6) for previous research in this field.
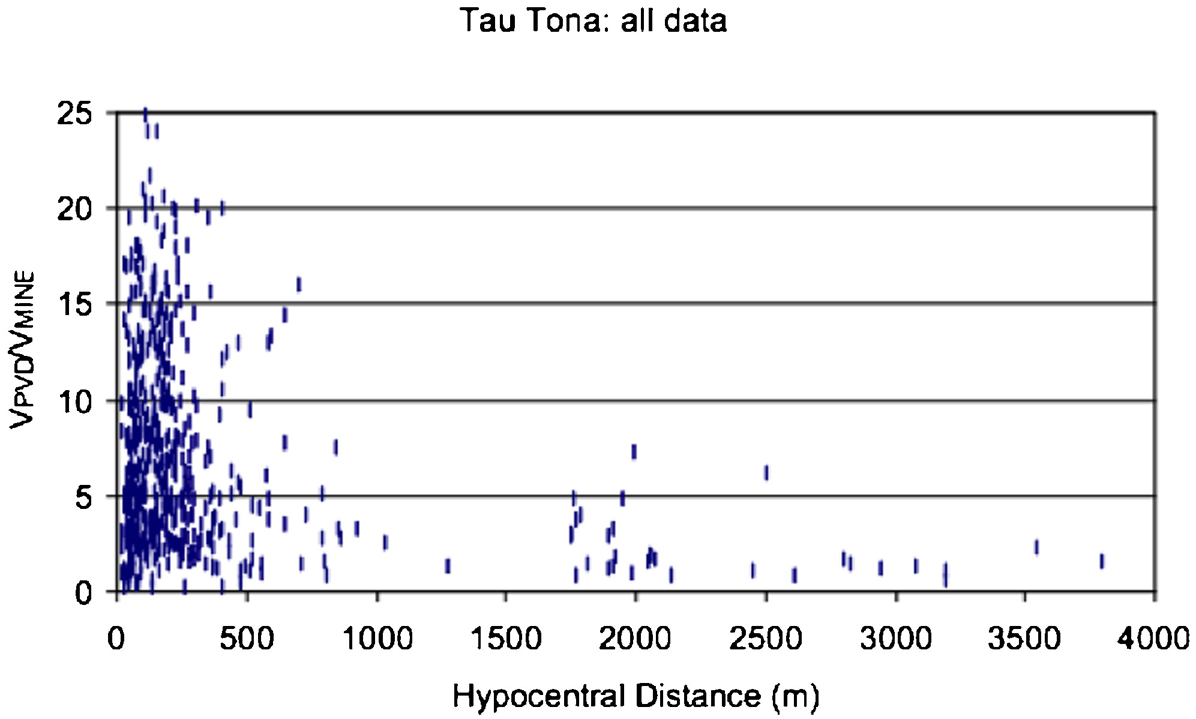
Ratio between peak particle velocities (PPV) measured at the surface of the drifts (Vpvd), and the PPV measured by the mine seismic system (Vmine) at Tau Tona Mine (Milev et al., 2002)
Loose rock around drifts that could be ejected
Once the particle velocity is estimated, the calculation of the rock mass that could be ejected is needed to estimate the total amount of energy required to be contained. The calculation of the amount of yielded or loose rock around the drifts can be done through the use of numerical modelling calibrated with ground observations. The most common mechanisms that cause rock instabilities around drifts are high stress yielding and structurally controlled failures. Numerical modelling packages such as Map3D and Unwedge (Rocscience, 2013), were used in this analysis to estimate stress-induced and structurally controlled failures, respectively.
Map3D has been widely used in El Teniente and several other mines to estimate the amount of stress damage around drifts (Jarufe and Vasquez, 2008). Also, Unwedge (Rocscience) has been extensively used to define large blocks that could jeopardise operations on the different levels where structural wedges could form. The simulation of existing drifts and the comparison of the modelled results and the real observed data has shown good results in the past, with a difference between measured and modelled over-break of 10% in terms of the extent of loose rock.
With the calibrated models, it has been possible to estimate the amount of over-break of the different sublevels (Jarufe and Bacco, 2011). Figure 7 shows tonnes of loose rock around the drifts at each sublevel, plotted along the left vertical axis as metres below the UCL where the sublevel is located. The undercut and production levels suffer the highest levels of stress-induced damage, with observed loose zone thickness up to 2·5 m. This is due to the two levels being strongly affected by mine-induced stresses. As we move away from the UCLs (more than 50 m below UCL in Fig. 7), the level of damage starts to decrease as a result of the increasing distance to the production area (undercut-extraction levels).
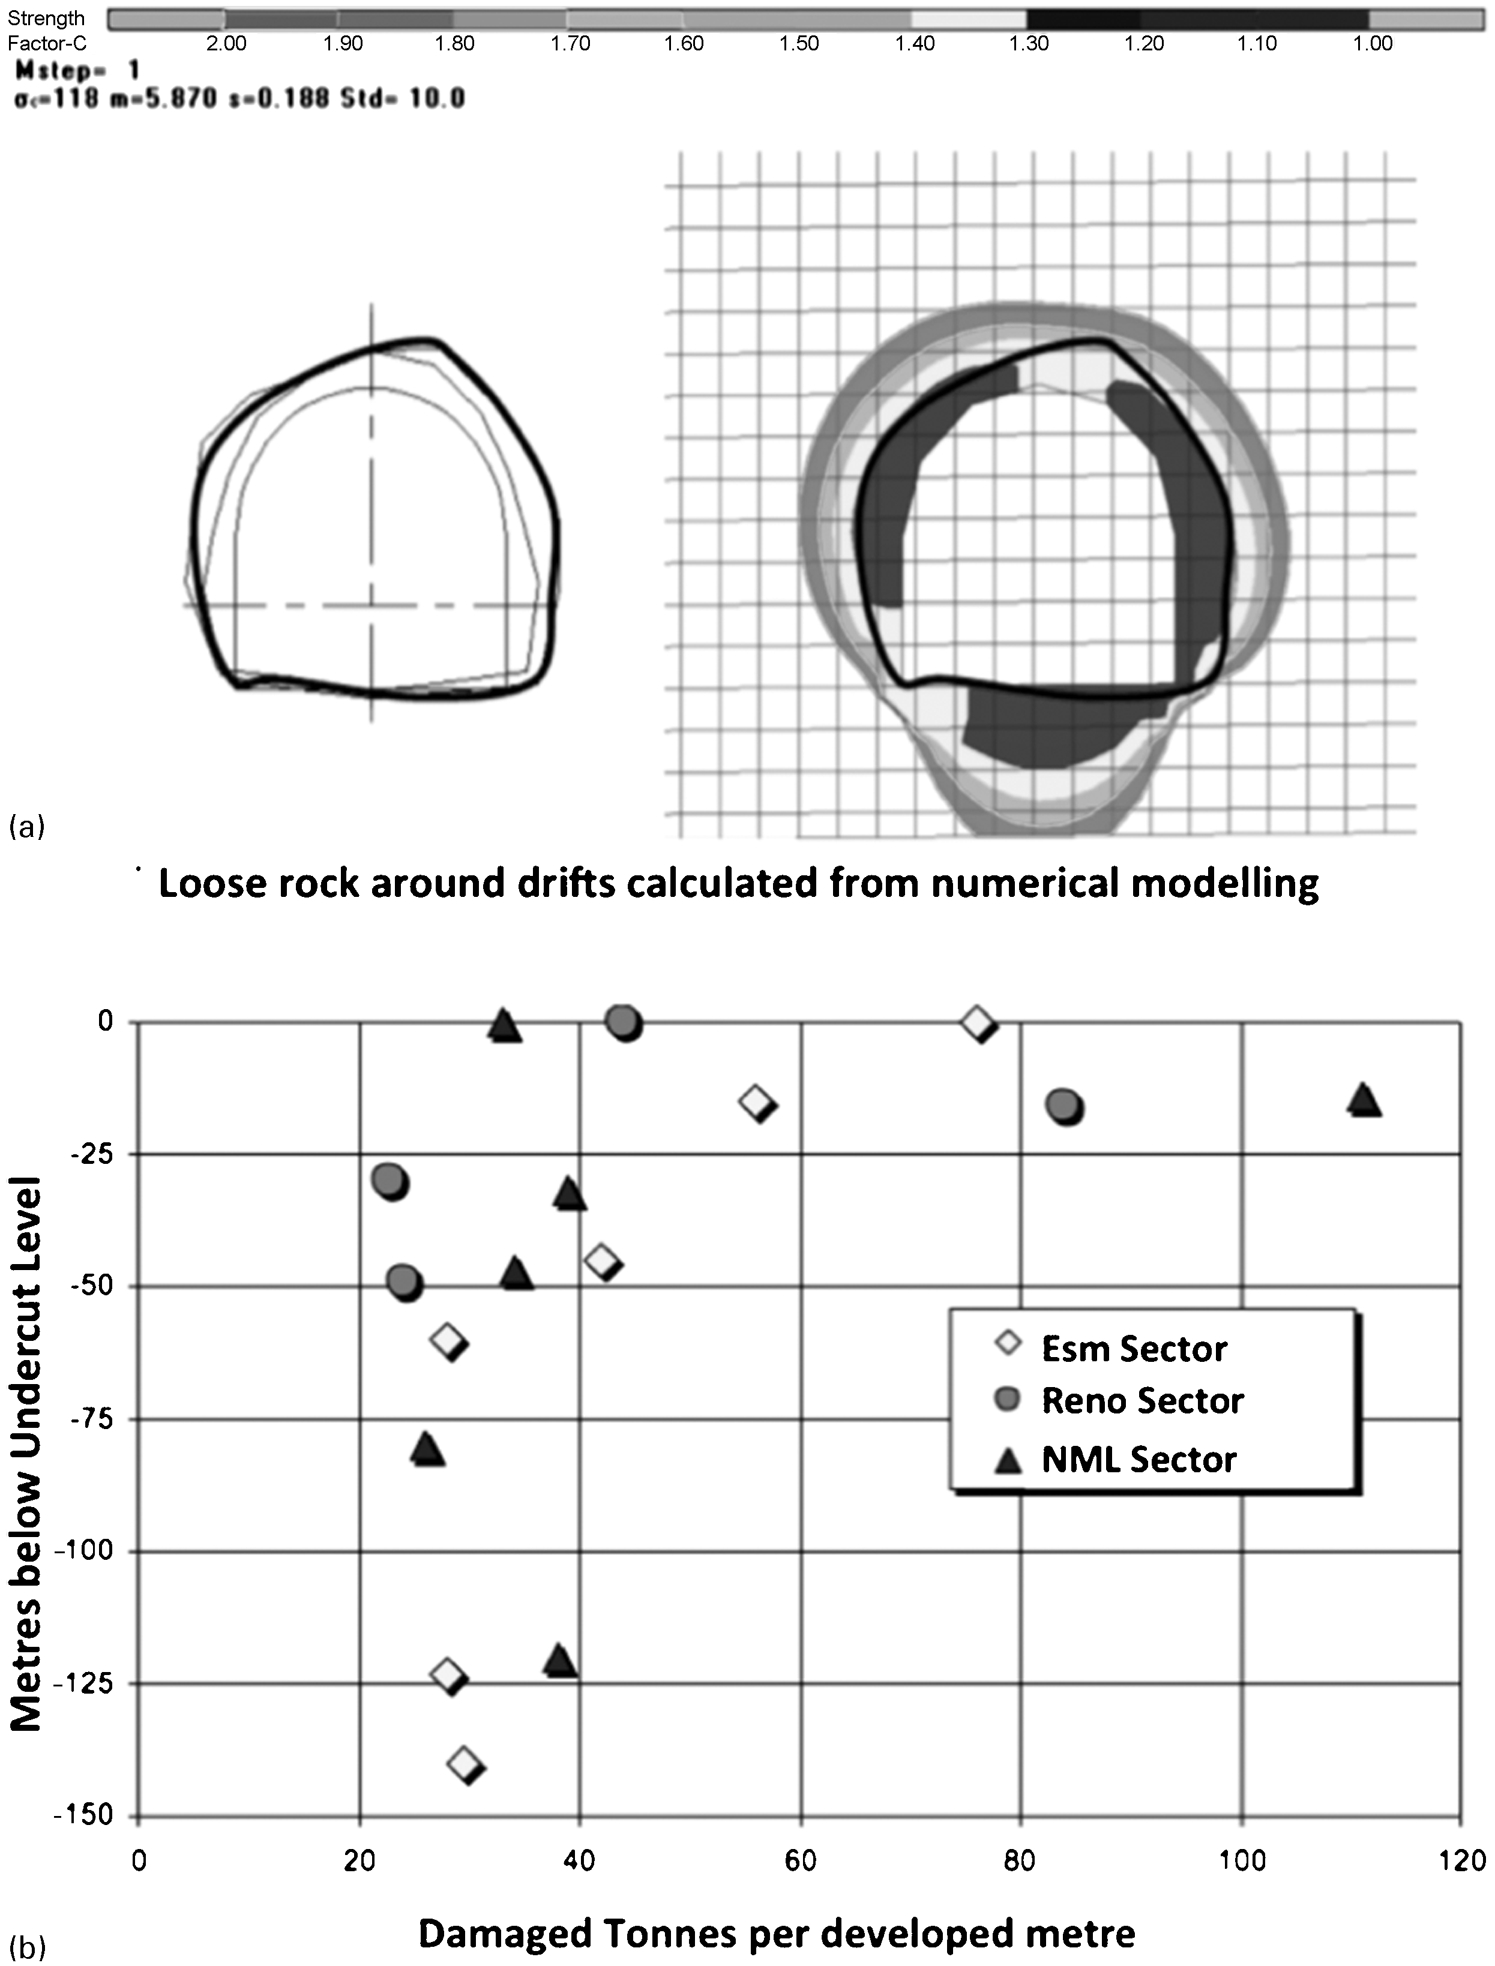
a Solid lines correspond to measured surveys of the mine excavations. These are compared with modelled Map3D strength factor estimation, showed as grey scale contours; b over-break values estimated for different sublevels (Jarufe and Bacco, 2011)
When the mining face is closest to the drifts, the highest stress damaged levels are those that are closest to the UCL, with an estimated thickness of loose zone up to 2⋅5 m. As the drift moves away from the mass mining sectors (UCL), the amount of damage around the drifts starts to decrease.
It is important to note that at this stage of the project only access drifts are under development. Intersections have not been evaluated yet. In these points, higher loose rock values are to be expected and they will need special support considerations.
Calculation of energy demand
Once the PPV, the ejection velocity and the mass of the loose rock zone have been calculated, the energy demand at each drift can be calculated. This is done using the equation
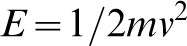
E = energy (kJ)
m = loose zone mass (t)
v = ejection velocity calculated from the amplified PPV (m s−1)
From this equation, the energy demand can be calculated for the different levels. Where the mass is calculated as the loose zone per metre of drift advance and divided by perimeter (thus the energy is expressed per square metre). The results from this calculation are shown in Table 4.
Expected energy demand for the different levels at the New Mine Level Project
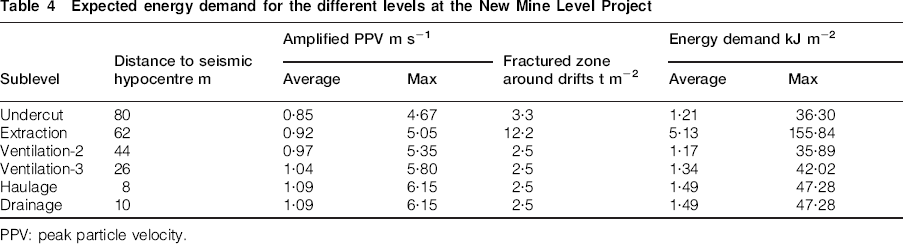
PPV: peak particle velocity.
Comparison with past rockburst events
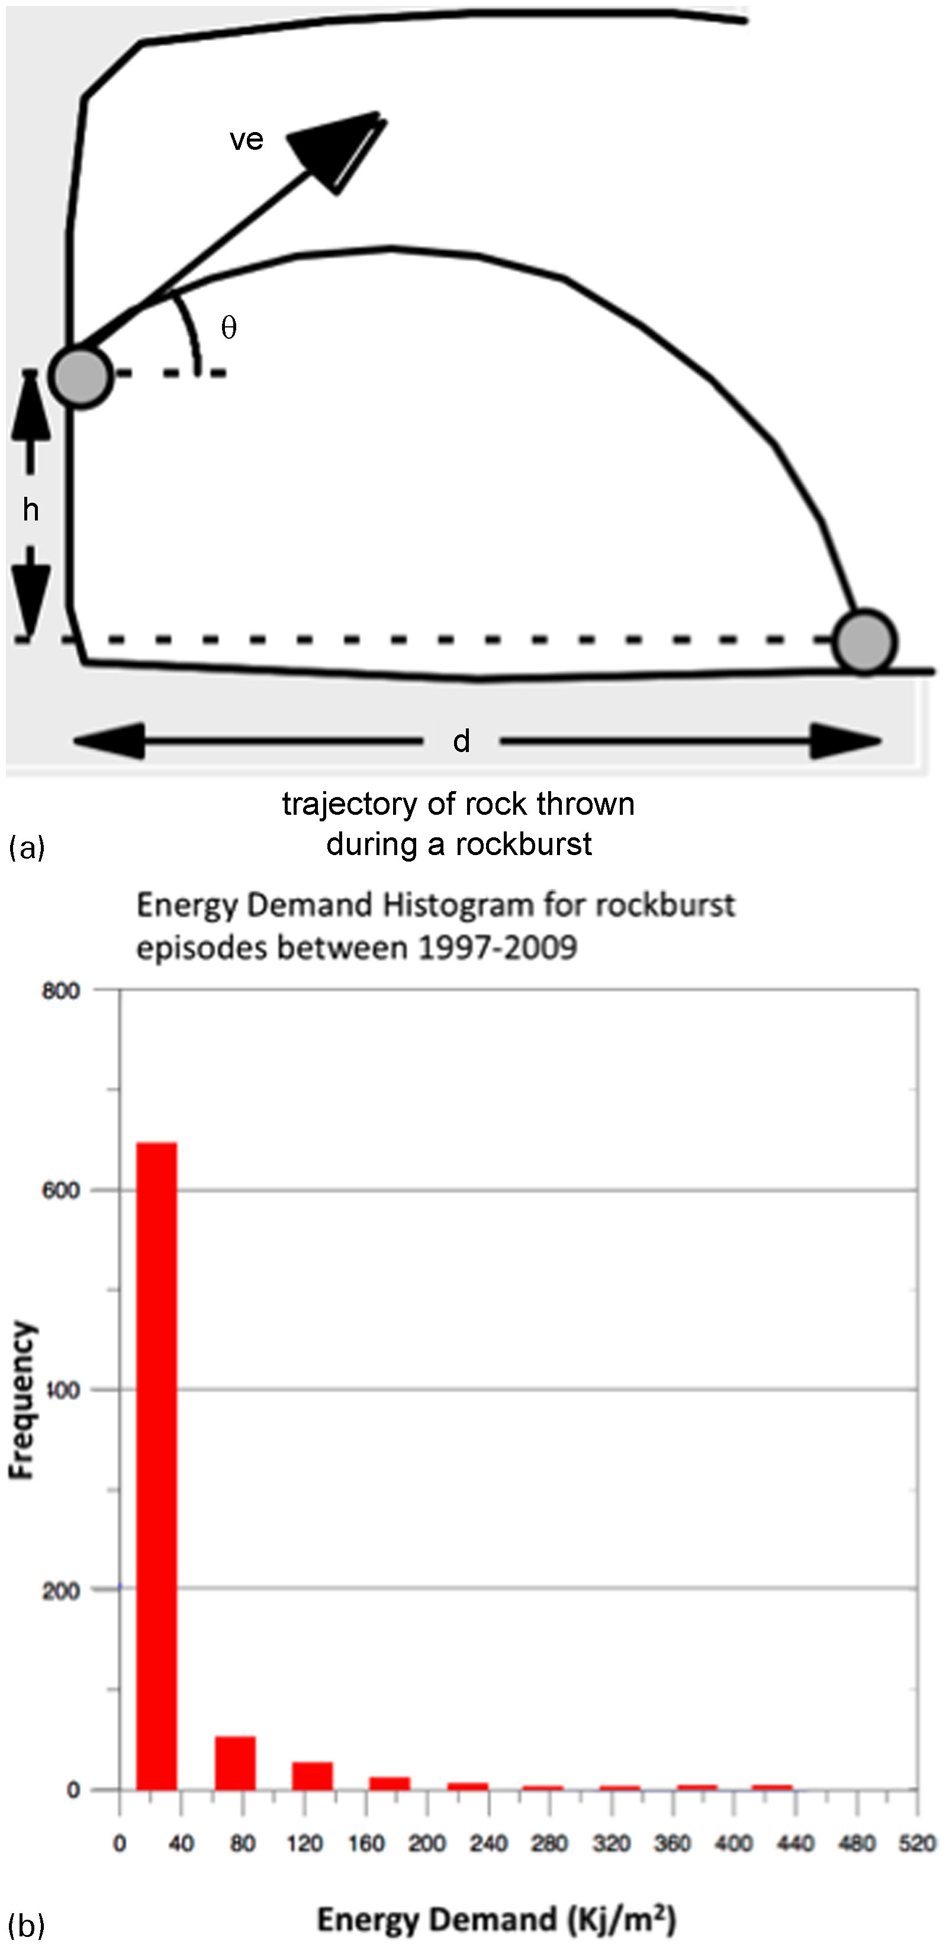
For past rockburst events, Kaiser et al. (1996) found that it is possible to estimate the ejection velocity (ve in Fig. 8) based on the observed movement of the ejected rock from the walls as a product of a rockburst. The movement of blocks can be estimated with the ejected horizontal distance (d), the ejection angle (θ) and the height from where the rock was ejected (h). This methodology was applied to the history of rockbursts over a period of 10 years in El Teniente, assuming the ejected height as half of the excavation height, the ejected distance as the excavation width in the worst case scenario (the block is ejected until it reaches the opposite wall on the drift) and the ejection angle as 30°. The results of applying this methodology to the El Teniente rockburst database has shown that most of the energy demand is less than 50 kJ m−2 (Fig. 8). Higher energy values obtained from the back-analysis usually correspond to geometric singularities on the mine (e.g. small pillars and acute excavation intersections). When the results from the numerical modelling are compared to the back-analysis results (Fig. 8), it can be seen that the results obtained are in agreement with more than 90% of the rockburst that could have caused damage in the past. This comparison with past data has been considered to validate the results obtained in this numerical modelling-based work.
Conclusions
The calculation of the energy transmitted from a seismic event to the drifts in a mine layout has been a difficult task. A lot of work has been undertaken but much remains to be done; and we are still far from a definitive answer. This presents a major problem for the engineers wanting to design a support system as the energy to be contained needs to be identified in order to select the appropriate support elements. In this work, it has been shown that by using the currently accepted concepts, it is possible to obtain quantitative values for the calculation of the support elements. The comparison of the results of this work with previous data gives the results a measure of reliability. In the analysed example, the results are considered reliable enough to design and implement a yielding support system for the new mine.
Footnotes
Acknowledgement
The authors thank the New Mine Level Project management for the support of this work.
This paper has been reproduced with the kind permission of the Australian Centre for Geomechanics, The University of Western Australia. The 7th International Symposium on Ground Support in Mining and Underground Construction proceedings volume, 13–15 May 2013, Perth, Australia. ISBN 978-0-9806154-7-0, ![]()