
Abstract
Several operations are considering the transition from surface mining to underground block caving to access deeper resources. Depending on the geometry of the orebody, the undercut may be positioned beneath the foot of a large open pit slope, or behind its crest. The latter scenario also arises where a natural rock slope is present. Results are reported here from a numerical modelling study investigating the mechanics of deep-seated slope displacements in response to caving. Different failure models are investigated as a function of the orientation of the jointing pattern relative to the location and progressive development of the block cave. A 2-D discontinuum modelling approach is utilised based on the distinct-element method. The results show that the cave location and the resultant strain field, plays a significant role in the rock mass interactions that develop and the subsequent kinematic response of the slope with respect to translational, rotational and toppling behaviour.
Keywords
Introduction
With the increasing global demand for mineral resources, underground mass mining methods like block caving are increasingly being promoted to mine lower grade porphyry copper deposits due to the low cost and high productivity that can be achieved. This includes open pit operations that are approaching the end of their mine life and are considering transitioning to block caving to mine deeper reserves. Well-known examples of caving operations below large open pits include Palabora, South Africa; Argyle, Australia and Grasberg, Indonesia. New block caves currently being planned/developed where rock slope–block cave interactions are of concern include Resolution, USA, and super pits like Chuquicamata, Chile and Bingham Canyon, USA, which are considering plans for transition to block caving in the future.
Block caving involves a range of engineering challenges and geotechnical risks, from ground control and proper fragmentation to major operational hazards, for example major collapses, rock bursts, mud rush and air blasts (Brown, 2012). The significant extraction ratios that accompany block caving can lead to significant ground deformations that may adversely affect sensitive structures on surface, including both natural and engineered rock slopes. Geotechnical and environmental problems have been known to arise due to the limited understanding of the complex interactions and response between the rock mass and upward advancing block cave (e.g. Bailey, 2003; Moss et al., 2006).
This paper investigates the surface and subsurface strain fields generated by an advancing cave back on the mechanics of different rock slope deformation modes (translational, toppling, etc.). The commercial 2-D distinct-element code UDEC (Itasca, 2004) is used to examine the interactions that arise in a jointed rock mass assuming several hypothetical conditions relating to the discontinuity pattern and location of the block cave undercut relative to the slope being analysed. Although the spatial relationships between open pits and block caves are three-dimensional, a 2-D analysis is employed here for computational efficiency and to allow for a clearer cause and effect interrogation of the model results with respect to the interactions that develop between the geological structures, evolving caving-disturbed stress field and resulting rock slope deformation kinematics. A 3-D analysis would require the additional consideration of the influence of the open pit dimensions, shape of the undercut and cave and 3-D spatial characteristics of the discrete fracture network.
Problem definition
Block caves below the foot of large rock slopes: Palabora, South Africa
Palabora copper mine, located in the Limpopo province, South Africa, provides an example of a large open pit operation that transitioned into an 80 000 tpd block caving operation after the pit reached its maximum pit design depth of 800 m. The move extended the life of the project, which otherwise would have been closed in 2002. The undercut level was developed at approximately 1200 m depth, with a lift height of 400–600 m below the final pit bottom. The porphyry deposit is an elliptically-shaped vertical volcanic pipe, measuring approximately 1400 and 800 m along its axes (Moss et al., 2006). The geology and economic deposit of Palabora is described in detail by the Palabora Mining Company Limited Mine Geological and Mineralogical Staff (1976).
Moss et al. (2006) discussed the rock mass characteristics at Palabora, which they describe as the strongest rock mass in which block cave mining has been attempted. This was reflected in the open pit design where the overall slope angle increased from 37° in the upper weathered lithologies to 58° in the more competent rock towards the pit bottom. Although some numerical analyses carried out for the pit design suggested the potential for instability (Du Plessis and Martin, 1991), the high, steep slopes remained stable through to decommissioning of the pit operations.
However, soon after the initiation of block caving, the cave began to impact the stability of the North wall of the pit. Moss et al. (2006) first described the interaction as impacting the primary fragmentation with high induced stress concentrations helping to reduce the need for secondary breakage that had been hampering the caving operations up to that point. After cave breakthrough into the bottom of the pit, significant movements were detected in the North Wall and large tension cracks were discovered some 250 m back from the pit rim. These movements continued to accelerate until the 800 m high pit slope failed (Fig. 1). Later studies by Brummer et al. (2006) used 3-D distinct-element (3DEC) modelling to show that the instability partly developed along the wedges that formed and moved towards the caving zone. Pretorius and Ngidi (2008) reported that after the cave daylighted into the bottom of the pit, the toe support of the pit walls disappeared leading to dilation, unravelling and eventually sliding of the North Wall into the pit bottom (Fig. 1).
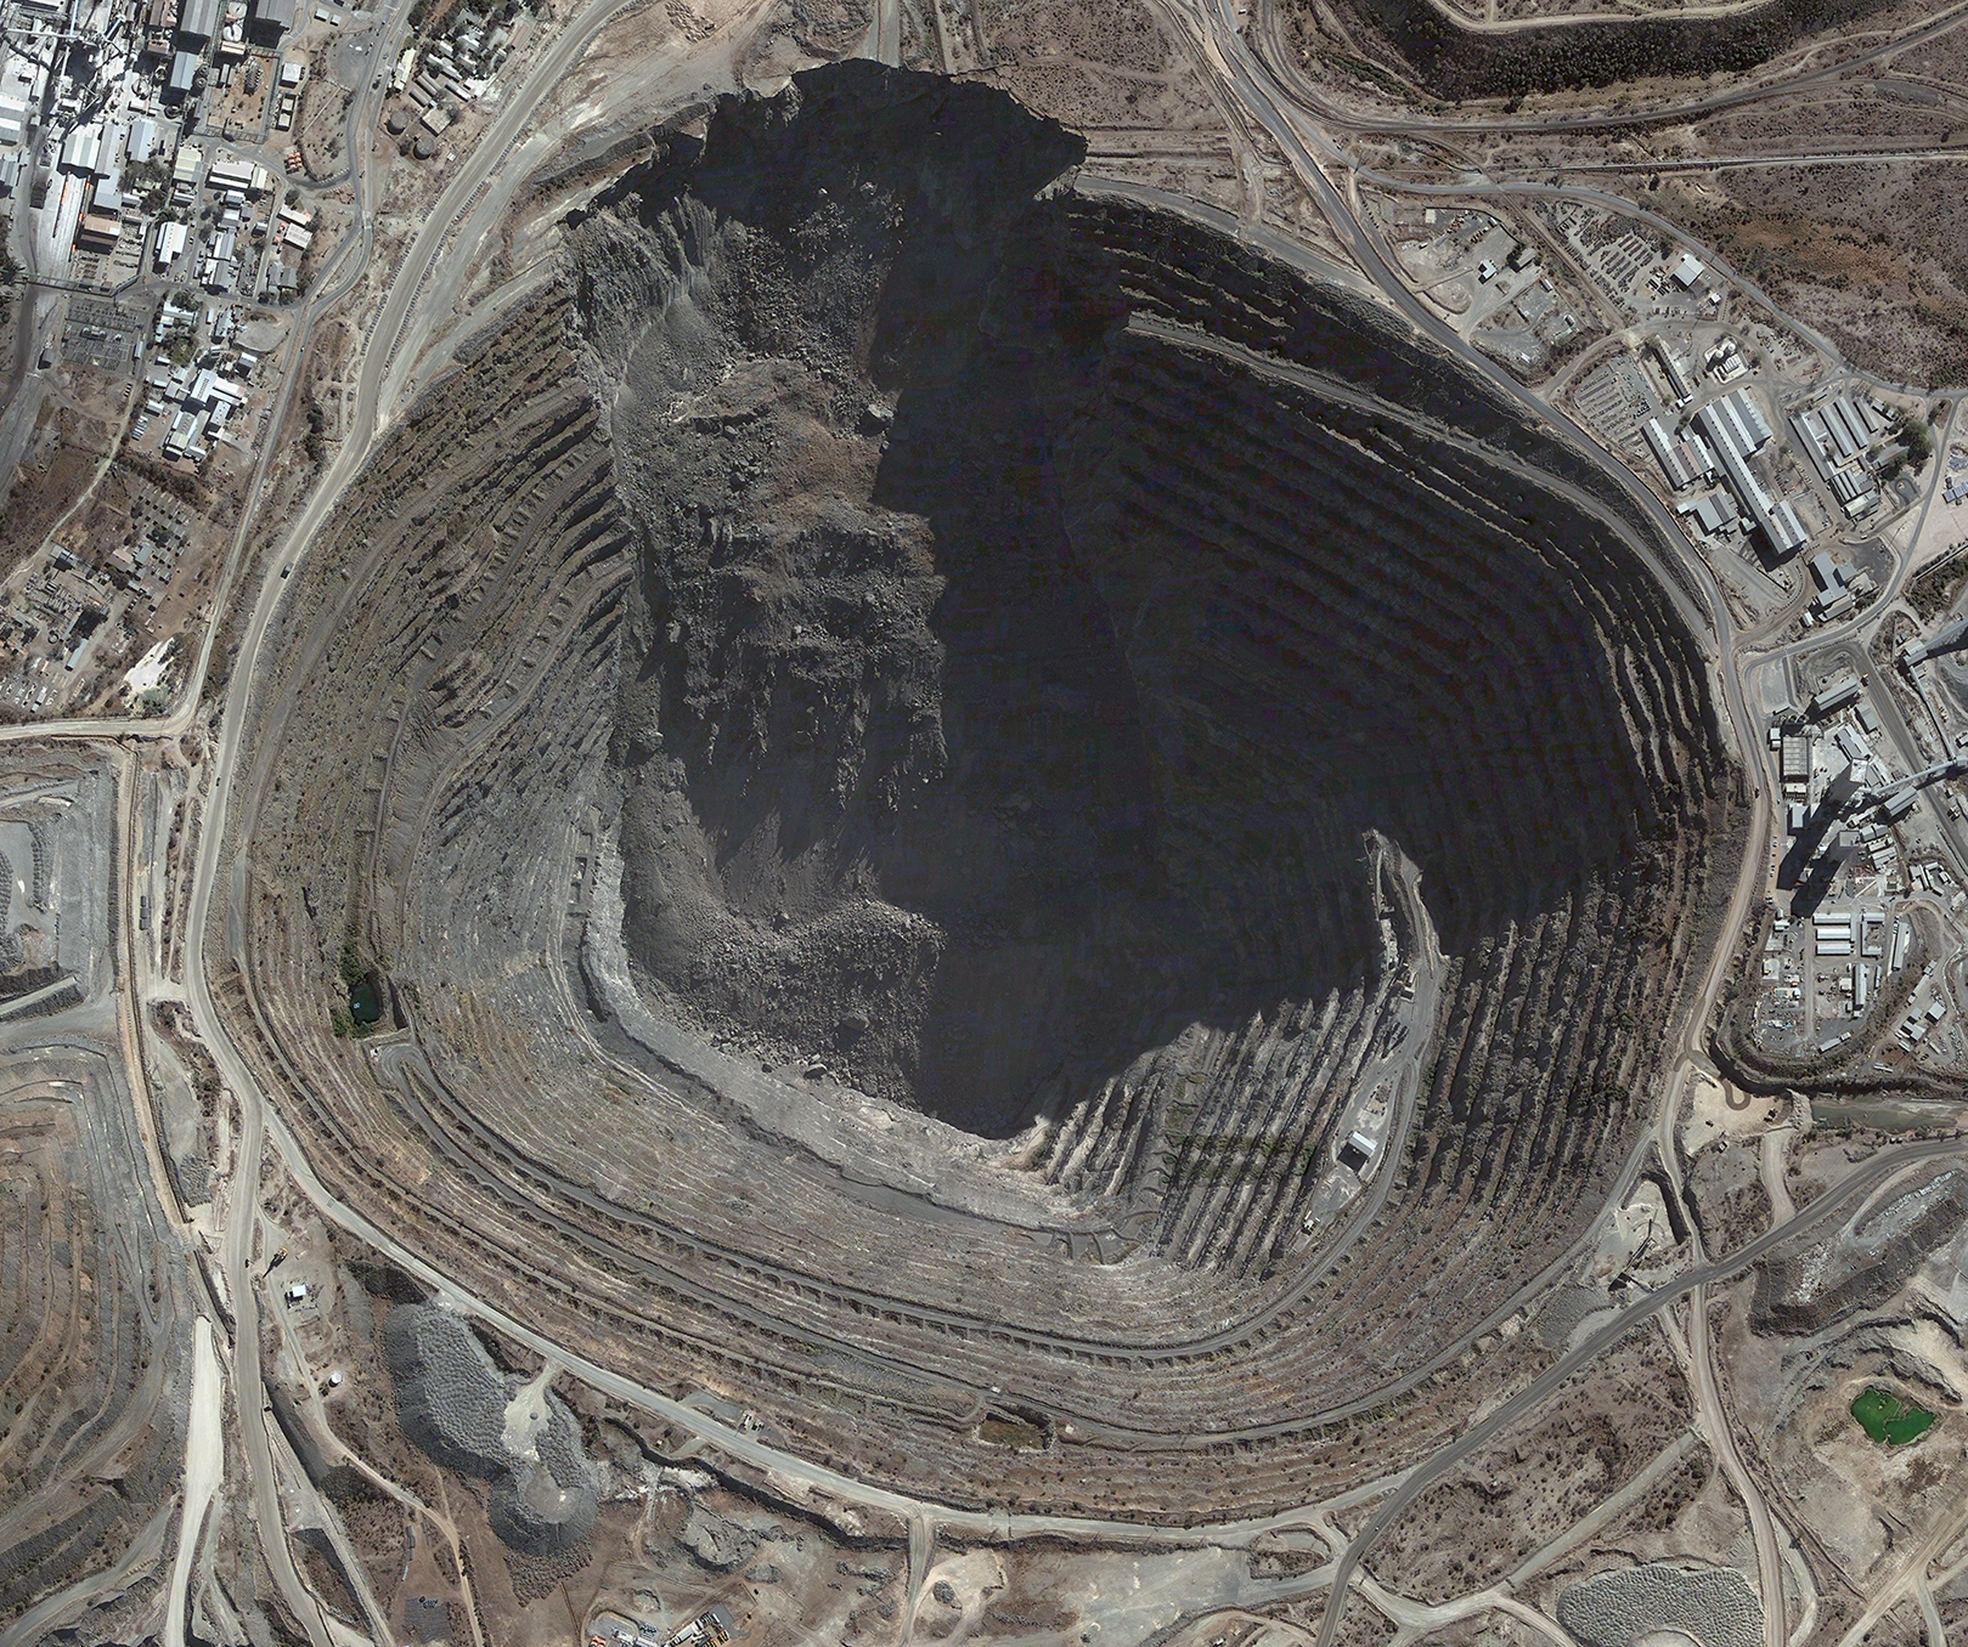
Quickbird image of the Palabora mine in South Africa showing an example of a cave-pit interaction that led to the failure of an 800 m high pit slope
The failure resulted in moderate damage requiring a road and other mine infrastructures to be relocated; dilution now adversely impacts the long-term economics of the project as waste rock from the failure mixes with the ore in the cave. Also at issue would have been if the failure had developed along the east pit wall slope resulting in the loss of the ventilation and production shafts. Moss et al. (2006) and Brummer et al. (2006) emphasised the need to establish comprehensive methods for evaluating the deformation and risk for such high rock slopes when located above a planned block cave operation.
Block caves behind the crest of large rock slopes: Resolution, USA
Resolution Copper Mining project, located in Arizona, USA, provides an example where caving-induced ground deformations and their interaction with a large natural rock slope, Apache Leap (Fig. 2), represents a key design consideration with respect to potential environmental impacts. Manske and Paul (2002) described the geology, host rocks, structural setting and alteration system of the porphyry deposit in detail. The orebody is deep with a planned undercut depth of approximately 2100 m.
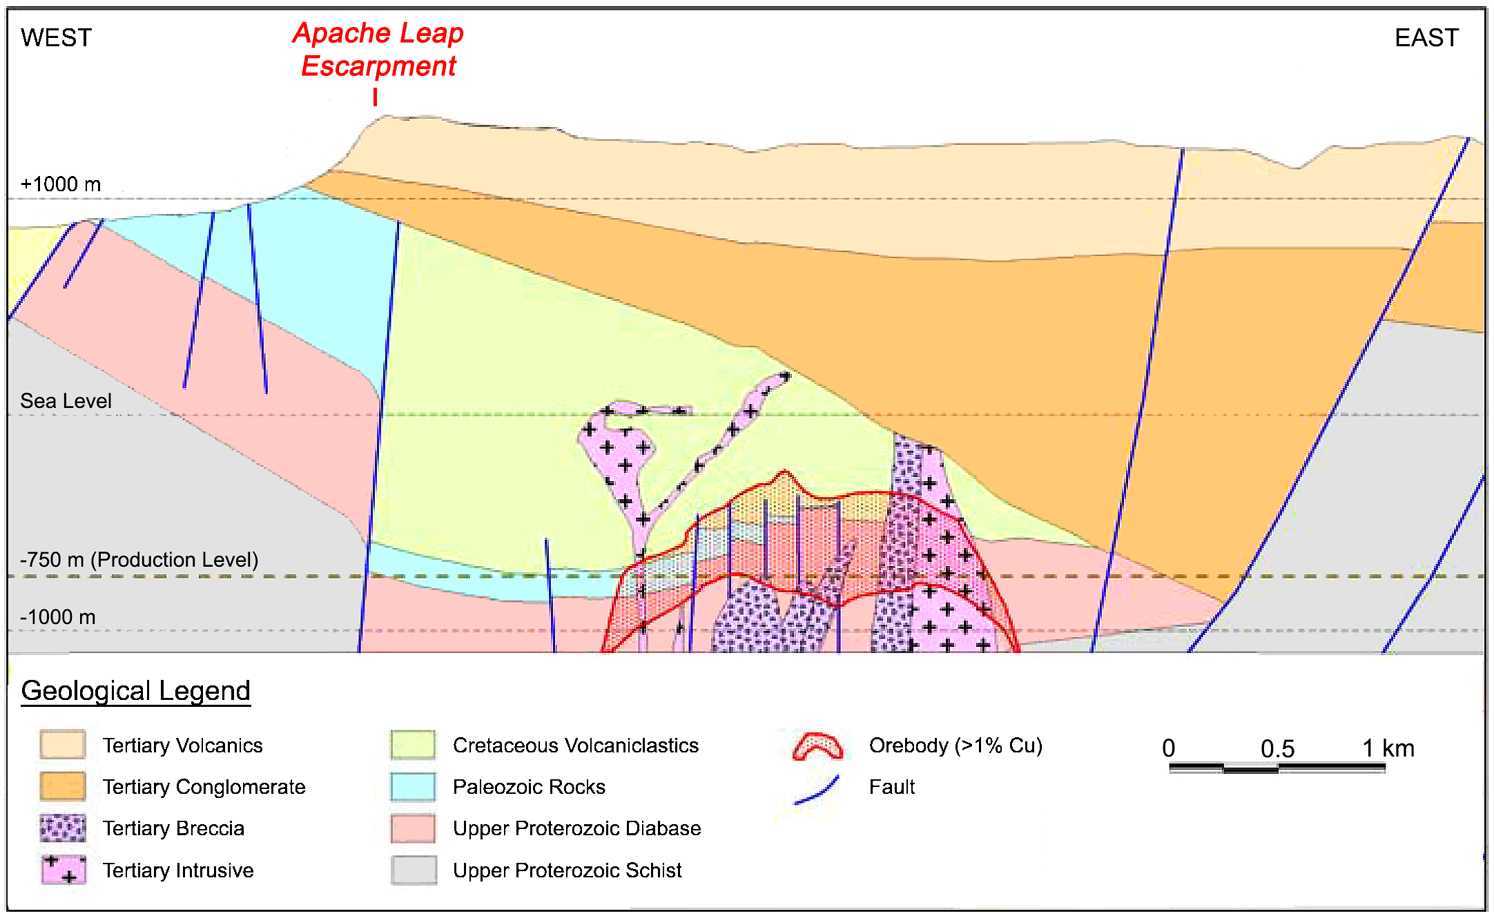
Cross-section through the Resolution Copper Mine showing relative positions of the orebody and the Apache Leap Escarpment. Modified after Rio Tinto (2008)
Although this depth may help to mitigate the zone of influence on surface with respect to ground collapse, it potentially increases the zone of small-strain subsidence (Woo et al., 2013). In consideration of the historical and cultural significance of Apache Leap, Resolution Copper transferred approximately 0·5 km2 of private land to the US Forest Service to protect the south end of Apache Leap. The Resolution Sustainable Development Report (Resolution Copper Mining, 2006) specifies that if a threat is identified, the mining practices will be modified to ensure Apache Leap is protected, for example the direction of cave development and draw sequencing.
Because the mine plans are still under development, advanced 3-D numerical modelling is being undertaken to model the reach and magnitude of caving-induced subsidence. In this case, unlike common experiences where a block cave is developed beneath an open pit and therefore influencing the rock slope from the toe towards the crest, the block cave at Resolution is behind Apache Leap influencing it from its crest towards its toe.
Methodology
Numerical modelling provides an important means to investigate and understand complex rock mass responses to block caving. However, challenges arise in determining input data that are highly variable, often requiring stochastic treatments or sensitivity studies (Brown, 2012). Modelling studies by Brummer et al. (2006), Beck et al. (2006), Elmo et al. (2007), Vyazmensky et al. (2010) and Woo et al. (2012) have demonstrated the use of continuum and discontinuum numerical techniques to model block cave/open pit interactions. In this study, a discontinuum approach is adopted using the commercial 2-D distinct-element code UDEC (Itasca, 2004). UDEC is well suited for rock slope stability problems as it is capable of modelling the rock mass as an assemblage of deformable blocks, accounting for complex non-linear interactions between the blocks (i.e. slip and/or opening/closing along discontinuities).
Model setup and assumptions
Although, modelling for the purpose of slope design and stability analysis would require site specific details of the topography, geology and mine layout, a series of conceptual models is used to compare the specific influences of the undercut and block cave positions, relative to the crest and toe of the slope and the orientation of the structural discontinuities in the slope (Fig. 3). Aspects of the geometries modelled were roughly based on those encountered in the examples previously described (e.g. Palabora, South Africa and Resolution, USA). Four different generic models were assumed for an 800-m high rock slope, with a block height of 250 m and undercut depth of 1000 m below the crest of the slope. The model boundaries were extended and tested to minimise boundary effects.
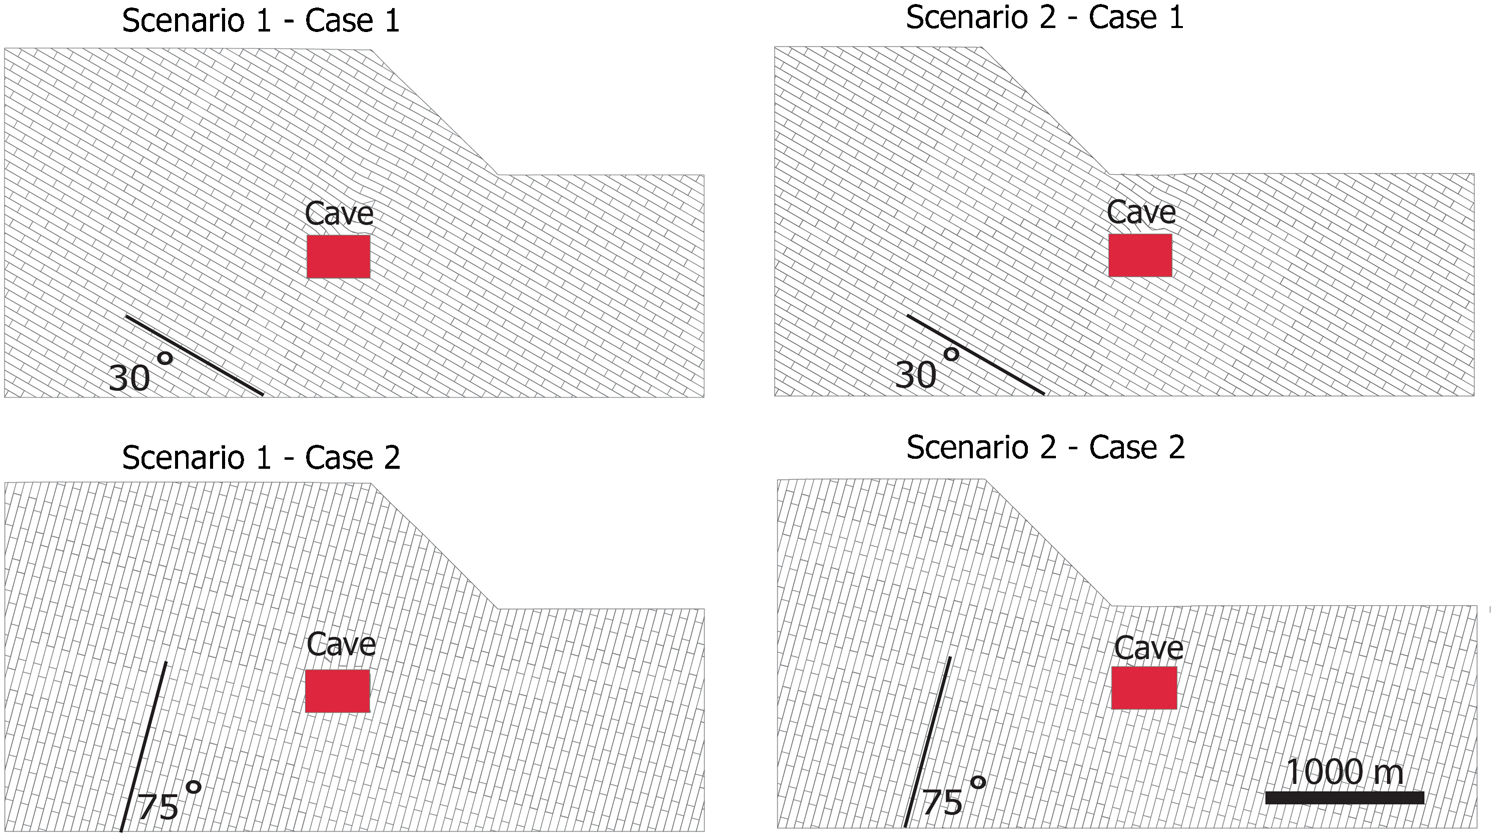
Modelled and compared caving positions and relative orientations of the structural discontinuities
Each model was populated with persistent joints and non-persistent orthogonal cross-joints, selected to emphasise two different kinematic deformation modes: sliding and toppling. Although UDEC allows for the explicit inclusion of mapped discontinuities, a 1: 1 representation is usually not practical due to the excessive computing run times that would result. Instead, a balance was struck between a larger joint spacing that still permits the key kinematic influence of the joint network to be captured and the use of equivalent continuum rock mass properties for the intact blocks that account for the strength weakening effect of the full fracture network. The joint set spacing was set at 50 m for the continuous joints in all models; cross-joints were 200 m apart.
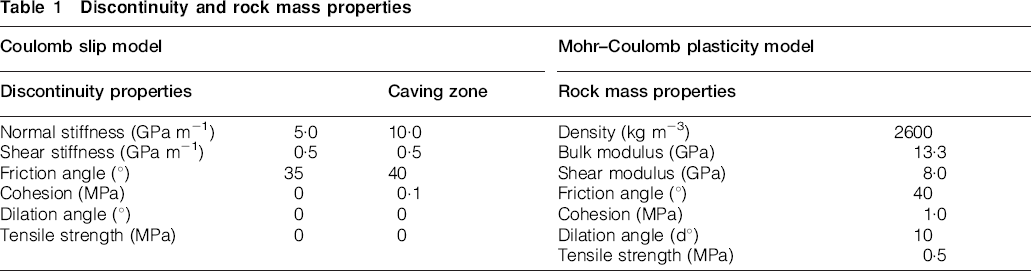
All simulations adopted similar rock mass and discontinuity properties. A gravity loading in situ stress field was assumed with a horizontal to vertical in situ stress ratio of 0·5. A Coulomb slip failure criterion was assumed for the joints. The joints were configured such that the non-persistent joints were offset to simulate the presence of rock bridges. Within the block being caved, slightly higher joint properties were used to again account for intact rock bridges, as well as numerical stability. This was not necessary for the far-field joints as interest was more specific to their kinematic response to the propagating cave. For this reason, the joint bounded blocks were modelled assuming an elasto-plastic yield criterion to simulate the failure of the rock bridges. The properties used in the models are presented in Table 1.
Discontinuity and rock mass properties
Since one focus of this study was to examine the influence of block caving on the rock slope kinematics, the joint properties were chosen to be at the limit of stability prior to block caving. In the sliding-type model, the angle of friction was chosen to be 35°. Based on the criteria of Goodman and Bray (1976), the major joint set angle was calculated to be 30° dipping out of the 45° face, which was less than both the angle of friction and the face angle, making it unlikely to slide in the original condition. In addition, the same approach was applied for the toppling-type models. A joint dipping angle of 75° was calculated using the same kinematic criteria for toppling.
Block cave simulation technique
A direct block deletion (DBD) technique was used to model the block caving process in which sequential block deletions were performed to simulate the mining process. The volume of deleted blocks between sequential models simulated the volume of ore extracted. From the bottom of the caving area, the extraction of the orebody was simulated by deleting blocks moving into the undercut created. Each sequence of block deletion was performed from the same area (the undercut level) and allowed the cave to propagate upward due to the effect of volume loss in that area. This assumes the uniform extraction of ore from multiple draw points as opposed to a sequenced draw (Halim et al., 2008). A series of mined lifts (50–100 m high) were modelled using this technique.
The simulation process was standardised for all models and included an initialisation phase where the in situ stress state was applied under elastic conditions and the displacements reset to zero. Each numerical run was solved until equilibrium conditions were attained (i.e. allowing the unbalanced force to self-stabilise).
Modelling results
Kinematic susceptibility: sliding (scenario 1)
For the scenario where the dip of the persistent joint set promotes translational sliding, the results show that the position of the cave has a significant impact on whether sliding slope displacements develop or not. The stress field is redistributed as a result of the extracted volume from the undercut and cave, and the resulting relaxation zone that develops in the cave back helps to promote caving of the strata upwards to the surface. The induced stress field contributes to the constitutive yielding of the rock mass around the cave based on the Mohr–Coulomb criteria. The gravitational-driven in situ stress field (K = 0·5) results in a decrease in the horizontal stresses (σxx) above the cave, with the host rock to the sides of the cave experiencing zones of stress concentration.
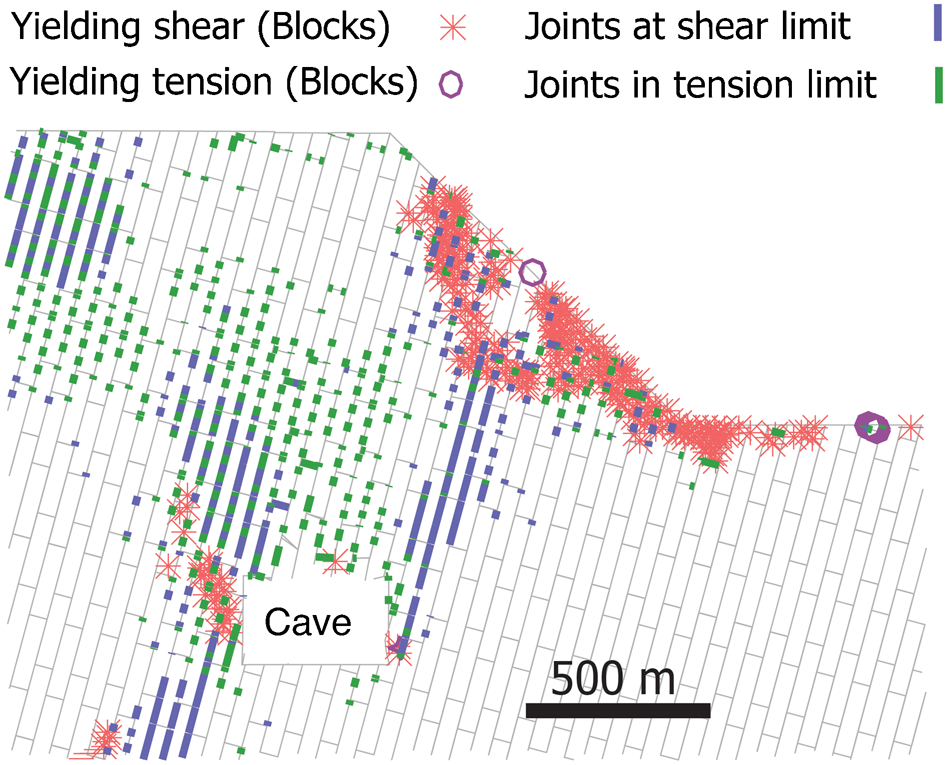
The plasticity and joint slip indicators suggest that both the discontinuity and rock mass responses are significantly influenced by the caving-induced strain field and that these control the overall kinematic response of the rock slope. Figures 4 and 5 illustrate the rock mass and slope response to the two different undercut/cave positions: behind the crest and underneath the toe. The undercut positioned behind the crest (Case 1) results in the tensile failure of rock above the cave back and shear and lateral movement of blocks along the persistent discontinuity set from the adjacent wall rock into the upward propagating cave. At surface, the caving-induced strain field acts to open tension cracks and promote shear, slip and collapse along scarps, characteristic of the caving and fracture initiation zones defined by Van As et al. (2003). The presence of the slope in the topography results in a significant degree of asymmetry in the propagation of the cave, with the trend deflecting by 30° towards the direction of the slope as shown in Figs. 4 and 7. The preferential movement of blocks along the persistent joints, dipping from left to right and daylighting into the caved void, result in the extension of the zone of surface disturbance away from the slope crest to the left. Tension cracks develop at surface where the extent of translational sliding into the cave localises.
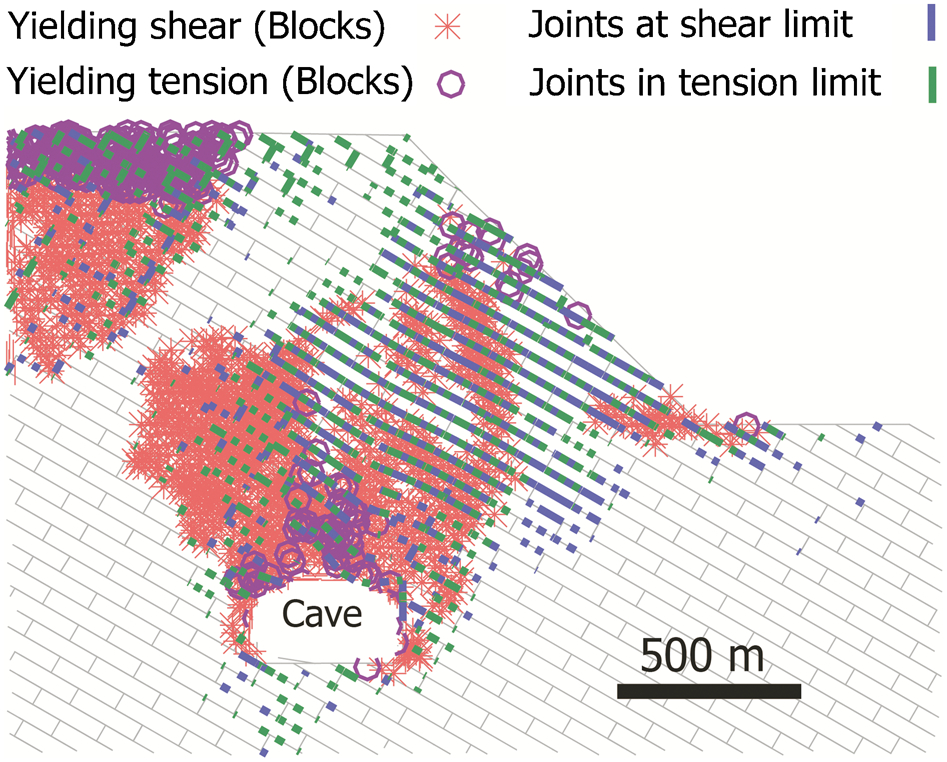
Rock mass and joint yield indicators resulting from caving behind the crest (sliding-type model)
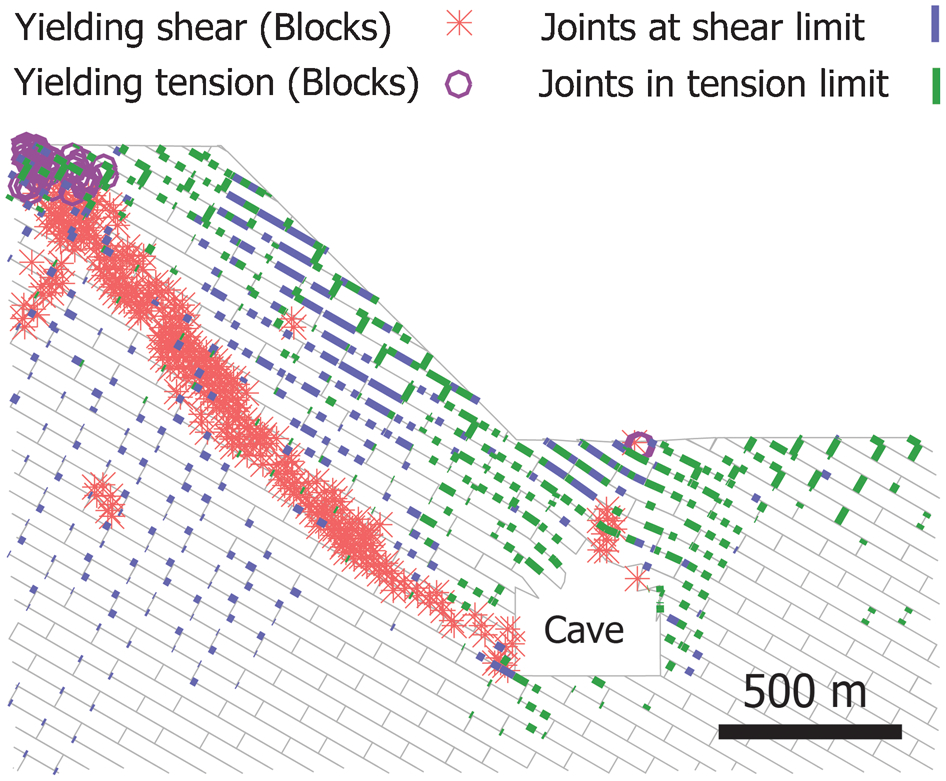
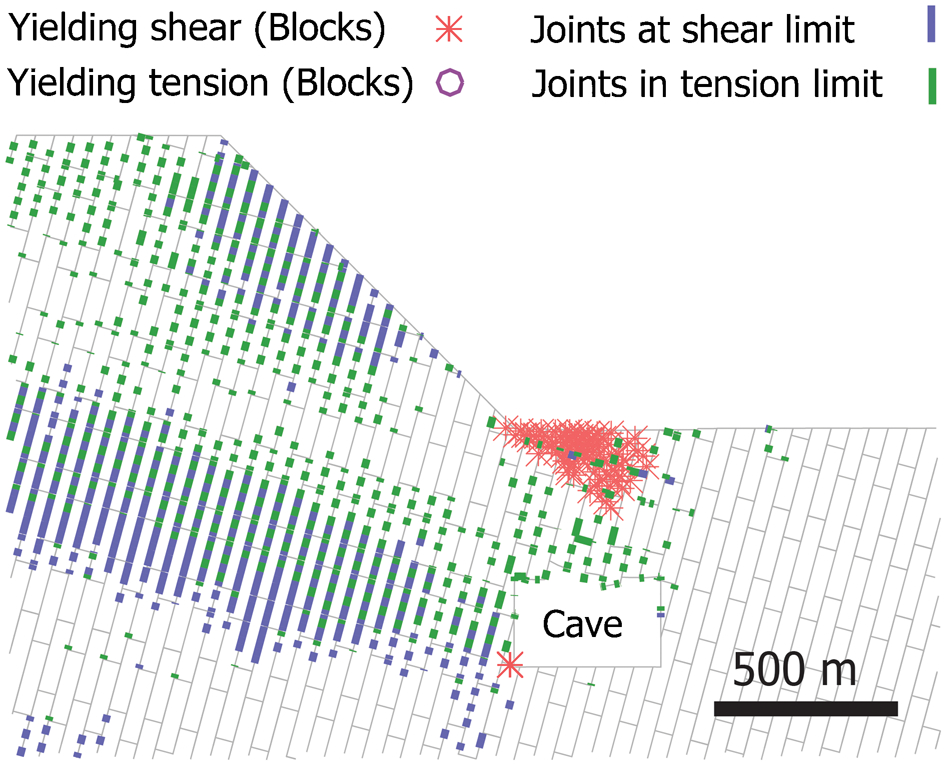
Rock mass and joint yield indicators resulting from caving underneath the toe (sliding-type model)
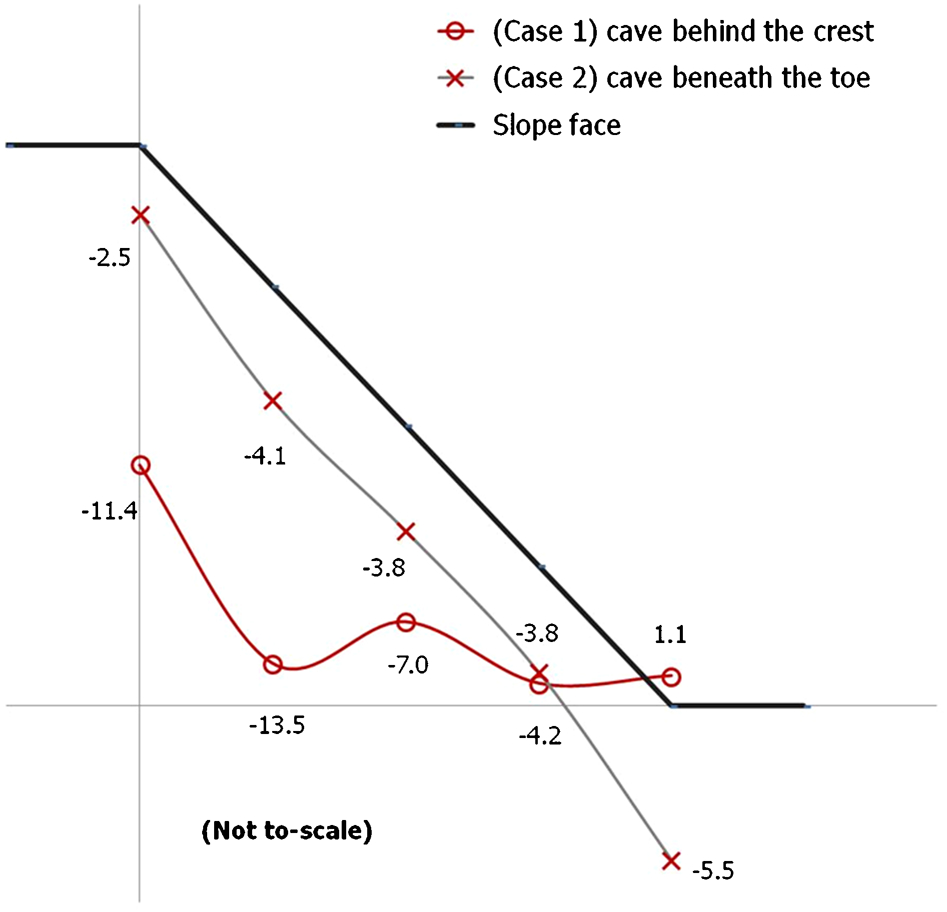
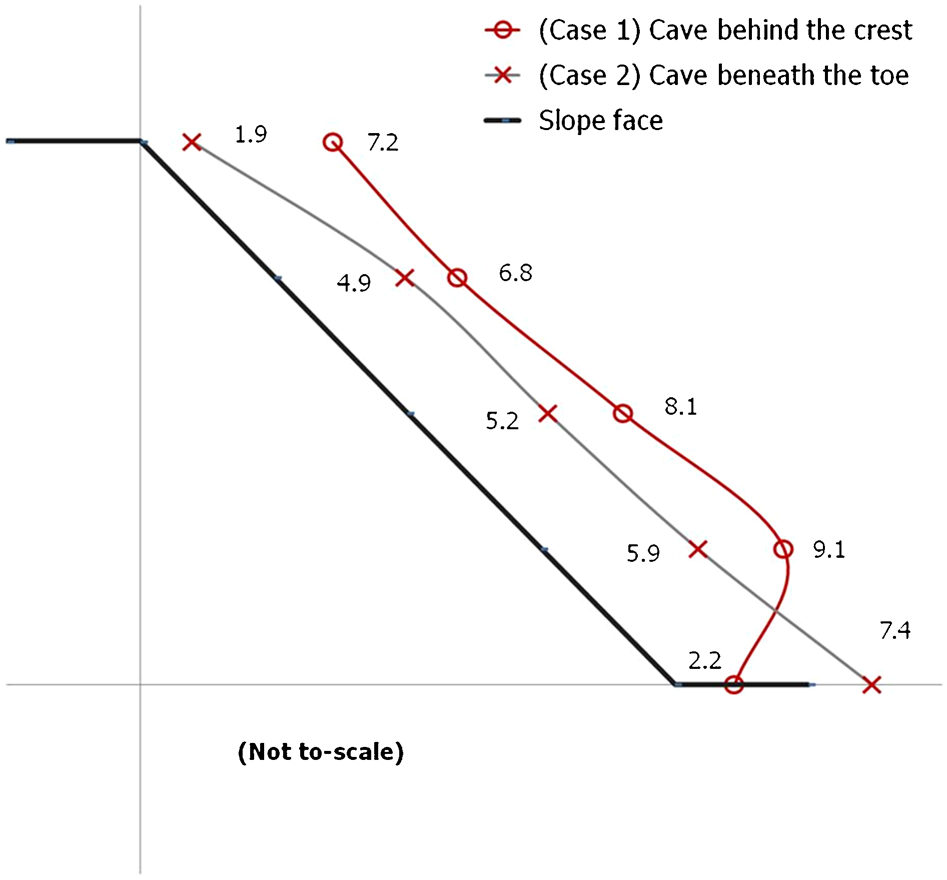
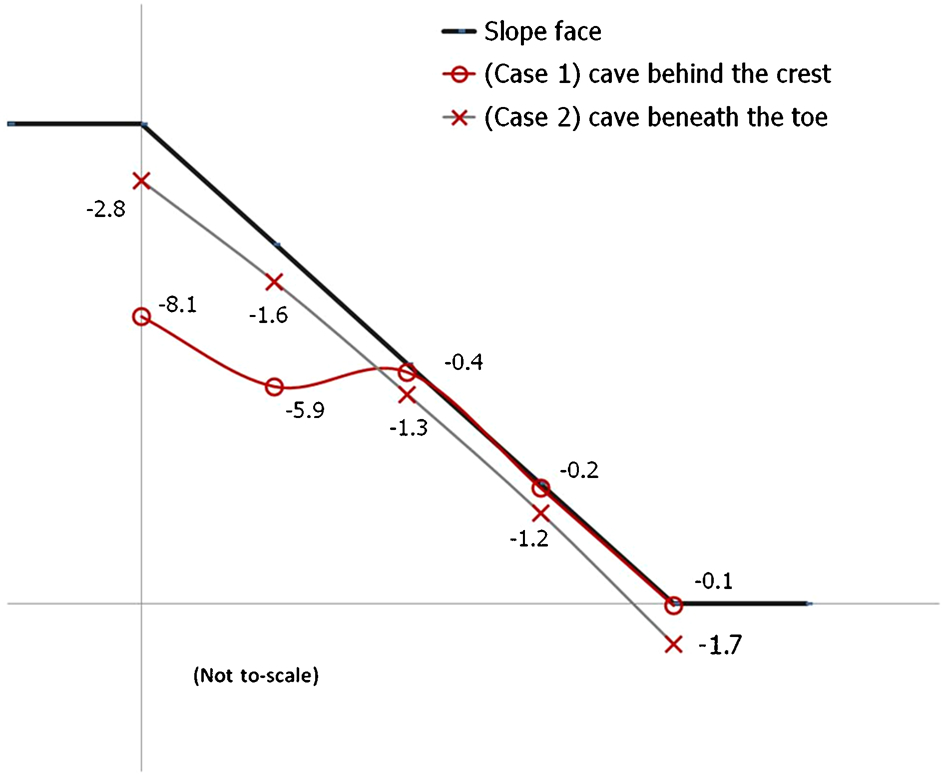
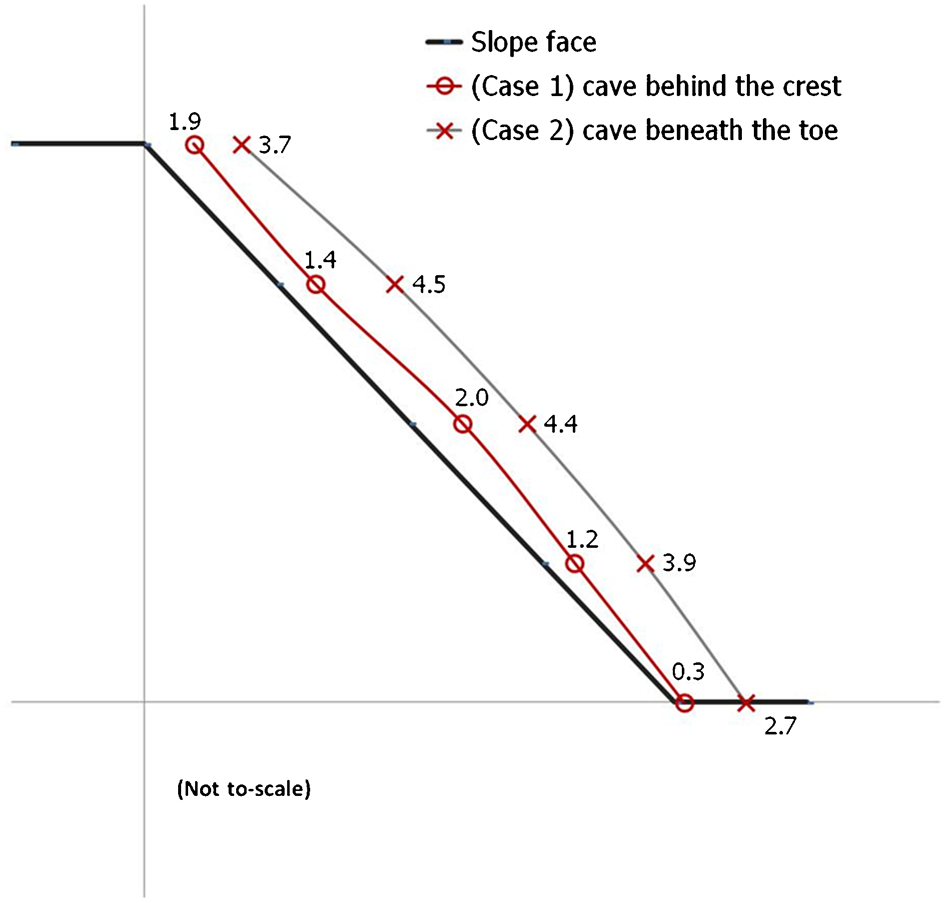
Vertical components of displacements (sliding-type model)
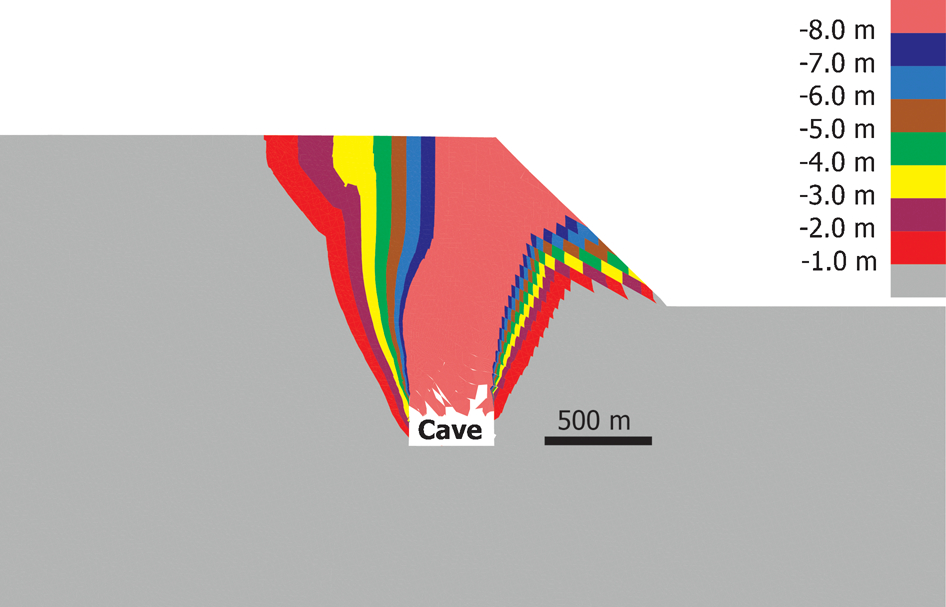
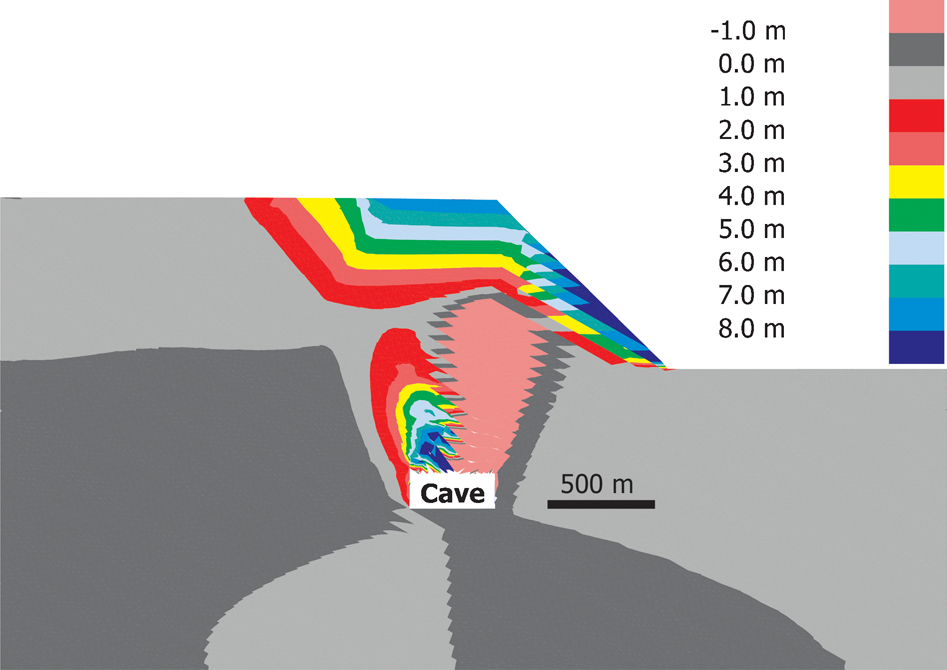
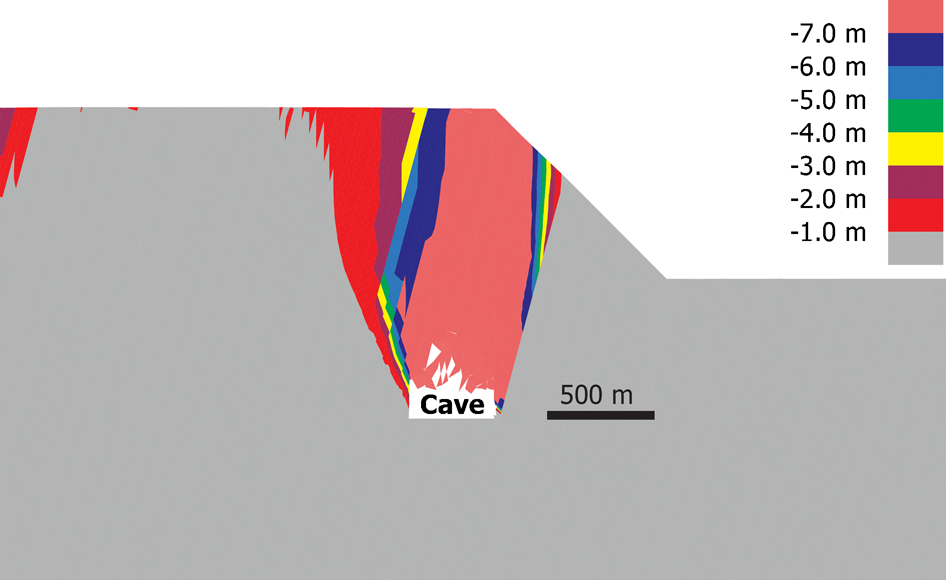
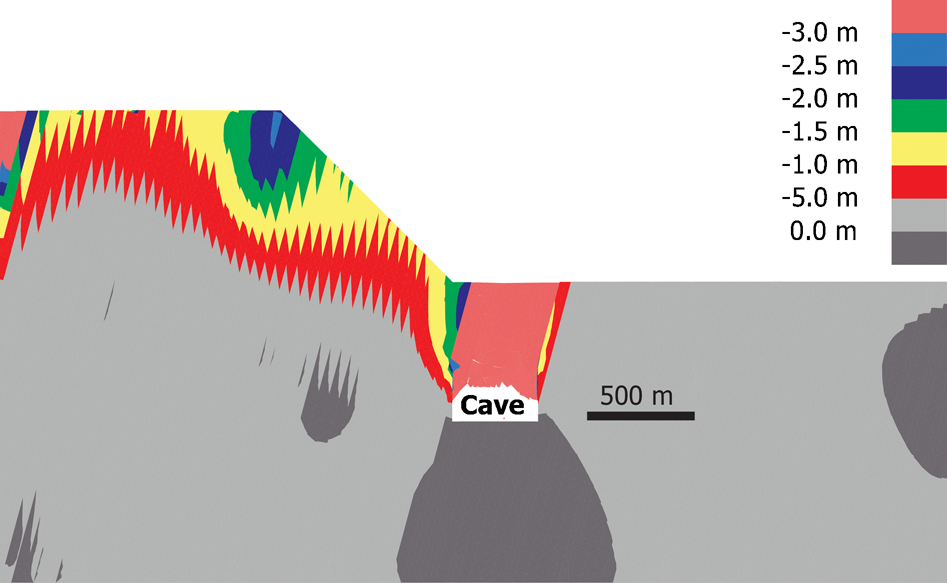
Contours distribution of the vertical displacements around the cave behind the crest (sliding-type model)
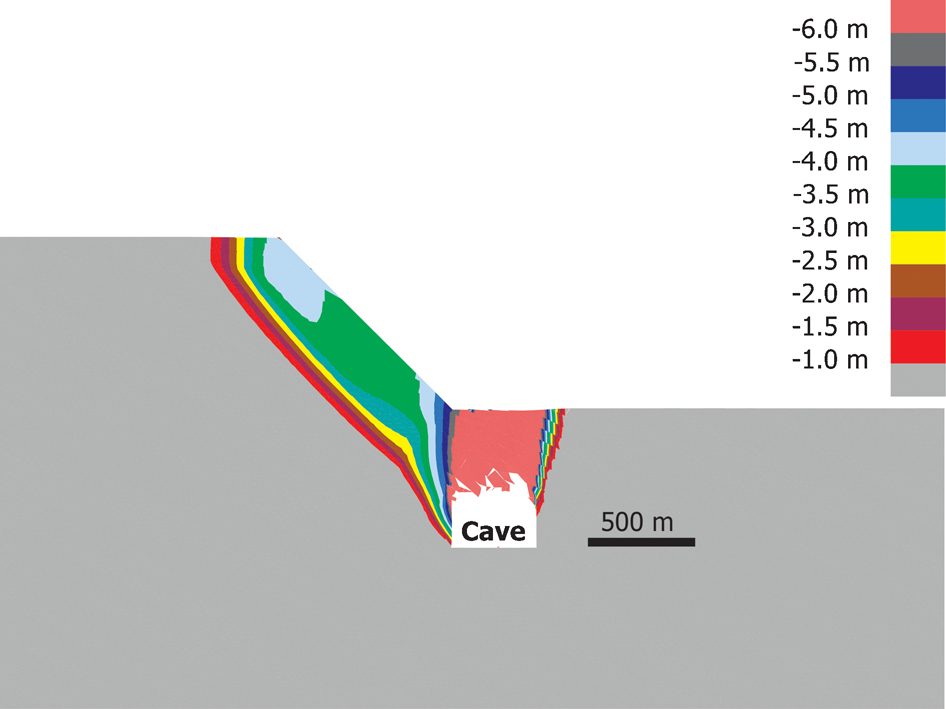
Similarly, when the cave is positioned beneath the foot of the slope (Case 2), translation sliding again develops sub-parallel to the persistent discontinuity set and into the cave (Fig. 5). However in this case, the presence of the slope results in a major sliding surface more clearly localising at an angle sub-parallel to the slope but slightly steeper than the dip of the major joint set. This indicates that localisation develops through a combination of rock mass failure and kinematic joint slip. The resulting deep-seated stepped path failure and rock mass shear arises from the interaction of stresses and strains generated from the caving as well as those that developed during excavation of the 800 m high open pit slope. Such a failure, where the cave undermines the foot of the slope, roughly approximates that which developed at Palabora (Fig. 1).
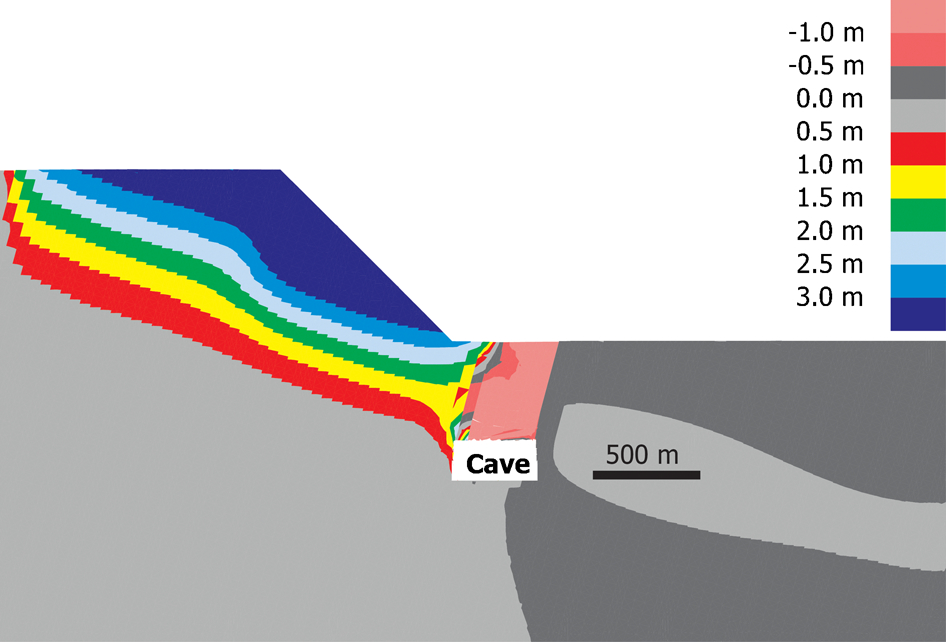
In terms of subsidence, the cave behind the crest of the slope (Case 1) imposes higher downward vertical deformations from the advancing cave back, with movement around the toe being less impacted (Figs. 6 and 7) compared to Case 2 where the cave is positioned beneath the toe (Figs. 6 and 8). Differences develop as a result of the types of block movements promoted by the advancing cave and the interaction of the strain field with the geological structures and topography. As expected, the upper part of the slope encounters the highest vertical movements when the undercut level is located directly beneath it. This results in a reverse slumping mechanism (into the slope), as reflected in the horizontal deformations shown in Fig. 10. Here, the highest horizontal deformations are encountered towards the bottom of the slope due to a combination of slip movements along the daylighting discontinuities and due to the redistribution of forces at the toe that leads to bulging (Fig. 9). The toe itself does not move as much as the points immediately above since the discontinuities dipping out of the slope near the toe are constrained (pinned) by the pit floor.
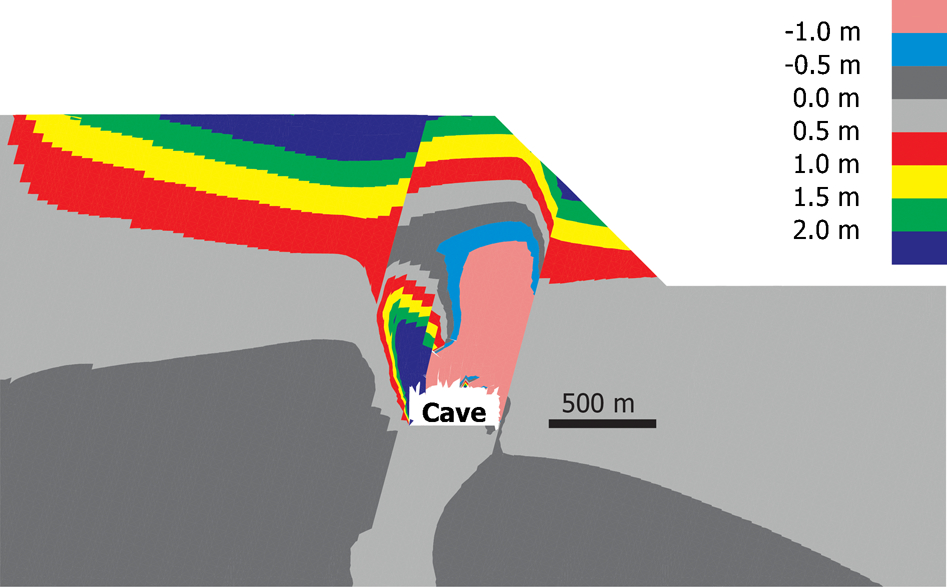
Contours distribution of the vertical displacements around the cave beneath the toe (sliding-type model)
Horizontal component of displacements (sliding-type model)
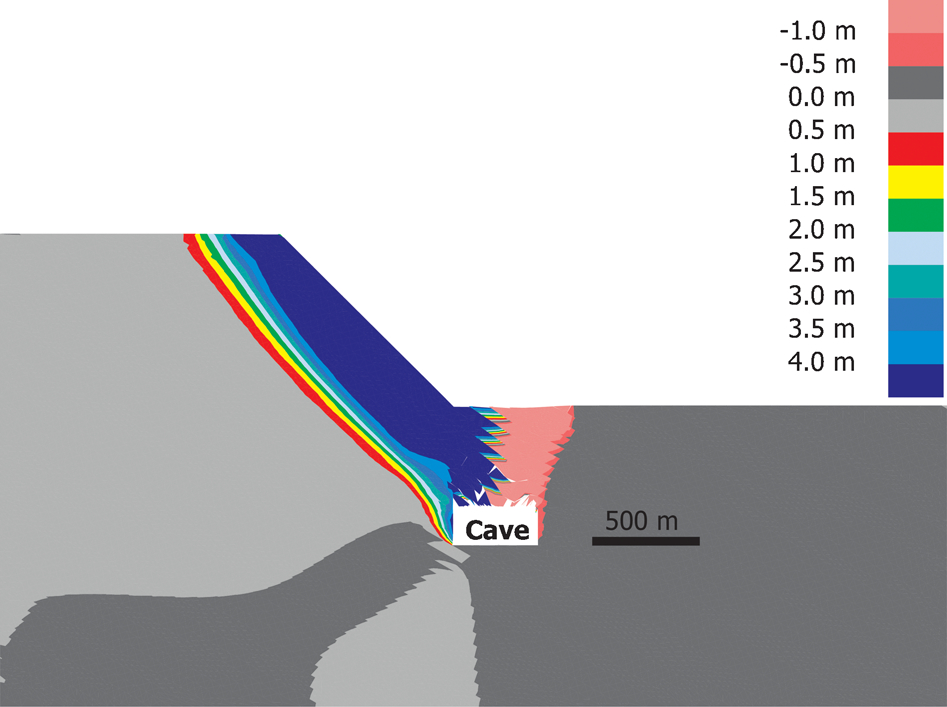
Contours distribution of the horizontal displacements around the cave behind the crest (sliding-type model)
This is in contrast to the case with the cave beneath the toe (Case 2) where the destressing of the crown pillar beneath the toe affords extra kinematic freedom that results in both the vertical and horizontal displacements being greatest at the toe (Figs. 6, 8, 9 and 11). When the cave position is beneath the toe, translational sliding along the joints leads to increased horizontal displacements, whereas the vertical displacements move directly downwards towards the cave. The well-defined continuous daylighting joint set with cross-joints enable the rock mass to move into the cave and, consequently, the middle of the slope encounters relatively the same amount of vertical displacement. Horizontally, the lower portion of the slope encounters higher deformations, especially at the toe, where it is kinematically free to move.
Contours distribution of the horizontal displacements around the cave beneath the toe (sliding-type model)
Toppling-type model results (scenario 2)
The change in dip angle of the persistent discontinuity set to one that kinematically promotes toppling (75° into the slope) resulted in a narrowing of the impact of block caving on surface displacements and rock slope interactions. Above the undercut, the slender blocks tend to buckle and topple into the cave. The disturbance of the stress field is minor with respect to the far-field rock away from the cave. When the undercut is beneath the crest of the slope, a reverse toppling mechanism develops with the block movements in the slope moving towards the cave (Figs. 12, 15 and 18). When the undercut is positioned beneath the foot of the slope, large scale toppling movements develop in the slope moving towards the cave following a classical block toppling rock slope failure mode (Figs. 13, 16 and 19). Similar to the kinematic description of toppling failures provided by Goodman and Bray (1976), the rock slope for all toppling-type models self-stabilise after the volume of rock mass above the cave reaches an equilibrium (Figs. 12 and 13). The probability of a potential rock slope failure through block-flexural toppling is greatest for the case of the cave underneath the toe (Case 2), although this is still minor. The reason for this is that the destressing of the crown pillar under the bottom of the pit enables the rock mass to freely rotate and topple. However, the cross-joints in the toppling-type case limit the slope's susceptibility to pure toppling requiring shearing of rock bridges (Figs. 12 and 13).
Rock mass and joint yield indicators resulting from caving behind the crest (toppling-type models)
Rock mass and joint yield indicators resulting from caving beneath the toe (toppling-type models)
Vertical components of displacements (toppling-type models)
Contours distribution of the vertical displacements around the cave behind the crest (toppling-type model)
Contours distribution of the vertical displacements around the cave beneath the toe (toppling-type model)
Horizontal components of displacements (toppling-type models)
Contours distribution of the horizontal displacements around the cave behind the crest (toppling-type model)
Contours distribution of the horizontal displacements around the cave beneath the toe (toppling-type model)
In terms of the surface deformation profiles, the joint configuration promoting toppling results in the highest vertical displacements directly over the cave and therefore in the upper half of the slope when the cave is positioned beneath the slope crest (Figs. 14 and 15). The orientation of the structural discontinuities has a significant impact on the vertical deformations, with the crest moving directly towards the cave under reverse toppling. The monitoring points for the lower half of the slope show substantially smaller movements.
Destressing of the toe when the cave is positioned beneath the foot of the slope (Case 2) promotes more adverse toppling conditions, which lead to larger horizontal slope deformations (Figs. 17 and 19). The cross-joints act as rock bridges to limit slope deformations resulting in a combination of block toppling and flexural toppling behaviour; these result in vertical and horizontal displacement profiles that are generally uniform over the interval of the slope face (Figs. 14, 16, 17 and 19).
Conclusions
A DBD method was successfully employed to simulate block caving in a series of 2-D distinct-element models to investigate the interactions that the resulting strain field had on a large rock slope as a function of cave position and orientation of the main discontinuity set. These were shown to be equally important and interconnected in terms of the corresponding rock slope response.
Where the dominant joint set was oriented to promote translational sliding, the location of the cave behind the crest was seen to result in the movement of the upper half of the slope towards the cave, resulting in the cave propagation redirecting towards the slope face instead of propagating vertically. When the cave was beneath the foot of the slope, a well-defined step-path failure was seen to develop and localise involving both slip along discontinuities but also shearing of intact rock bridges. Where the dominant joint set promoted toppling-type movements, the self-stabilising behaviour of this rock slope failure mode was seen to limit displacements. A combination of block and flexural toppling was seen to develop when the cave was underneath the slope toe. Caving above an undercut behind the slope crest was seen to promote reverse toppling of the upper half of the slope backwards towards the caved void. A high potential for flexural toppling failure was not seen in either case, partly due to the interlocking nature of the cross-joints, which served to form rock bridges for which the shearing forces generated were not high enough to cause yield. This is in contrast to the models simulating sliding where the forces were high enough to overcome the shear resistance provided by the rock bridges.
Footnotes
Acknowledgements
The authors would like to acknowledge King Abdulaziz University (KAU) for providing funding for this study. Additional funding and data were provided for this work by Rio Tinto through a Collaborative Research and Development grant from the Natural Sciences and Engineering Research Council of Canada.