
Abstract
Image analysis as a technique for fragmentation measurement of rock piles has been the subject of research since the 1980s, and to date, run of mine (ROM) fragmentation optimisation studies have primarily relied on particle size measurement using photographic-based 2D imaging systems. Disadvantages of 2D imaging systems include particle delineation errors because of variable lighting and material colour and texture variation; no direct measure of scale and perspective distortion; and inability to distinguish overlapped particles, non-overlapped particles, and areas of fines. With the development of 3D imaging technologies, there is an opportunity to develop techniques that could improve data collection and overcome the limitations of existing 2D image-based systems. This paper describes the first attempt to use 3D high-resolution laser scanning techniques to quantify ‘whole of muckpile’ fragmentation from full-scale production blasting. During two monitoring campaigns in 2013, high-resolution laser scanning data were collected from production blasts at Esperanza mine (Antofagasta Minerals Group). Fully automated analysis of the 3D data was possible in all cases where the data were of sufficiently high resolution. Manual pre-processing was required when the data were of low resolution to specify the region of fines. Overall results indicated that ROM fragmentation requirements were meeting specified targets, despite the marked differences in powder factors. This was particularly the case for those blasts conducted in similar geological domains. This work has demonstrated that high-resolution laser scanning can be used as an alternative technique to measure ‘whole of muckpile’ fragmentation in production blasting.
Introduction
For a number of years, both researchers and practising engineers have been aware of the importance of being able to tailor blast fragmentation to optimise the overall mineral extraction and recovery processes. In mining and quarrying, there is evidence to suggest that by providing an appropriate size distribution to crushing and grinding circuits, a measurable increased throughput and/or reduced power draw can be obtained. In a process integration/optimisation approach (e.g. Mine to Mill), measuring run of mine (ROM) blast fragmentation is necessary for model calibration purposes and their subsequent application in scenario-based simulations (Onederra et al., 2010).
Image analysis as a technique for fragmentation measurement of rock piles has been the subject of research since the 1980s (Carlsson and Nyberg, 1983; Ord, 1988) and to date fragmentation optimisation studies have primarily relied on particle size measurement using photographic-based 2D imaging systems. The 2012 Fragblast workshop on Measurement and Analysis of Blast Fragmentation provides several current examples of fragmentation measurement for blast assessment (Venkatesh et al., 2013; Delille et al., 2013 and correspondence with Delille). These are entirely based on 2D photographic imaging and are all image analysis systems that perform a particle delineation that then requires ‘manual editing to insert missing boundaries between fused fragments, and to delete false edges where a fragment has disintegrated into two or more pieces’ (Venkatesh et al., 2013).
The disadvantages of 2D photographic systems are significant and have been noted variously by Thurley and Ng (2005), Thurley (2012) and Noy (2013) and include:
Severe particle delineation errors because of uneven lighting conditions, which can be extreme outdoors, excessive shadowing, and/or colour and texture variation in the material
no direct measure of scale and perspective distortion
lack the capability to distinguish between overlapped and non-overlapped particles and
an inability to automatically detect visible fines in a realistic way.
In their review of another commercial photographic-based 2D system, Potts and Ouchterlony (2005) express strong reservations saying that: ‘2D imaging has a certain but limited usefulness when measuring the fragment size distribution in a muckpile or from a belt in an accurate way. It could probably detect rough tendencies in fragmentation variations, if the lighting conditions do not vary too much, and if cover glasses for camera lenses are kept clean’. In addition, they report that for their application, the system erroneously ‘causes the truncated, bimodal distributions to, in a misleading way, show up as unimodal curves. This implies a strong limitation of the system's ability to detect changes in the form of the fragment size distribution’.
In the open-pit environment used here, variation in lighting conditions can be extreme, and in the authors’ opinion, it ensures that 2D photographic imaging can only be highly erroneous without substantial manual particle delineation, which in itself introduces inconsistencies as a result of the human operator.
Furthermore, the authors note that using a fragmentation assessment system that cannot detect a bimodal distribution will most likely prevent detection of one when it is present. Therefore, the choice of a fragmentation assessment system comes down to how much one can trust a system that forces a type of distribution, instead of trying to represent the actual fragmentation in the images taken.
With the development and further accessibility of 3D imaging technology, there is an opportunity to develop techniques that could overcome the limitations of existing 2D image-based systems. This can include the ability to obtain data without the influence of lighting conditions, shadowing or texture differences, and the ability to automatically delineate particles without the need for manual editing. Furthermore, 3D data provides a direct measure of scale, and as demonstrated by Thurley and Ng (2005, 2008) and Thurley (2009, 2013) provides the ability to classify delineated regions as overlapped particles, non-overlapped particles or areas of fines, size these different classes of material in different ways and output size distributions based on volume information.
There have been very few publications relating to particle size measurement using 3D imaging in an open-pit environment (Noy, 2013; Thurley, 2013). Noy (2013) presents work on a stereo camera set-up attached to a shovel and discusses many of the difficulties getting a system to work well in such an environment. Noy calibrates the measurements against sieving data and no examples of the particle delineation are provided.
The presented work, based on Thurley (2013), calculates the size of the non-overlapped particles and the areas of fines without statistical remapping to an expected size distribution and the assumptions these imply (Potts and Ouchterlony, 2005). Furthermore, examples of the particle delineation results are shown and the particle delineation is classified into non-overlapped rocks, overlapped rocks and areas of fines. Thurley provides the only published algorithms (Thurley and Ng, 2008; Thurley, 2009) to remove the bias resulting from mis-sizing overlapped particles as if they were smaller non-overlapped particles and to detect areas of fines.
There are also additional sources of error relevant to any measurement system that collects a ‘sample’ or image from the visible surface. The most significant of these is Segregation and Grouping error, also known as the Brazil nut effect (Rosato et al. 1987), where a pile of rocks have a tendency to segregate into material of different sizes when subjected to vibration. While this is not an appropriate description of blasting, it is also not reasonable to assume that the blast homogenises the rock pile. Therefore, the pile surface at any given moment is not expected to be representative of the entire pile. Therefore, in order to collect a representative and statistically significant sample, measurement during different stages of the material extraction has been performed for each blast.
This paper presents the data collection and analysis to evaluate ROM blast fragmentation. During two monitoring campaigns in 2013, high-resolution laser scanning data were collected in two phases of production at Esperanza mine (Antofagasta Minerals Group) in northern Chile. This paper describes the background, and results from this comprehensive blast fragmentation monitoring campaign.
Esperanza mine, Chile
Esperanza is a large open-pit copper and gold mine located 30 km from Sierra Gorda community of the Antofagasta Region in Chile (Fig. 1). During its first 10 years of operations, it will produce approximately 190 000 of copper concentrates and 230 000 pounds of gold as its main byproduct. The project construction started in mid-2008, and its start-up period in November 2010. Reserves are estimated in 587m tons with an average copper grade of 0·53% and more than 0·22 g of gold/ton. The project involved a total investment of US$2·7bn. Figure 2 shows an image of the open-pit mine.
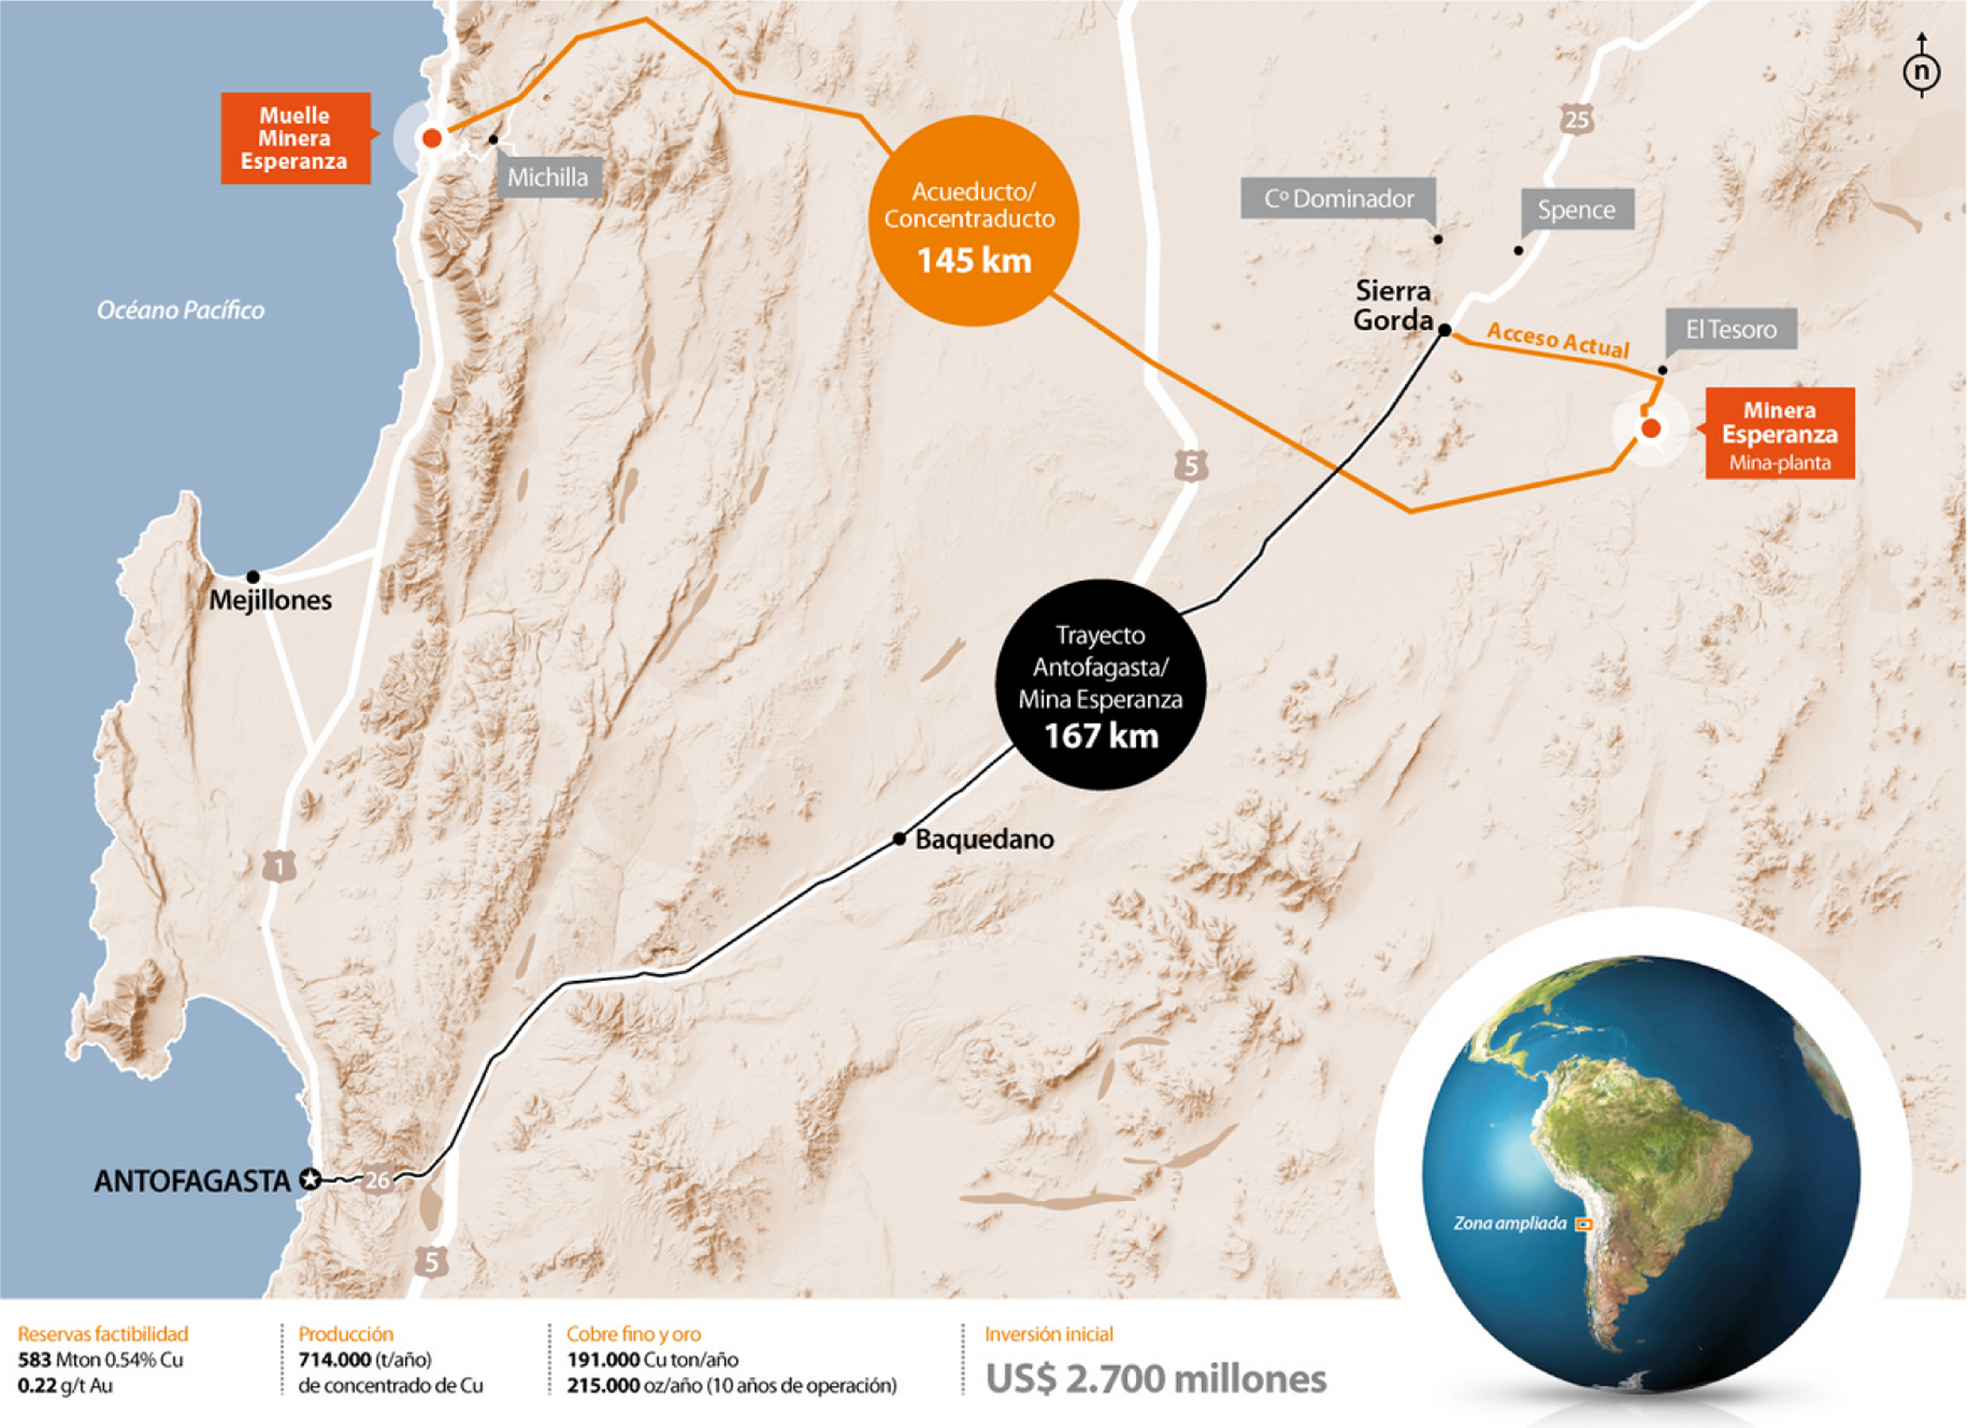
Location of Esperanza mine (Antofagasta Minerals, 2014)
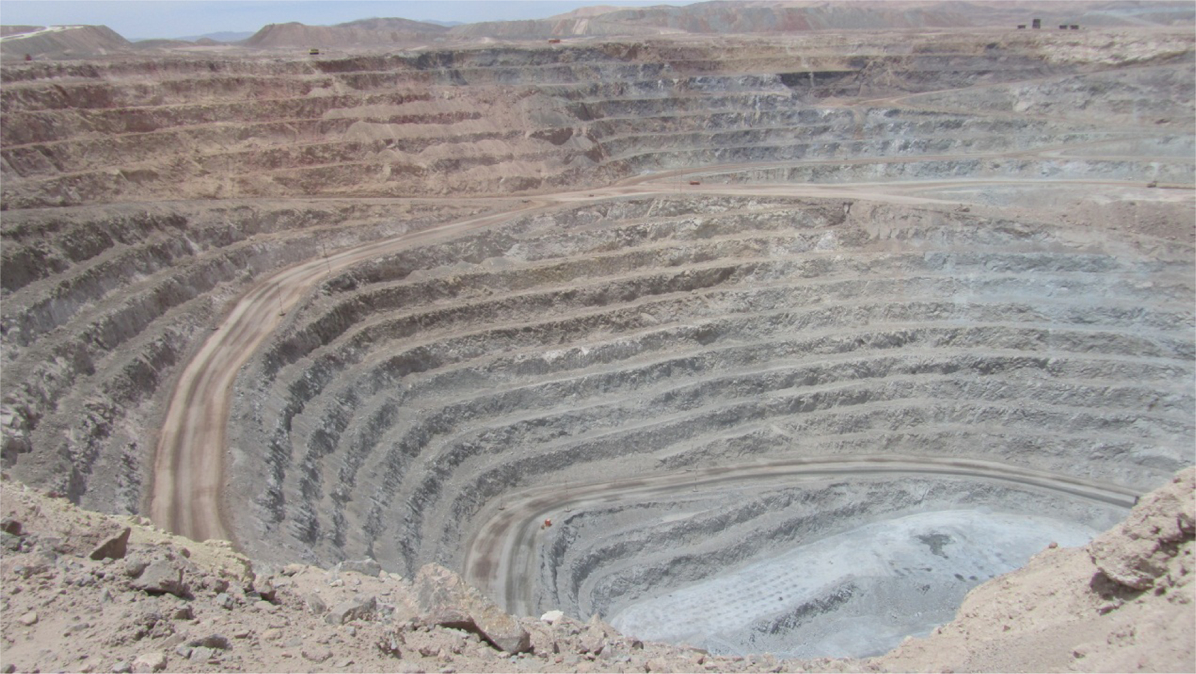
View of Esperanza pit and blasting practices near final walls of Phase 02
Two comprehensive blast performance monitoring campaigns were conducted at Esperanza mine. The first was carried out during January to March 2013, focusing on three production blasts with an average powder factor of 480 g/t in 16 m high benches. A total of 58 scans from these three muckpiles were processed in this particular stage. The second campaign was conducted during the months of October and November 2013, focusing on another set of production blasts with an average powder factor of 360 g/t. In this case, a total of 37 scans from these three muckpiles were processed.
Method of data collection and analysis
The data analysis process has been adapted from earlier developments in laser scanning of materials in conveyor belts (Thurley, 2012) and LHD buckets (Thurley, 2009). This new adaptation used site-specific data collection procedures, which considered both site access and the main specifications of the laser scanning system available. The data collection described in this paper was performed in collaboration with Esperanza mine personnel, and used the 8810 series I-Site Maptek laser scanning system (Maptek, 2014). The procedures implemented at Esperanza mine ensured that scans were performed at regular intervals during the excavation cycle. The principal aim was to obtain data from the front, middle and back sections of each muckpile. Scanning was conducted immediately after the blast and at intervals that minimised interference with production activities. However, there were few instances where data collection was prioritised in order to maintain sampling consistency.
Measurement hardware
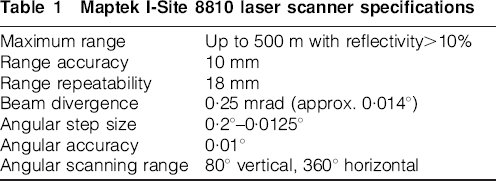
The Maptek I-Site 8810 scanner is generally used for mapping the geometry of the open pit and collect data for pit design geometry reconciliation and subsequent geotechnical analysis. The product specifications state a minimum angular step size of 0·0125° and a beam divergence of 0·25 mrad (approx. 0·014°). The beam divergence is only slightly larger than the angular step size, so the spot size of the laser at any given point will be quite similar to the distance between that point and its neighbouring points. A more detailed list of specifications is shown in Table 1. This very small angular resolution of 0·0125° makes the I-Site scanner suitable for collecting high-density 3D surface ‘images’ of rock piles suitable for fragmentation measurement.
Maptek I-Site 8810 laser scanner specifications
Rocks that are further away from the scanner will have fewer measured 3D points on them, meaning smaller rocks will be less able to be detected the further away they are.
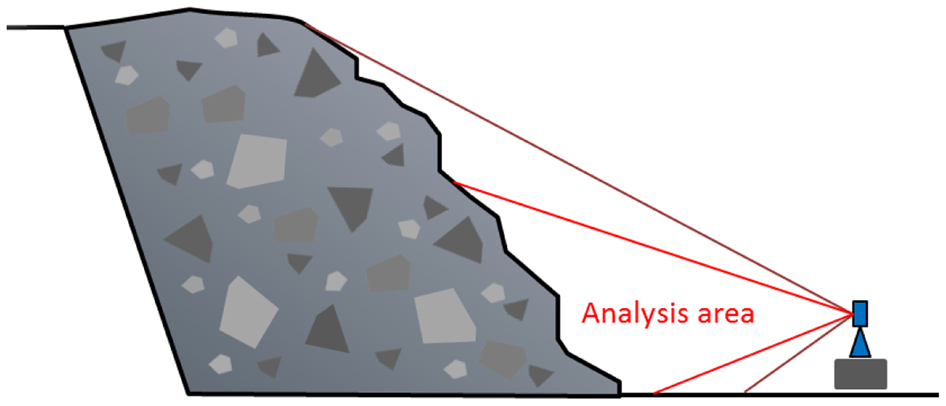
In reference to Fig. 3, the data collection scanning procedure included the following components:
Scanning muckpiles at different intervals and regions during the excavation process.
Scanning part of the muckpile from close range (approximately 9 m) for fine resolution scans.
Scanning the full height of the pile (or close to) at longer range (approximately 20 m) for coarse resolution scans.
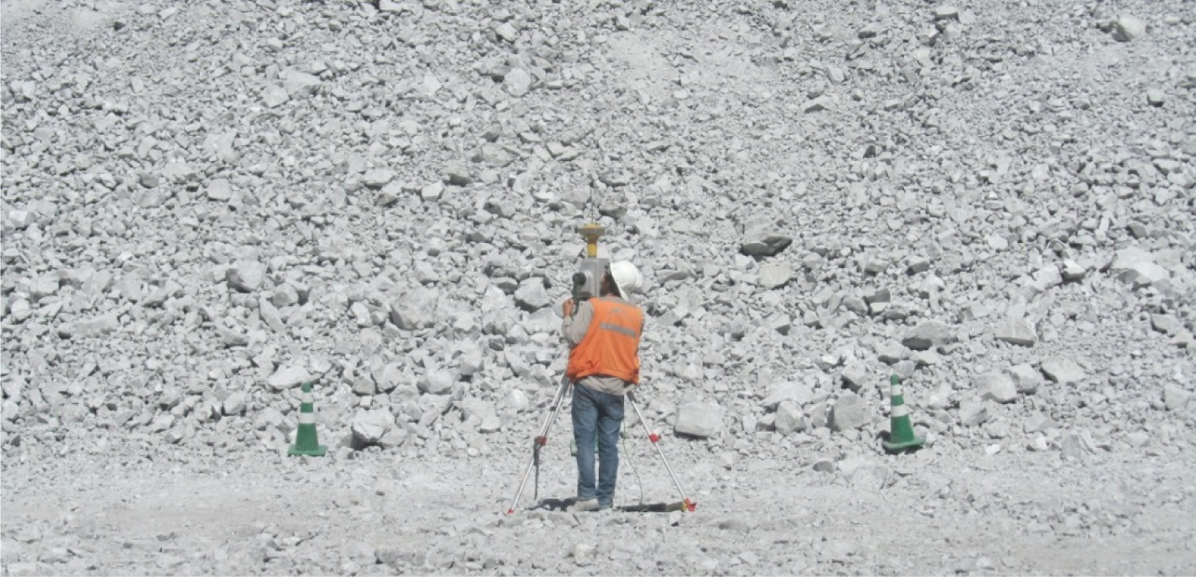
Example of laser scanner positioning
Looking at a pile at a high angle will make the scanned data of lower spatial resolution and, therefore, less able to detect smaller rocks. The scan sequence was set at 13° left and 13° right, and 20° up and 5° down. The angles were chosen to select the close range highest resolution portion of the data and to ignore as much as possible the pit floor in order to avoid manual cropping and pre-processing steps.
Measurement geometry
One of the key criteria for particle size measurement is high data density as it defines the capacity to detect small overlapped particles, the lower limit on particle size that can be reliably detected and the resolution of size classes detectable. Therefore, understanding the expected spatial distance between measured 3D points is important.
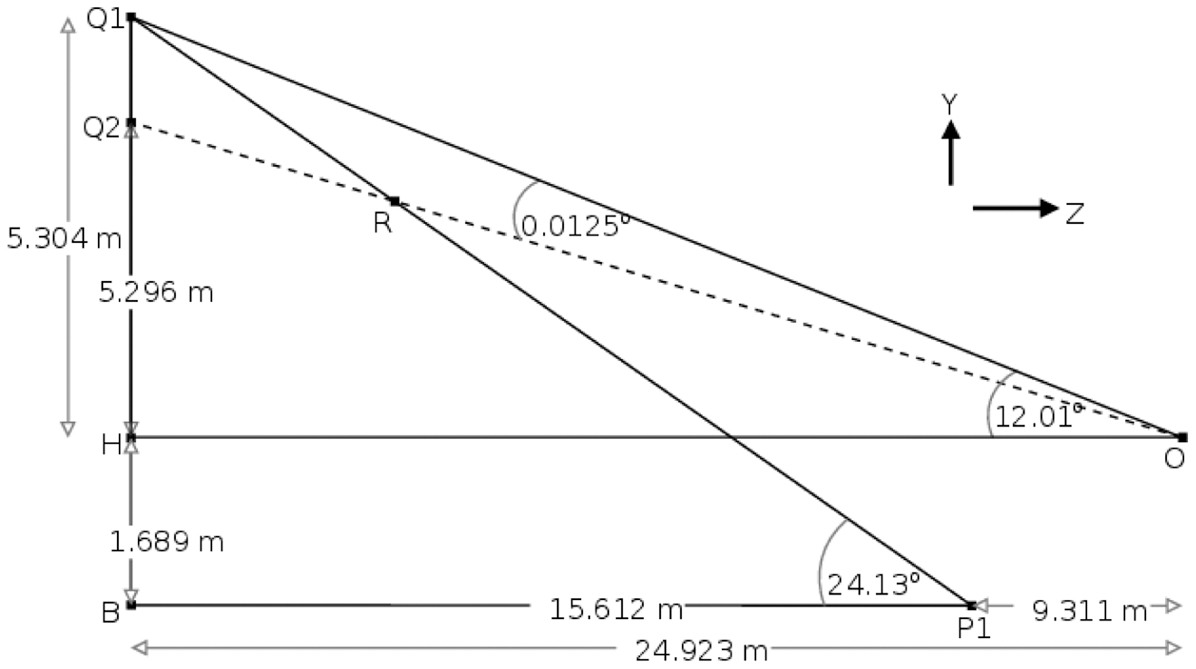
The measurement geometry is illustrated in Fig. 4, which in the field closely refers to Fig. 3. In this approach, the measured data are further cropped to ±12° in the horizontal plane and −5° to +12° in the vertical plane. There is no special reason for choosing precisely 12° but it was chosen as a balance between a high spatial resolution of 3D points and a sufficiently large field of view of the rock pile.
Measurement geometry and analysis area
Considering a sample cropped measured dataset with 2·4 million 3D points, which the authors denote set A (as shown in Fig. 6), and that this dataset exists in a right-handed coordinate system with the positive z axis being a horizontal line from the rock pile to the laser scanner, and the x,y image plane perpendicular to the z axis. The authors note that set A is a dataset with a roughly fixed angular resolution (subject to an angular accuracy of 0·01°) but an increasing spatial resolution Δx and Δy in the image plane between neighbouring 3D points. Set A (Fig. 6) has an extent of [−4·657 m, 4·752 m] in the x axis, [−1·689m,5·304 m] in the y axis, and [−24·923 m, −9·311 m] in the z axis, where the laser scanner is positioned at the origin. Using trigonometry, the distance measures between neighbouring points can be considered in the simple case. At a distance of 10 m from a vertical wall, with a horizontal angle of 0°, and vertical angles of 0° and 0·0125°, the corresponding Δy distance is 2·2 mm. If the vertical angles are increased to 11·9875° and 12°, then the Δy distance is 2·3 mm. But this is the best case of a perpendicular surface to the scanner and the worst case is less trivial as the scanner is measuring values on the rock pile, which is inclined away in the y axis.
Measurement geometry for an example dataset (set A) not drawn to scale
Raw data from a muckpile laser scan
Given the known extents of set A, the authors convert Fig. 4 into a simple geometric representation of the y,z plane as shown in Fig. 5 (not to scale). This figure depicts the laser scanner at the origin O, the rock pile approximated by the triangle ▴Q1P1B, and the dashed line
From experience of analysing 3D profile data of piled particles (Thurley, 2009, 2011, 2012), the expectation is that particles in a pile can be reliably detected at a size of approximately 10 times the spacing between points in the image plane. Therefore, for set A with 3D data points with a Δy ranging between 2·2 and 15 mm, the expectation is to detect particles larger than 22 mm at the area of highest point density and larger than 150 mm in the areas of lowest point density. Unfortunately, this upper limit is higher than would be preferred. The only way to improve this with the current system is to change the measurement geometry by being closer to the pile. This may not always be possible in operational environments. Further research is required to evaluate imaging systems that could be mounted on excavators or shovels that are always in close proximity to the pile.
The beam divergence of the laser is only slightly larger than the angular resolution, so the authors can expect that the beam spot size is similar to the values calculated here, with a beam size of the surface of the pile slightly larger than 37 mm in the worst case. The implication being that the 3D point calculated in this case is some weighted average value of the rocks in a circular area slightly larger than 37 mm diameter. This will add a smoothing to the data, blurring the edges and likely making particle segmentation more difficult in these areas.
Processing
The data processing methodology is an entirely automatic process with no manual intervention and consisted of the following steps:
Processing the range data to x,y,z and row, column ordering based on the laser scan lines.
Cropping the bottom 500 mm off the vertical axis to ensure the pit floor has been removed.
Filtering to remove erroneous 3D points and interpolating missing 3D points.
Orthogonally re-projecting the data.
Performing particle delineation.
Back projecting the data to the original perspective projection.
Sizing.
The particle delineation approach is based on watershed segmentation and morphological operators. The following is an overview of the analysis approach with details presented in Thurley (2013).
Pre-processing is performed to remove the erroneous rays of data points that can occur in the laser data. These rays of 3D data points appear in vertical columns of data and arc up from the rock pile surface and remain above the pile surface. These are removed using a minimum filter.
Particle delineation is performed using the following stages:
Edge detection is performed using a morphological gradient with a spherical structuring element and then thresholded to classify edges.
Seed formation for the watershed segmentation is performed using a three-step process based on distance transform, local maxima, and seed merging.
Watershed segmentation based on the seed regions is applied to the rock pile data after which a filter is applied to remove small ‘noise’ regions.
The classification of delineated regions into non-overlapped rocks, and areas of fines is based on algorithms developed by Thurley and Ng (2008) and Thurley (2009). These algorithms examine each region in the segmentation and perform a neighbourhood-based analysis of the 3D information around the perimeter of each particle. Sizing is performed by calculating an elliptical volume for each identified non-overlapped rock and a bulk volume for the combined areas of fines using a constant depth parameter. Four test measurements were used to determine this parameter, which was used in all subsequent analysis. Although this pragmatic approach can be sufficient for making relative comparisons of fragmentation outcomes, it has a number of limitations, particularly if prior calibrations have not been adequately conducted. Further work is currently under way to establish a procedure that involves estimating fines with measurements taken from both the source muckpile and the primary crusher product. This procedure will use the available laser-based fragmentation analysis technology on conveyor belts (Thurley, 2012) and material tracking devices.
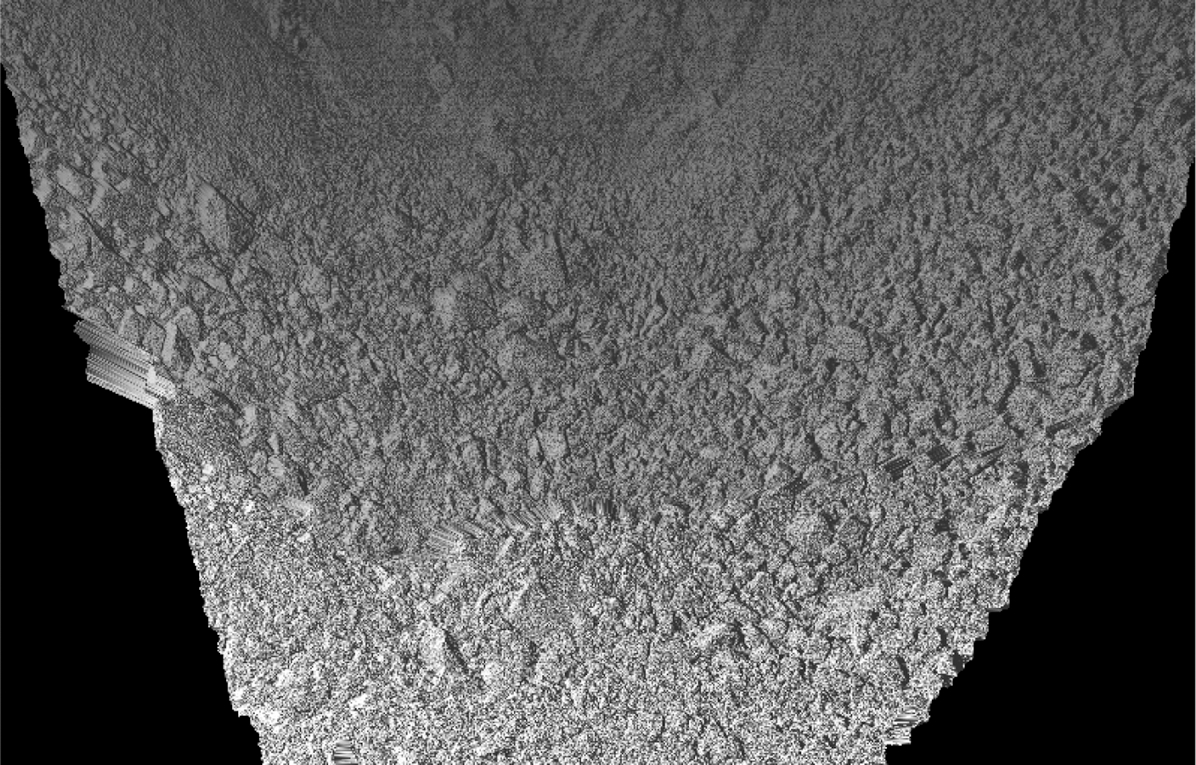
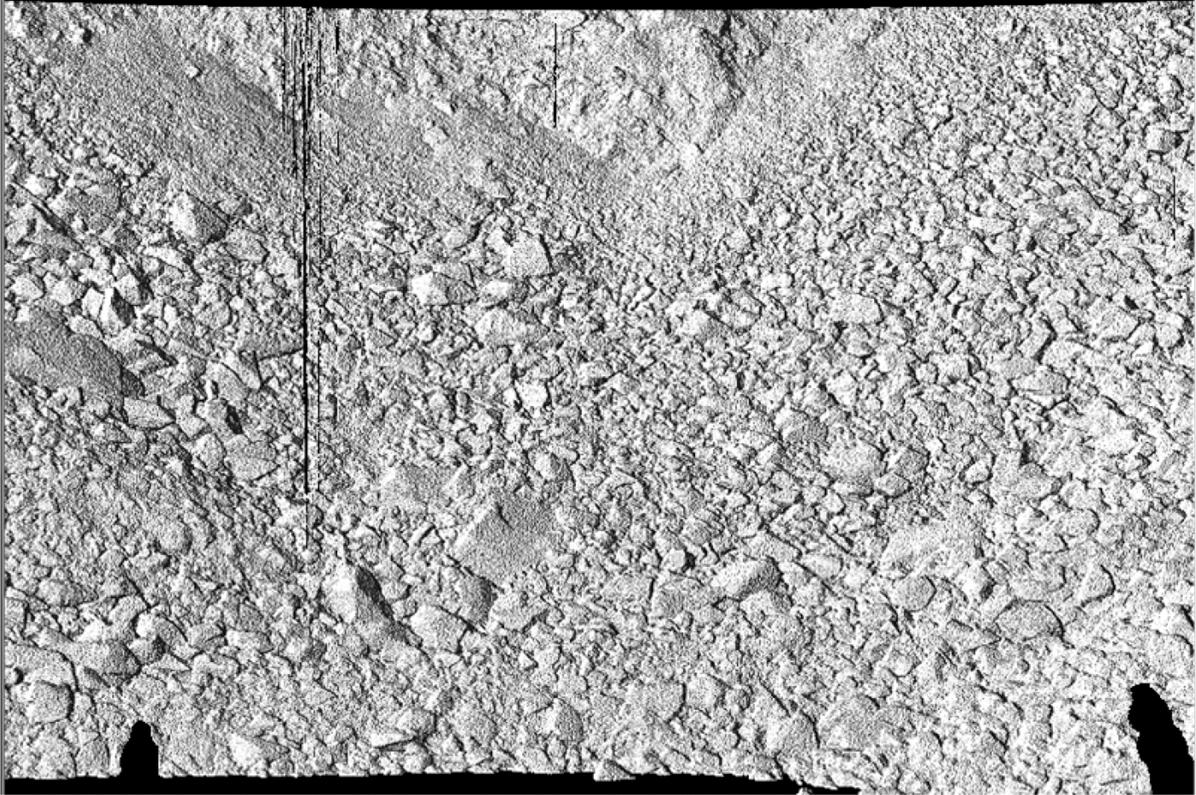
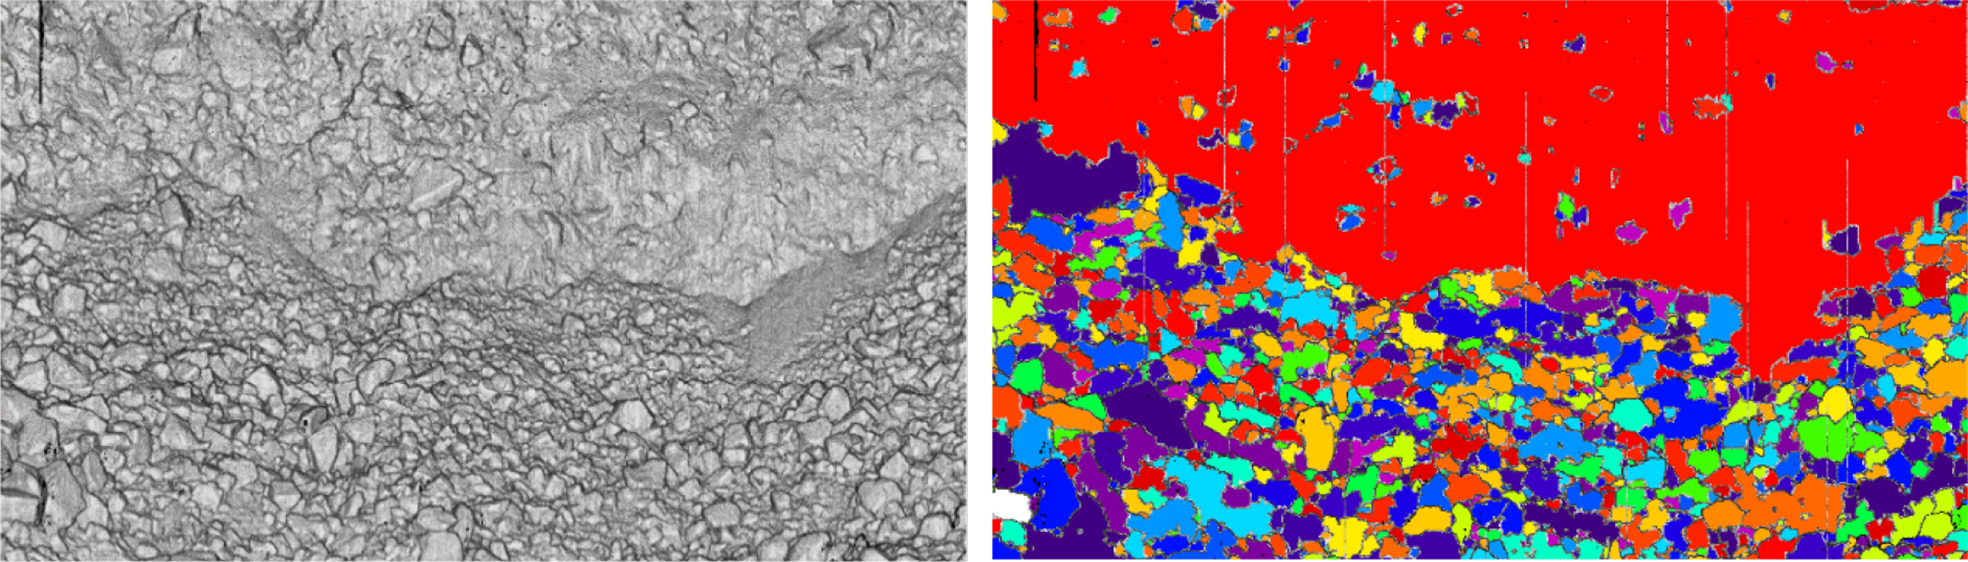
Figure 6 shows the raw data; this is processed to produce the orthogonal projection shown in Fig. 7. Figure 8 shows the automatic classification result for regions identified as areas of fines. Figure 9 shows the automatic particle delineation for Fig. 7, with a magnified area of the delineation shown in Fig. 10.
Orthogonal projection of muckpile laser scan
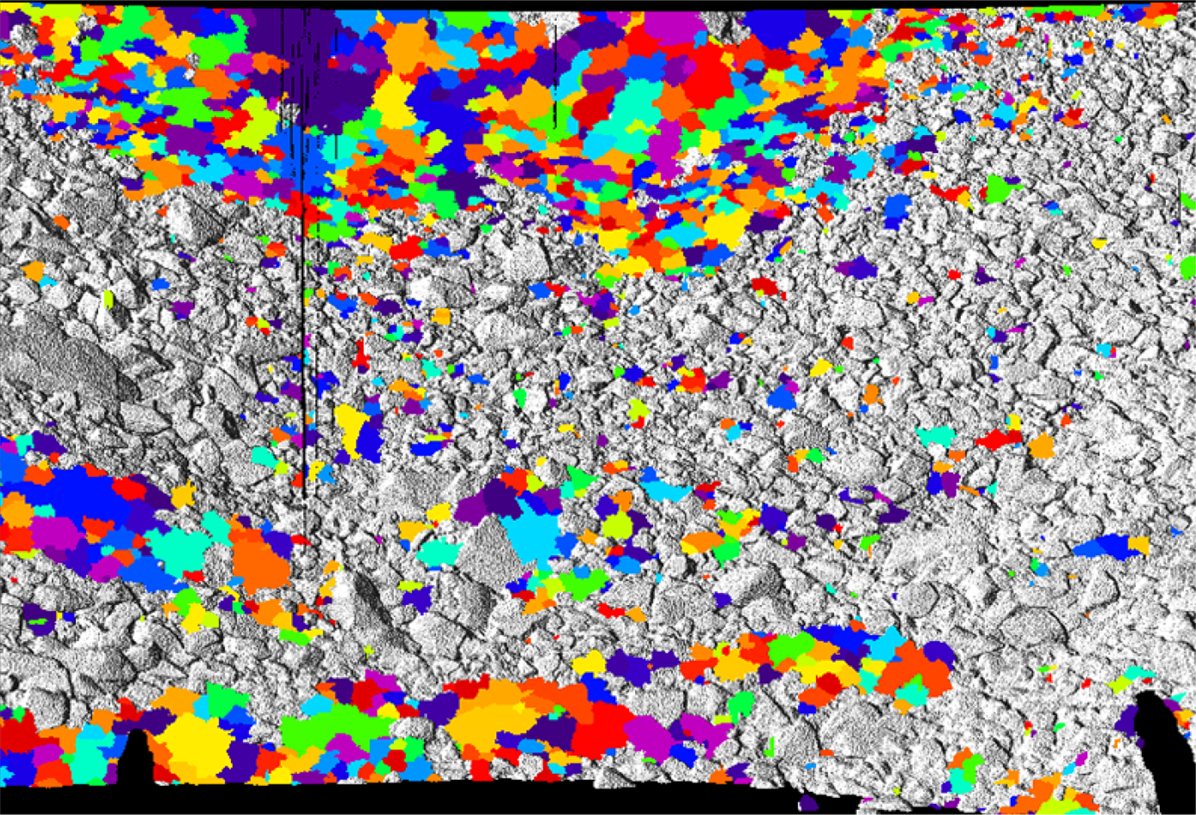
Automatically identified areas of fines (shown in colour)
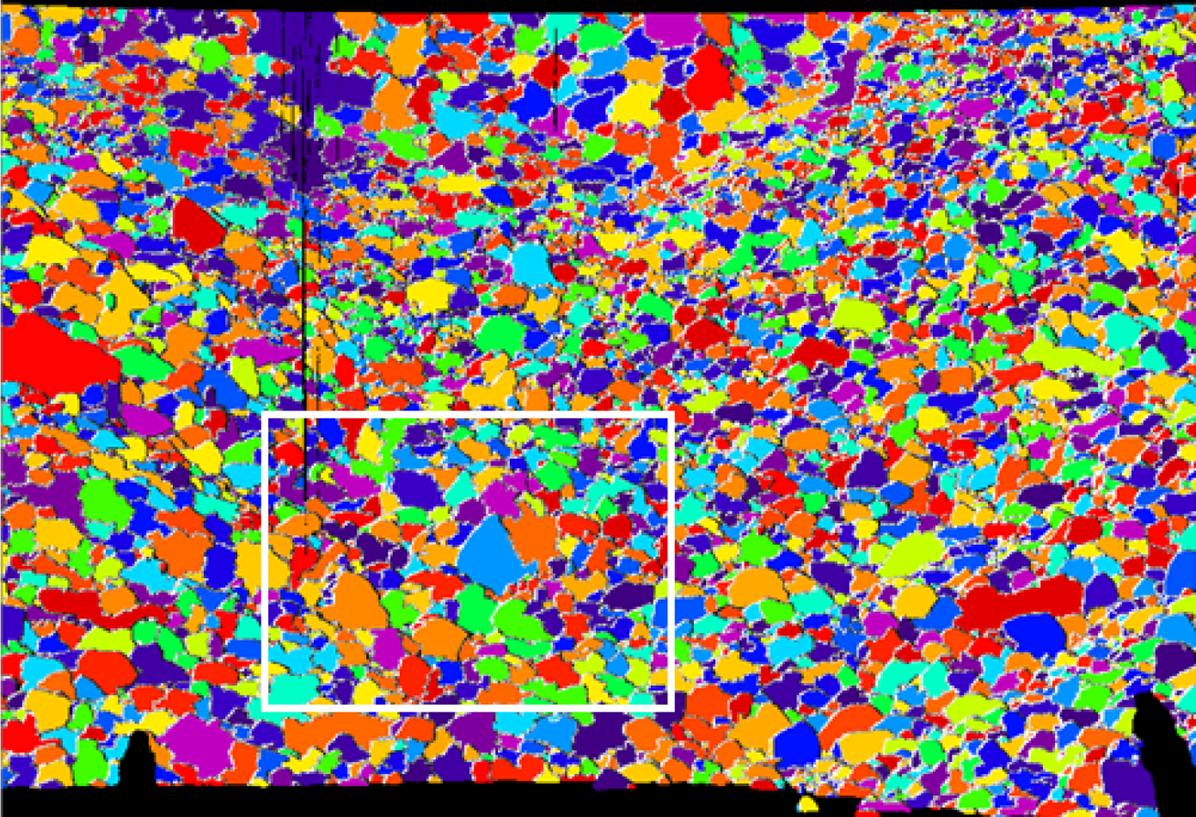
Automatic particle delineation (white box region shown in Fig. 10)
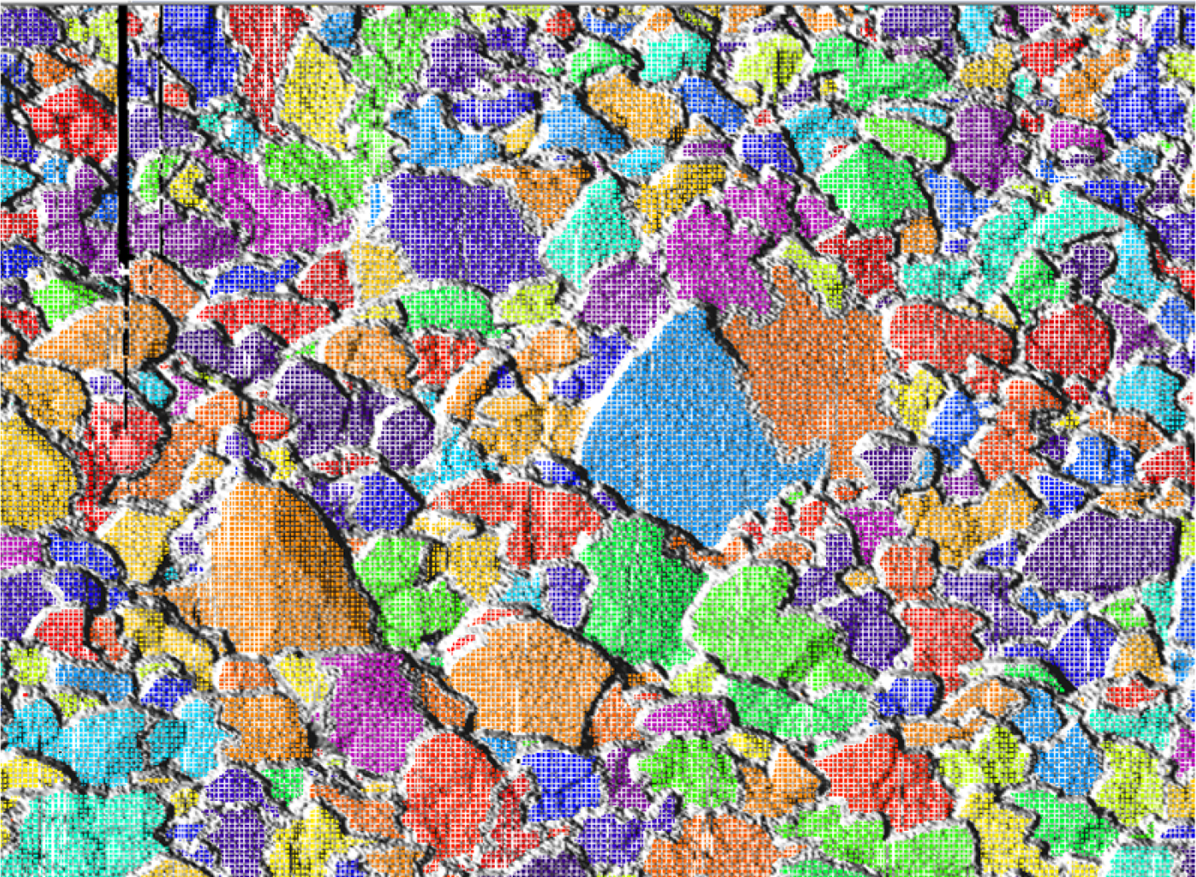
Magnified delineation area for the white box shown in Fig. 9
Blast fragmentation measurements
As discussed earlier, two comprehensive blast performance monitoring campaigns were conducted at Esperanza mine. The first was carried out during January to March 2013, and the second campaign was conducted during the months of October and November 2013.
The images shown in this paper are based on orthogonally re-projected 3D data. This means that the rocks in the images at the front of the data look larger than they are in reality. This ‘re-projection’ is part of the analysis strategy, but it does not affect the sizing in any way, as the data are projected back to the real perspective view before sizing.
Results
Overall results have shown the ability of the algorithms to reliably process high-resolution 3D laser scanning data. Fully automated results (i.e. no manual editing) were obtained for the close range datasets.
The analysis showed that if the measurements were taken too far away from the muckpile, then the resolution of the data was lower and the algorithms could not identify the areas of fines. These areas of fines were predominately large areas of compressed fines at the top of the muckpile (as shown in Fig. 11). Therefore, these large areas were manually identified in the 3D data before performing particle delineation.
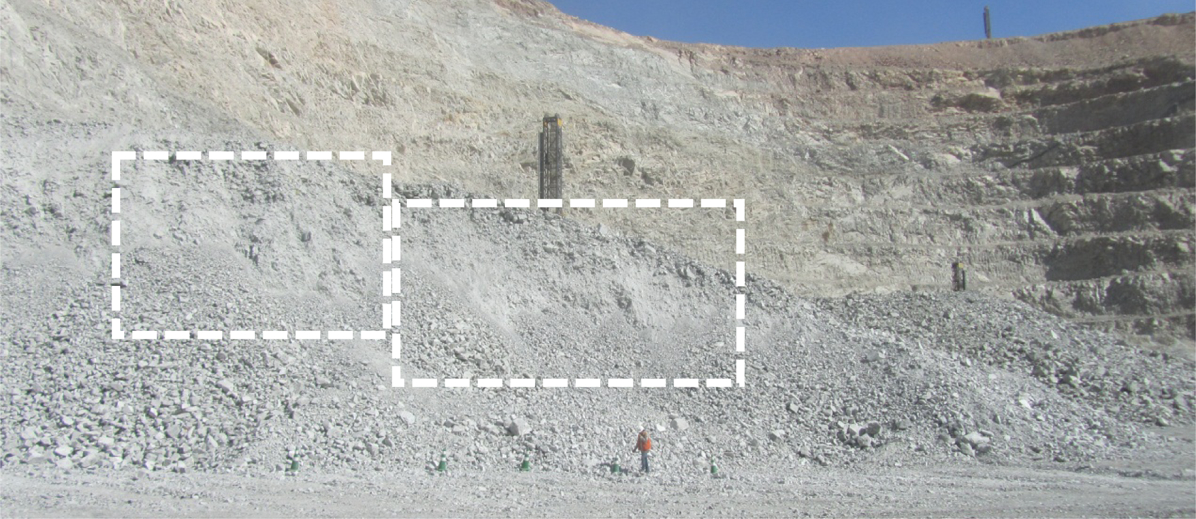
Muckpile showing compressed fines in the upper regions
A review of the data collected showed that in some instances, the pre-defined and recommended data collection procedures outlined in the Measurement hardware section were not followed. Furthermore, some of these datasets in the second campaign were corrupted with distorted, warped, or missing data as a result of some error with the sensor or sensor operation and these were manually removed.
A key lesson from the measurement trials is the need to ensure consistent and correct operation of the laser scanner to ensure consistent data quality measured in the expected field of view and range of 8–10 m from the toe of the muckpile. If the rock piles are imaged in this way, then fully automatic image analysis of every measurement set can be performed.
Using the higher resolution data, automatic delineation of the areas of fines was achieved. An example of this is illustrated in the automated delineation shown in Fig. 12. Work is continuing in order to improve the reliability of automated algorithms to delineate regions of compressed fines, but early indications show that by measuring from close range with the expected field of view and appropriate high-resolution settings, automated image analysis will produce meaningful particle delineations and consistent results.
Example of automatic identification of compressed fines (the large red region across the top of the image)
As a comparison, Onederra et al. (2010) performed a larger blast fragmentation assessment using 2D photographic imaging in 2010. Considering Blast ID 3724-10 in Table 3 of that study (Onederra et al., 2010), the authors note that scaling objects (long blue pipes with white balls) were placed on the muckpile, a total of 46 times at different stages of excavation. In each case, three sample photographs were taken so that each photo contained at least two of these white balls, resulting in a total of 138 photographs of the muckpile. Figure 13 shows an illustration of 16 instances of the scaling objects on the partly excavated muckpile evaluated by Onederra et al. (2010), and Fig. 14 shows the scaling objects in two of the sample images taken.
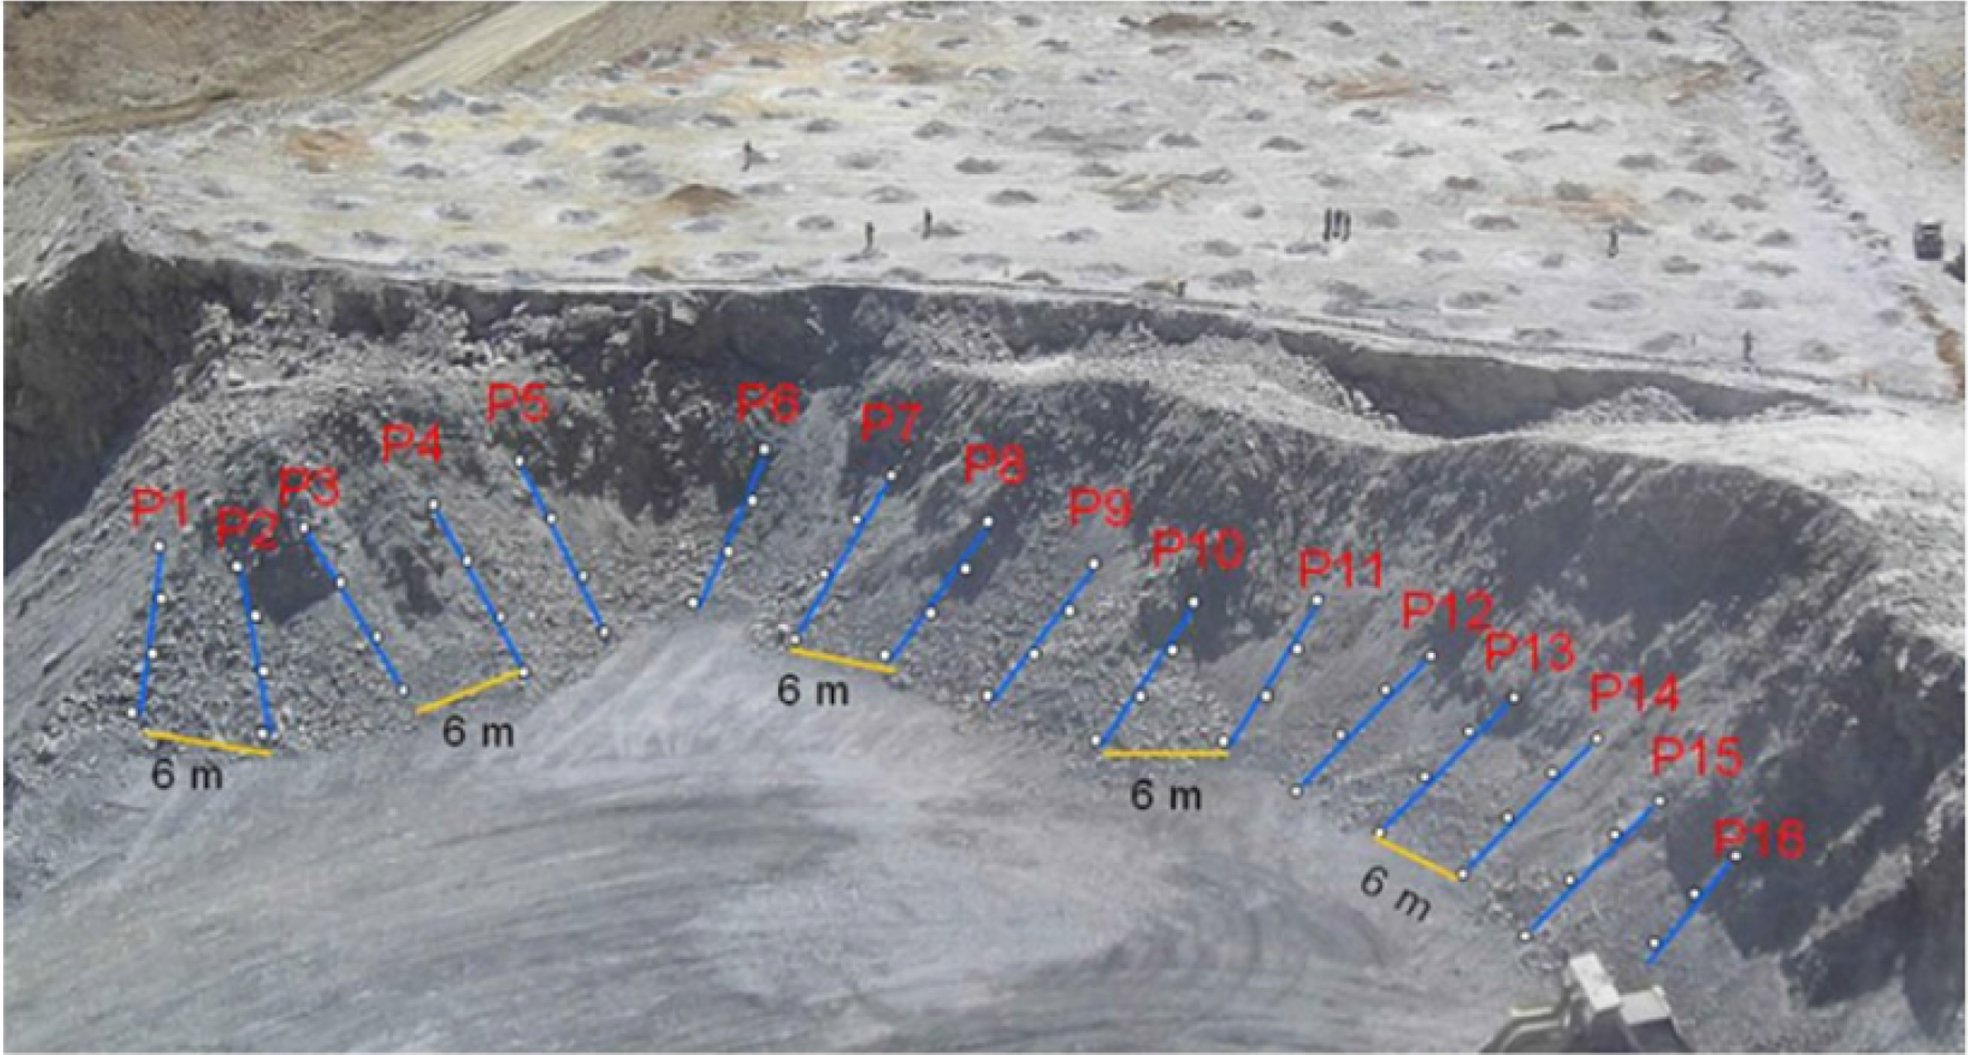
Sixteen scaling object profiles on the muckpile (Onederra et al., 2010)
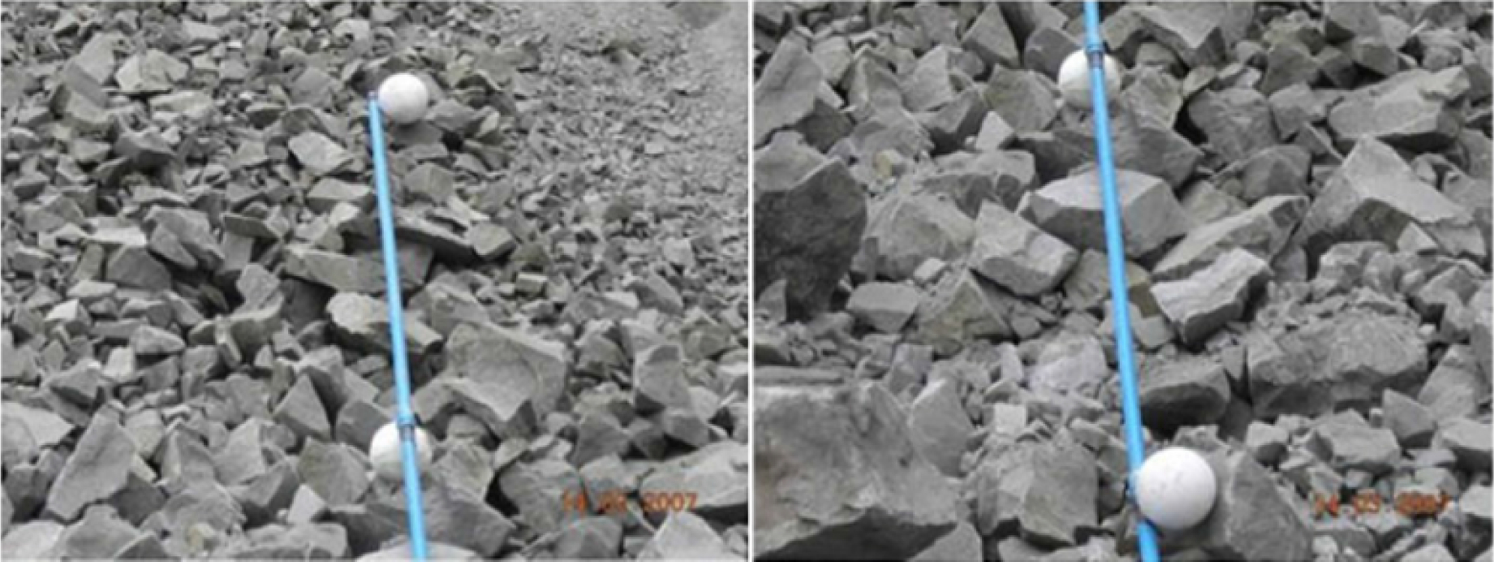
Two sample images each containing two white ball scaling objects (Onederra et al., 2010)
With the close range high-resolution scans outlined in this paper, less activity can be performed at the muckpile. In the Measurement geometry section, Fig. 5 was detailed and set A was presented with a horizontal (x axis) extent of 9 m, vertical (y axis) extent of 7 m and a depth of 15 m. From this geometry, the distance along the muckpile slope can be estimated, and in this is case, it is slightly over 16 m. The blue pole scaling objects in Fig. 13 were 12 m long. Therefore, set A covers an area wider and further up the muckpile slope than the area photographed around one of the blue poles. Based on the dimensions shown in Fig. 13, approximately 10 laser scans could cover the same area. Therefore, a total of 30 measurements could replace the 138 photographs obtained by Onederra et al. (2010) with no requirement for scaling objects and the added benefit of automated image analysis.
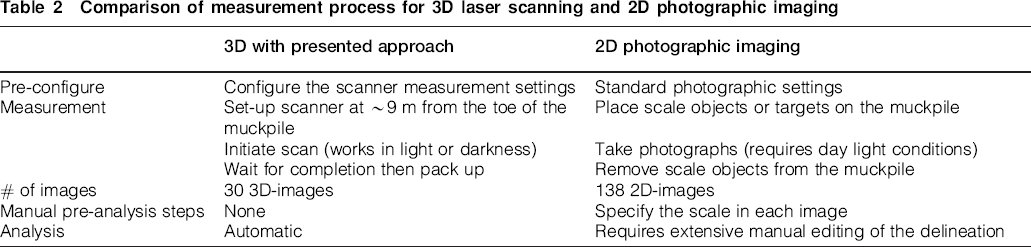
Table 2 provides a summary of tasks to compare fragmentation measurement based on the close range 3D data and the equivalent task using 2D photographic imaging performed by Onederra et al. (2010).
Comparison of measurement process for 3D laser scanning and 2D photographic imaging
An overall comparison of fragmentation measurements taken during the first campaign (January to March) is given in Fig. 15. This analysis provides a representation of the ROM fragmentation outcomes from production blasting in the first campaign (from January to March 2013). The average powder factor from these production blasts was of the order of 480 g/t.
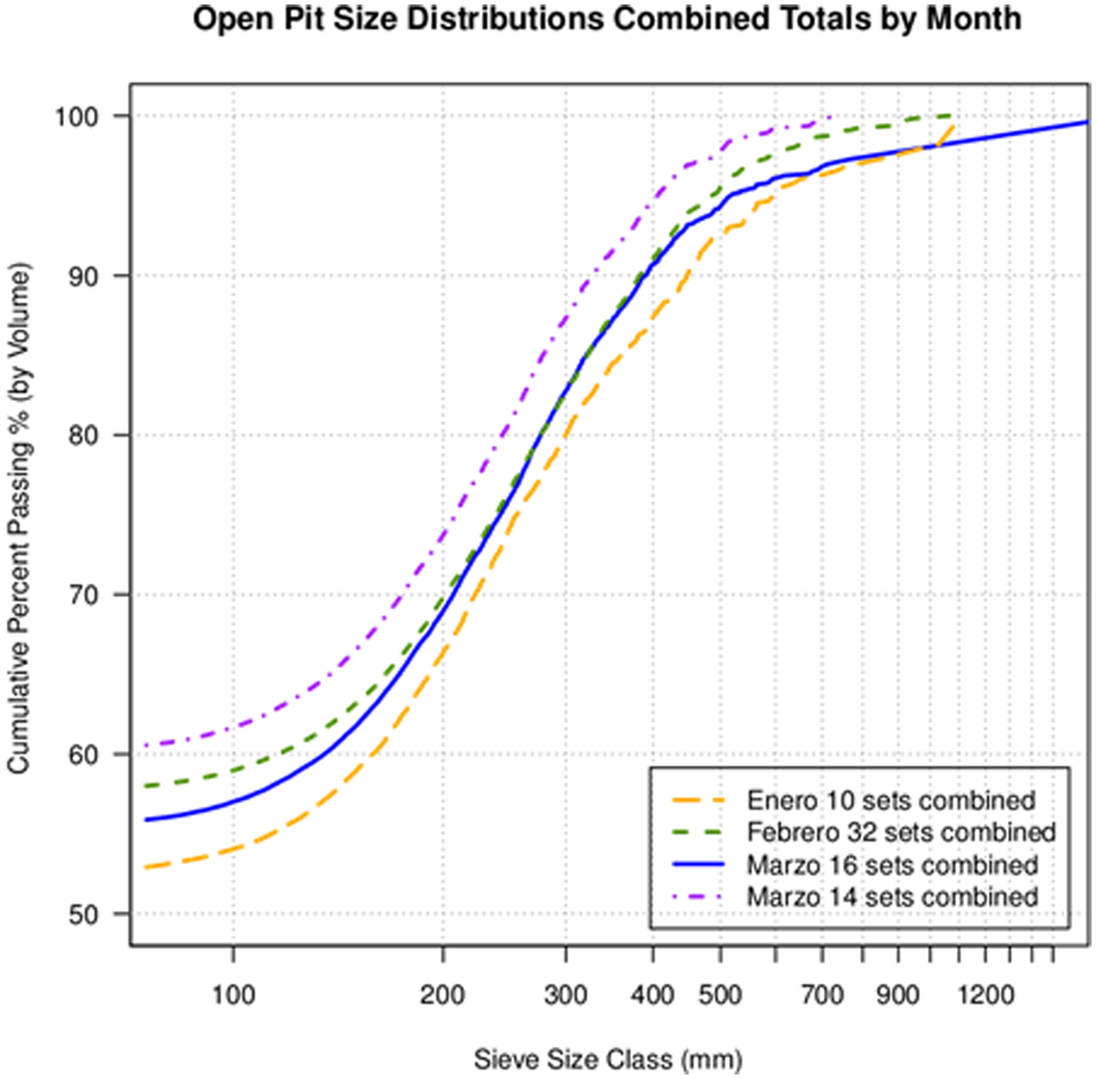
Combined fragmentation results for laser scans taken during the January–March Campaign
As shown in Fig. 15, direct measurements of fragmentation show that fines ranged from 53 to 61%; top sizes (99% passing fraction) range between 700 and 1800 mm and 80% passing fraction (P80) was of the order of 250–300 mm. The Marzo 14 curve is a subset of the Marzo 16 curve in Fig. 15 and shows the result of combined datasets with two scans removed that each contained a single large boulder that was biassing the overall size distribution curve.
One of the key requirements of mineral processing personnel at Esperanza mine was the ability to estimate the per cent passing below 32 mm (11/4″) from the ROM fragmentation. Previous survey data suggested that the grinding stage performed at close to optimal levels when fines (i.e. 32 mm) were above 40%.
It was clear from the analysis that the detection of particles below 32 mm (11/4″) was mathematically possible but the output from the process algorithms was not reliable at this smaller size, this was mainly because of the limitations on the scanning resolution and scan distances. However, as shown in Fig. 16, estimates could be made of the expected% passing fraction below 32 mm. The estimated range was based on a lower and upper bound extrapolation in the log-linear space. After combining all the available data, the simple extrapolation showed that the per cent passing below 32 mm was most likely in the range of 50–58%. This was consistent with observations recorded by mine personnel.
Estimate of expected range of fines below 32 mm
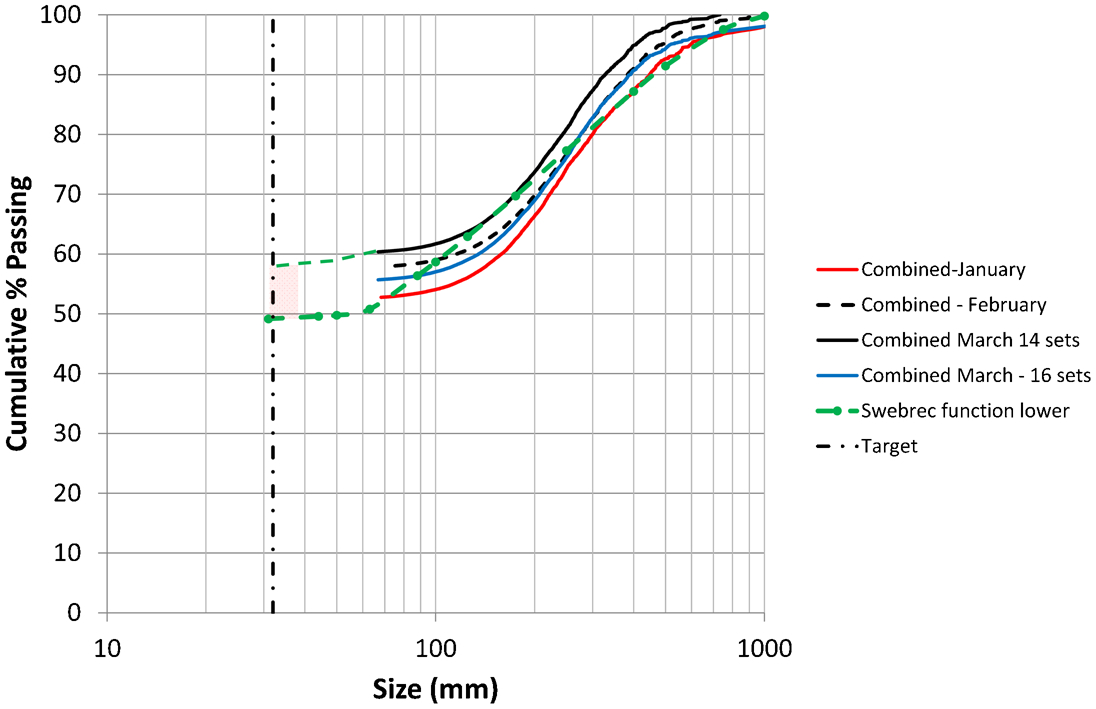
During the second campaign, which took place in October–November 2013, laser scan datasets were analysed separately for the first two production blasts. The average powder factor for these two blasts was 350 g/t. Figure 17 shows the combined fragmentation output from the laser scanning analysis of these two blasts. In general, the analysis indicated that the estimated per cent passing below 32 mm, based on a lower and upper bound extrapolation was in the range of 49–59%. The estimated top sizes (99% passing fraction) ranged between 840 and 1300 mm with the 80% passing fraction (P80) for both blasts being of the order of 300 mm. Images of muckpiles taken immediately after the blasts are shown in Fig. 18.
Combined output of datasets from blasts with an average powder factor of 350 g/t
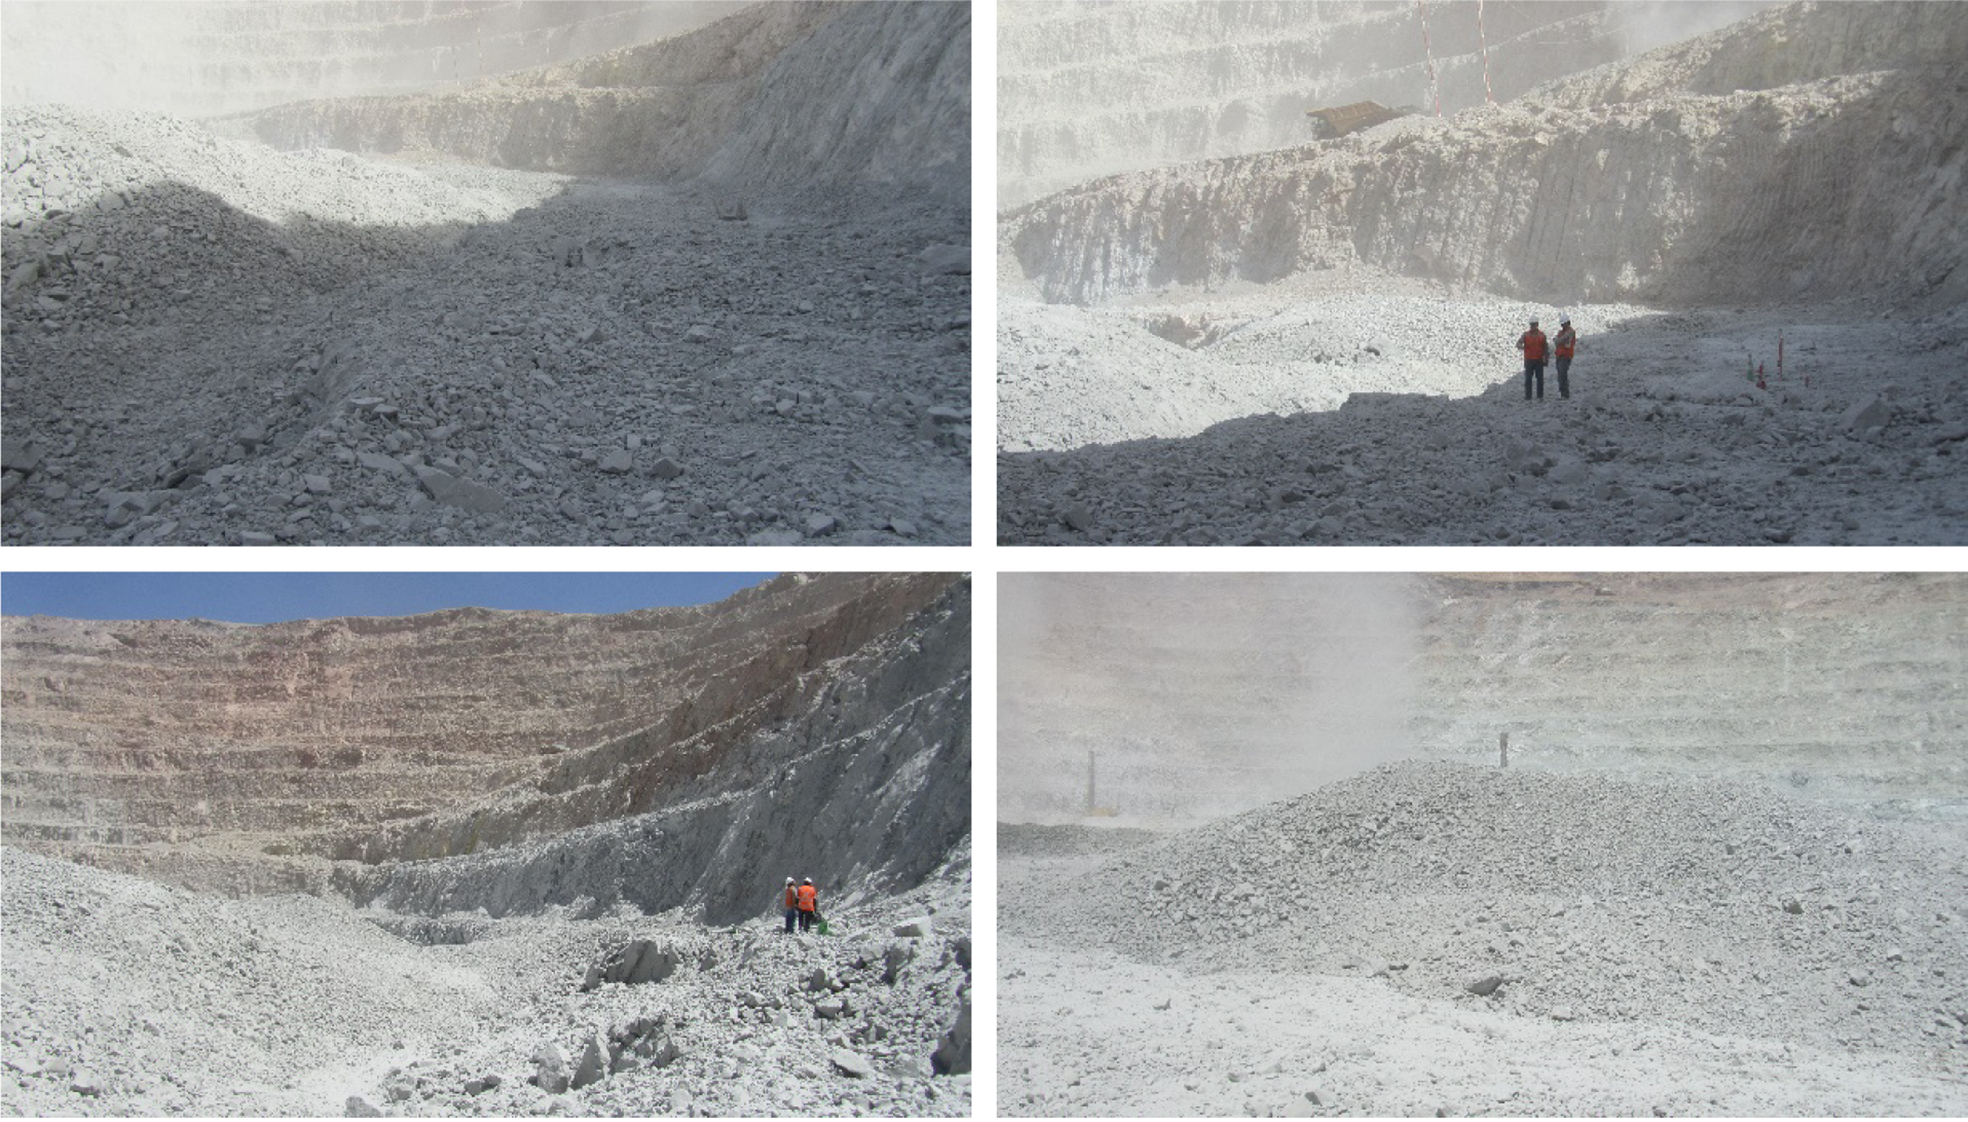
Typical muckpile photographs for two blasts from the second campaign
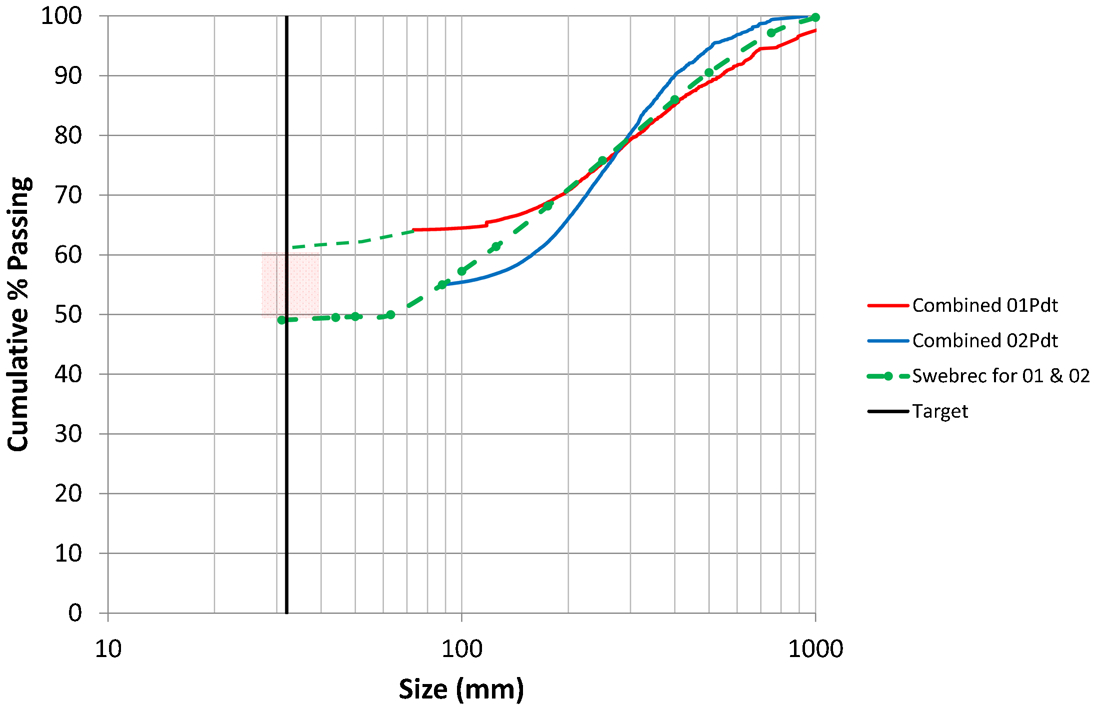
A marked difference and somewhat unexpected coarser fragmentation output was found after analysing the dataset of a third blast in this second campaign. This was attributed to marked changes in geological conditions and some deficiencies found in the data collection process, which affected sampling. Figure 19 gives the output corresponding to the laser scanning analysis of the third dataset relative to the more consistent sampling taken from the first two blasts in this domain. This output shows the ability of the process algorithms to automatically identify relative changes in fragmentation outcomes.
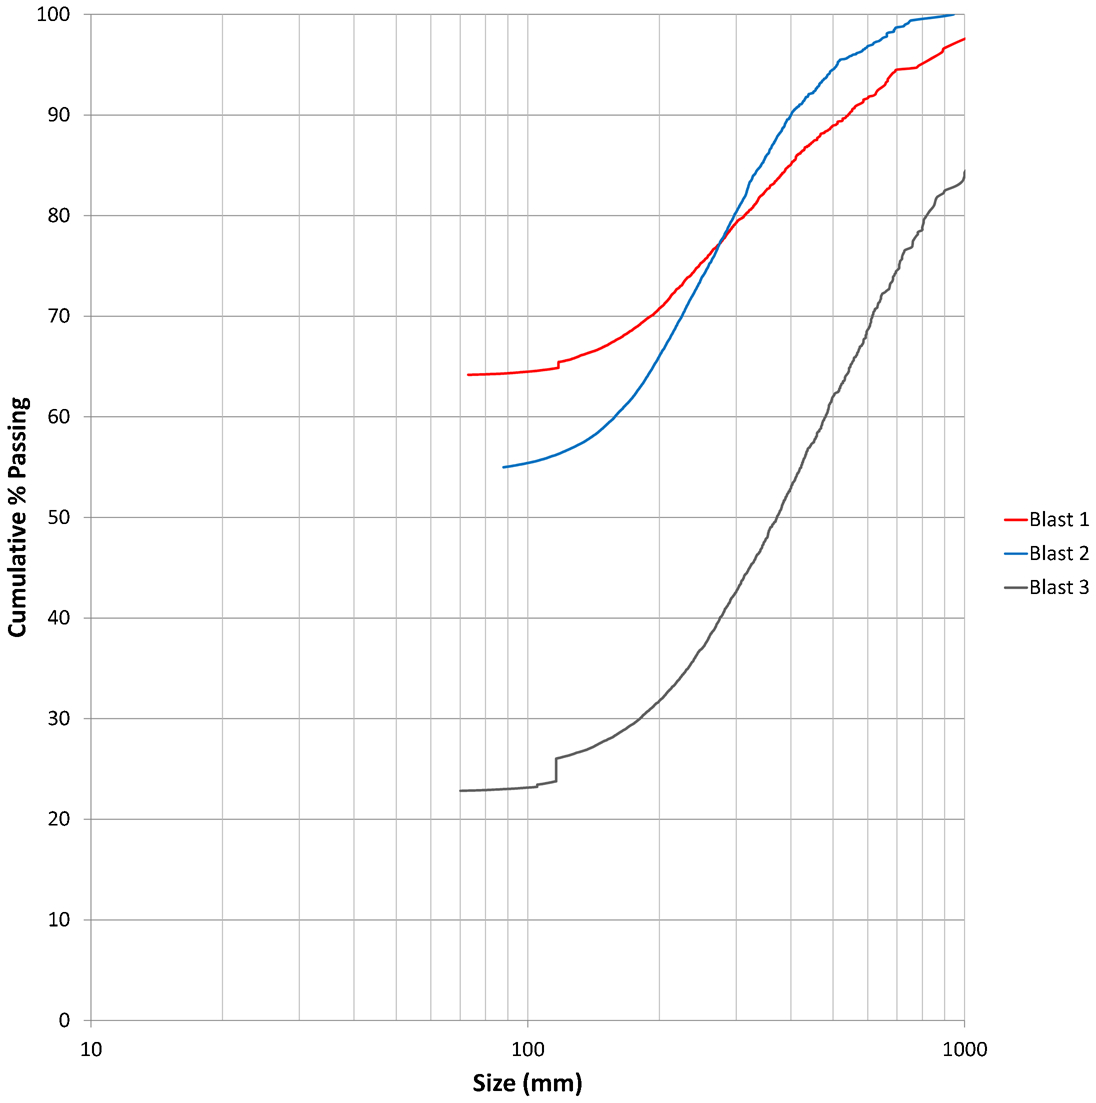
Fragmentation output from all three blasts in the second campaign. Note coarser fragmentation outcome from blast 3
As with the previous campaign and regardless of the potential bias, all datasets were combined to obtain overall fragmentation results corresponding to three production blasts with an average powder factor of 360 g/t. The combined curve is given in Fig. 20. The output from this analysis indicated that the estimated% passing below 32 mm would be approximately 42%. The estimated top size (99% passing fraction) was of the order of 1690 mm and the 80% passing fraction (P80) of the order of 450 mm.
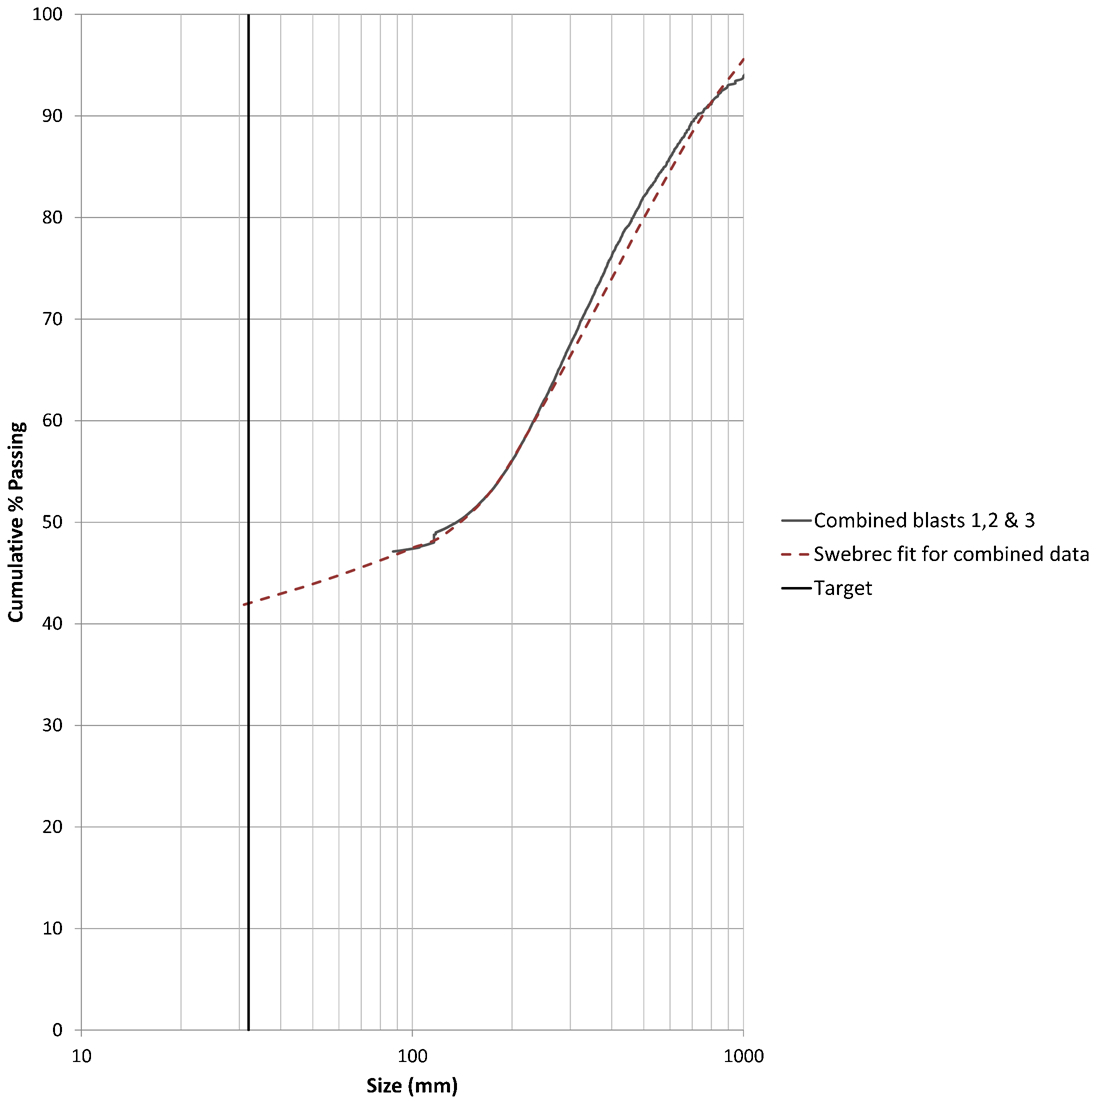
Combined datasets representing run of mine (ROM) fragmentation from the second campaign
Conclusions and future work
A new technique was adopted at Esperanza mine to measure ROM fragmentation. This involved high-resolution laser scanning of muckpiles, together with the application of improved detection and delineation algorithms. This technique addressed many of the shortcomings of 2D image-based systems currently used in industry. Part of the implementation process involved site-specific data collection procedures with the use of the I-site Maptek laser scanner available at Esperanza mine.
Fully automated analysis of the 3D data was possible in all cases where the data were of sufficiently high resolution (collected from approx. 9 m from the toe of the muckpile). Manual pre-processing was required when the data was of low resolution (measured from too far away) in order to specify the region of fines, or was damaged (corrupted) during the collection process.
Laser scanning data were collected over a period of 3 months in the first campaign, which corresponded to blasts with an average powder factor of 480 g/t. The detection of particles below 32 mm (11/4″) was mathematically possible but the output from the process algorithms was not reliable at this smaller size, mainly because of the limitations on the scanning resolution. By applying a lower and upper bound extrapolation in the log-linear space, the combined analysis from this monitoring campaign showed that the expected per cent passing fraction below 32 mm was in the range of 50–58%; top sizes (99% passing fraction) ranged between 700 and 1800 mm; and the 80% passing fraction (P80) was of the order of 250–300 mm.
In the second monitoring campaign, laser scanning data were collected across blasts with an average powder factor of 360 g/t. It was evident that the first two blasts approached conditions similar to those measured during the first monitoring campaign with a notable reduction in powder factor. The combined fragmentation output of these two blasts indicated that the estimated% passing below 32 mm was in the range of 49–59%. The estimated top size (99% passing fraction) ranged between 840 and 1300 mm with the 80% passing fraction (P80) for both blasts being of the order of 300 mm.
An unexpected coarser fragmentation output was found after analysing datasets from a third blast, which was conducted in a different domain. The combined curve for all the three blasts monitored in the second campaign indicated that the estimated% passing below 32 mm was approximately 42%. The estimated top size (99% passing fraction) was of the order of 1690 mm and the 80% passing fraction (P80) approximately 450 mm.
Table 3 provides a summary of key fragmentation indicators from this monitoring campaign. Overall results indicated that ROM fragmentation requirements were consistently meeting specified targets, despite the differences in powder factors. This was the case for those blasts conducted in similar blasting domains. The identified bias from the third blast in campaign two is clear in the coarse end statistics showing a marked increase in P80 and top size.
Size distribution results
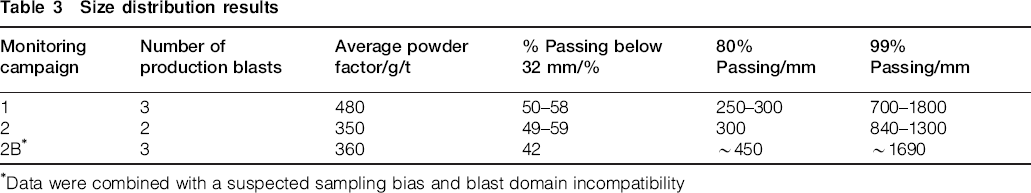
Data were combined with a suspected sampling bias and blast domain incompatibility
This work has demonstrated that high-resolution laser scanning can be used as an alternative technique to measure ‘whole of muckpile’ ROM fragmentation in production blasting. Although limitations were found with the quantification of compressed fines, relative comparisons were possible. Current limitations are being addressed by defining procedures that involve estimating fines with measurements taken from both the source muckpile and the primary crusher product. This procedure will use proven and commercially available laser-based measurement systems and material tracking devices.
Data collection procedures may vary depending on accessibility and site conditions. Further work is required to standardise data collection procedures to improve processing speed and output reliability.
Footnotes
Acknowledgement
The authors would like to thank Antofagasta Minerals for allowing the publication of this work. They would also like to acknowledge the support in the data collection process provided by Esperanza mine personnel in particular Ignacio Campos and Patricio Lagos.