
Abstract
A field case study is presented of an underground Canadian mine reporting ore pass problems. The ore pass has significantly degraded where a fault zone was intercepted. A geotechnical site investigation identified four rock mass domains along the ore pass including a fault zone. This information was used to generate a discrete fracture network (DFN) model for the rock mass. A kinematic analysis revealed that structurally controlled failure was not the only failure mechanism for the ore pass. The DFN model was subsequently used to develop 2D synthetic rock masses of the four rock mass domains. This allowed investigation of the influence of impact-induced damage from the transiting material. The maximum impact-induced damage was recorded for the fault zone. The mine adopted the recommendation to install a grizzly at the ore pass collar and cable bolts around the degraded ore pass zone. The recommendations contributed to the structural integrity of the ore pass.
Keywords
Introduction
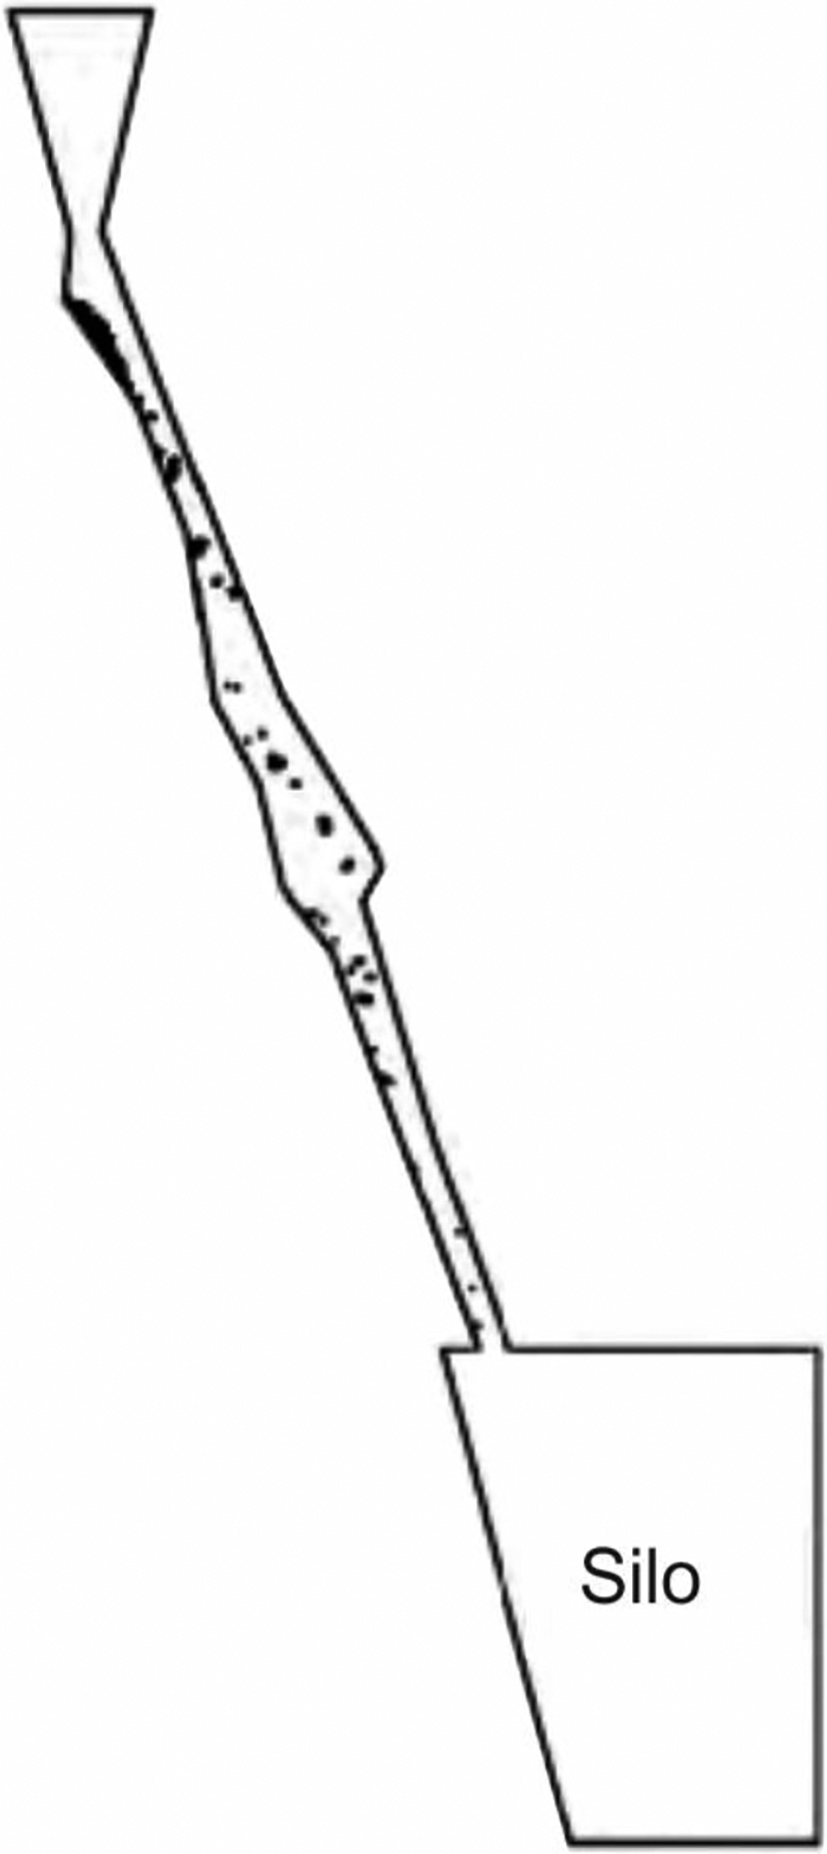
A field case study is presented of an underground Canadian mine reporting significant ore pass problems. The ore pass in question serves as a transfer point with ore dumped from the surface to an underground silo and used to feed an underground crusher (Fig. 1). The ore pass was commissioned in early 2006 as an unsupported raise-bored excavation of 2.4 m diameter. It was 96 m long at a plunge of 70° and a trend of 187° and developed within a peridotite rock mass. A ramp was constructed around the ore pass, with its portal approximately at mid-height of the ore pass, Fig. 1.
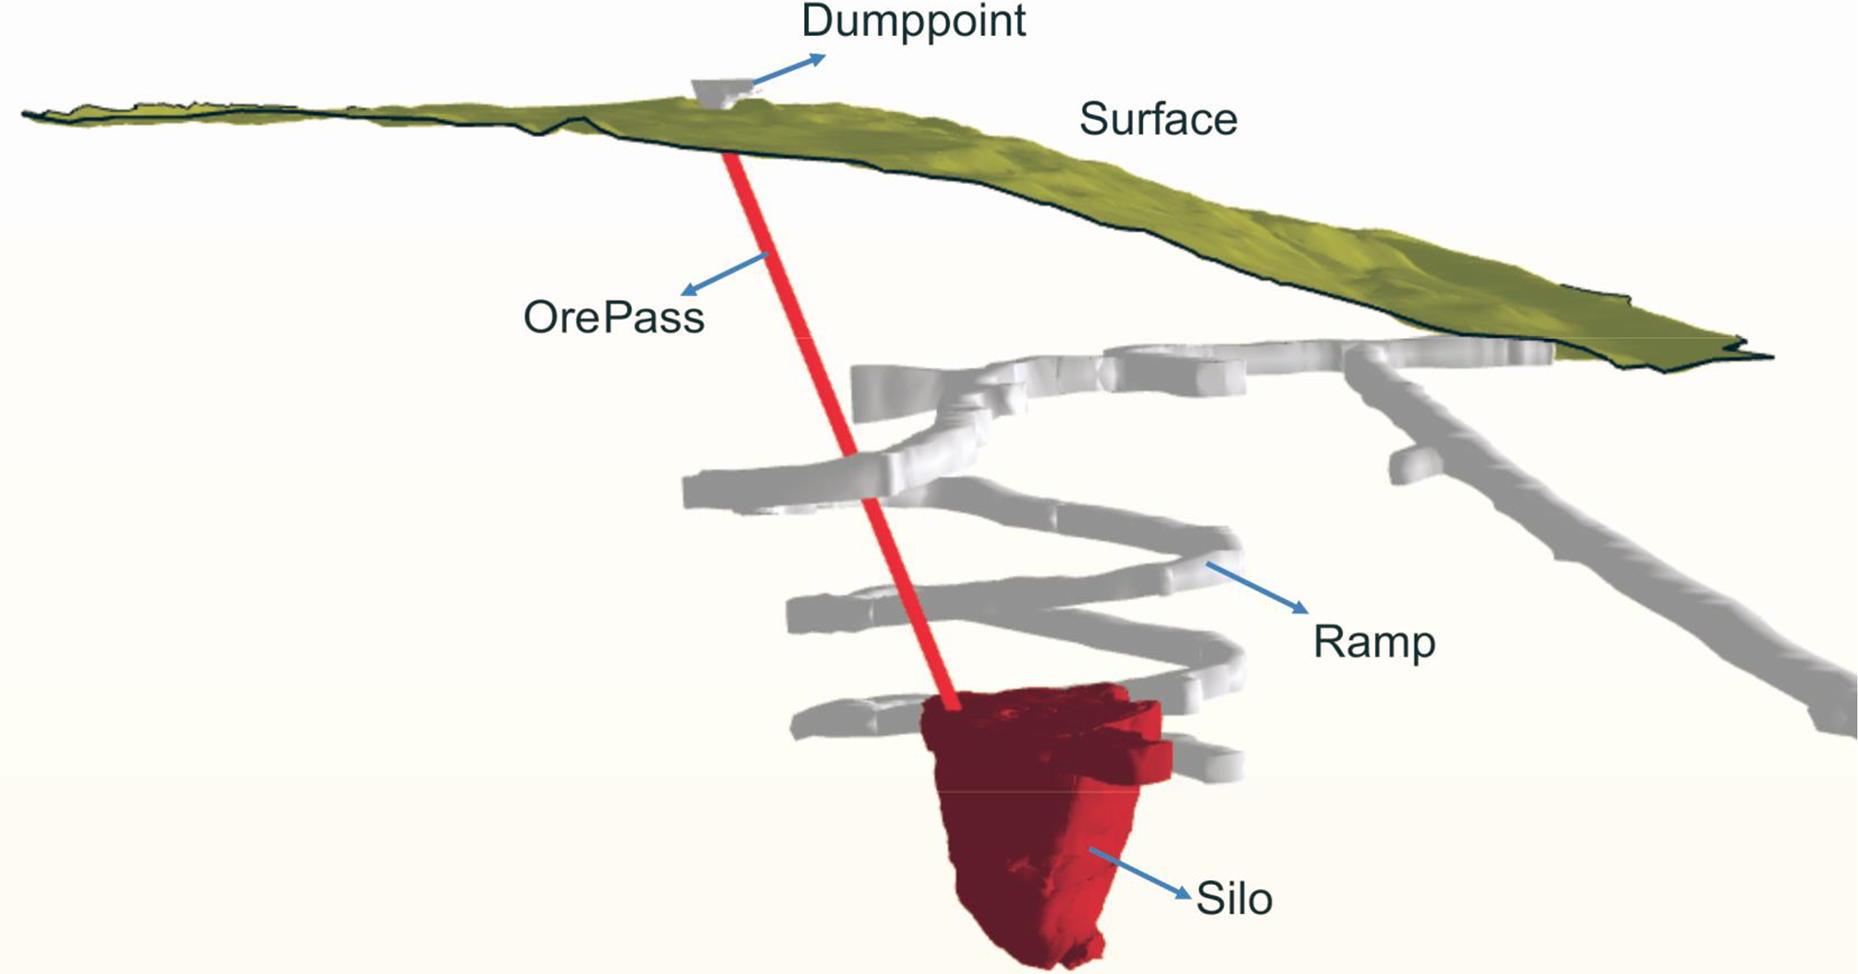
The ore pass and the other mine infrastructures around it
Soon after commissioning of the ore pass, the walls started degrading, resulting in a significant enlargement of its diameter. The extent of the degradation zone was considerably greater where the ore pass intercepted a fault zone. The fault is near horizontal with a dip angle of about 20° and the rock mass was highly fractured. Cavity monitoring surveys (CMS) revealed that the degradation zones around the ore pass were of irregular shape. Around the fault zone intercept, the ore pass has enlarged considerably. The other zone, along the ore pass length, that degraded significantly was located close to the ore pass collar, Fig. 2.
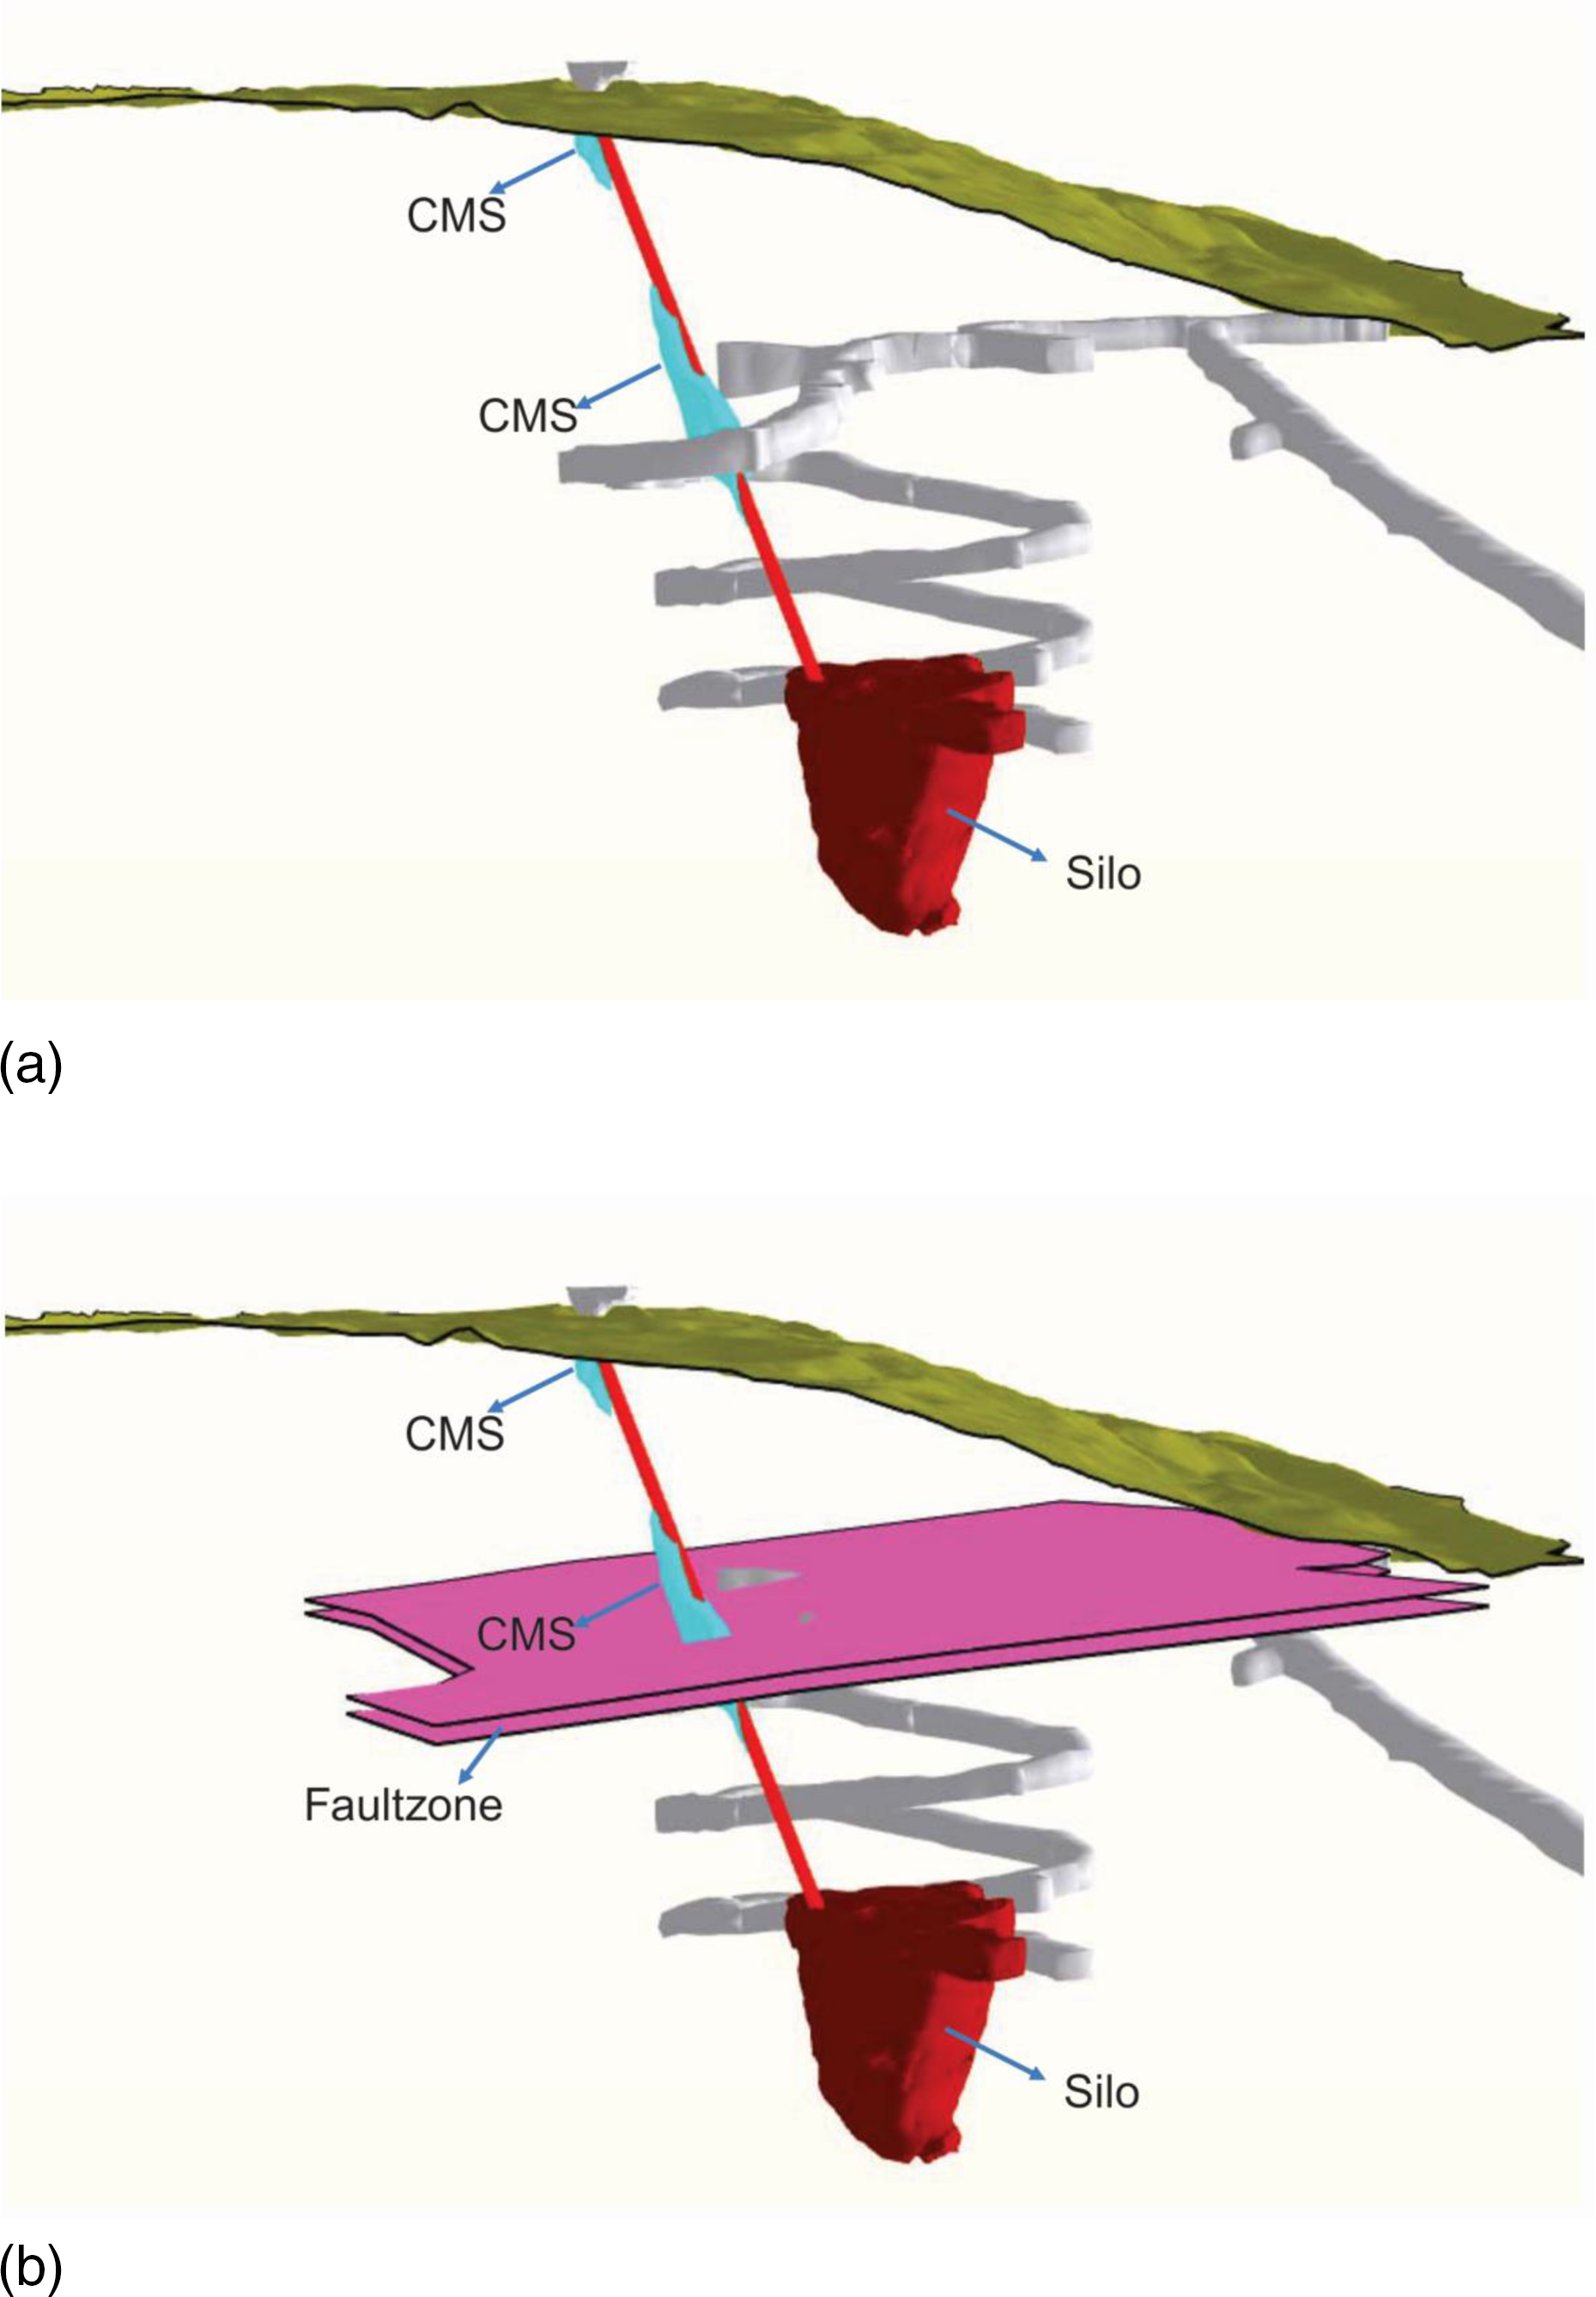
a Configuration of the ore pass with the cavity monitoring surveys (CMS) results showing the degraded zones; b the location and orientation of the fault zone
If an ore pass is constructed in good ground and in the absence of structural defects, it is less likely to have stability problems. Structural defects in the rock, such as bedding planes, faults, dykes and shear zones or geological horizons having of varying strength (such as shale) on the surface of ore pass wall, can result in wall degradation. There are documented case studies of ore pass failures because of the intersection of the ore pass with rock structural defects or low strength strata (Gibbon 1976; Gibbs 1979, Schoombee, du and Van Wyk 1982; Stringer and Lategan 1982, Morrison and Kazakidis 1995; Gardner and Fernandes 2006, Smith, O'Reilly and Langston 2006). Weaker strata degrade more rapidly, which can compromise the original design shape of ore pass and may interrupt the flow of ore. In practice as the weaker parts of the rock mass yield, the load will transfer to surrounding areas in better quality rock.
This paper presents the ground control investigations for the ore pass, and reports on the measures taken to ensure its long-term stability.
Data collection
A geomechanical data collection programme was implemented that included borehole data, underground mapping and laboratory testing.
Geotechnical borehole data
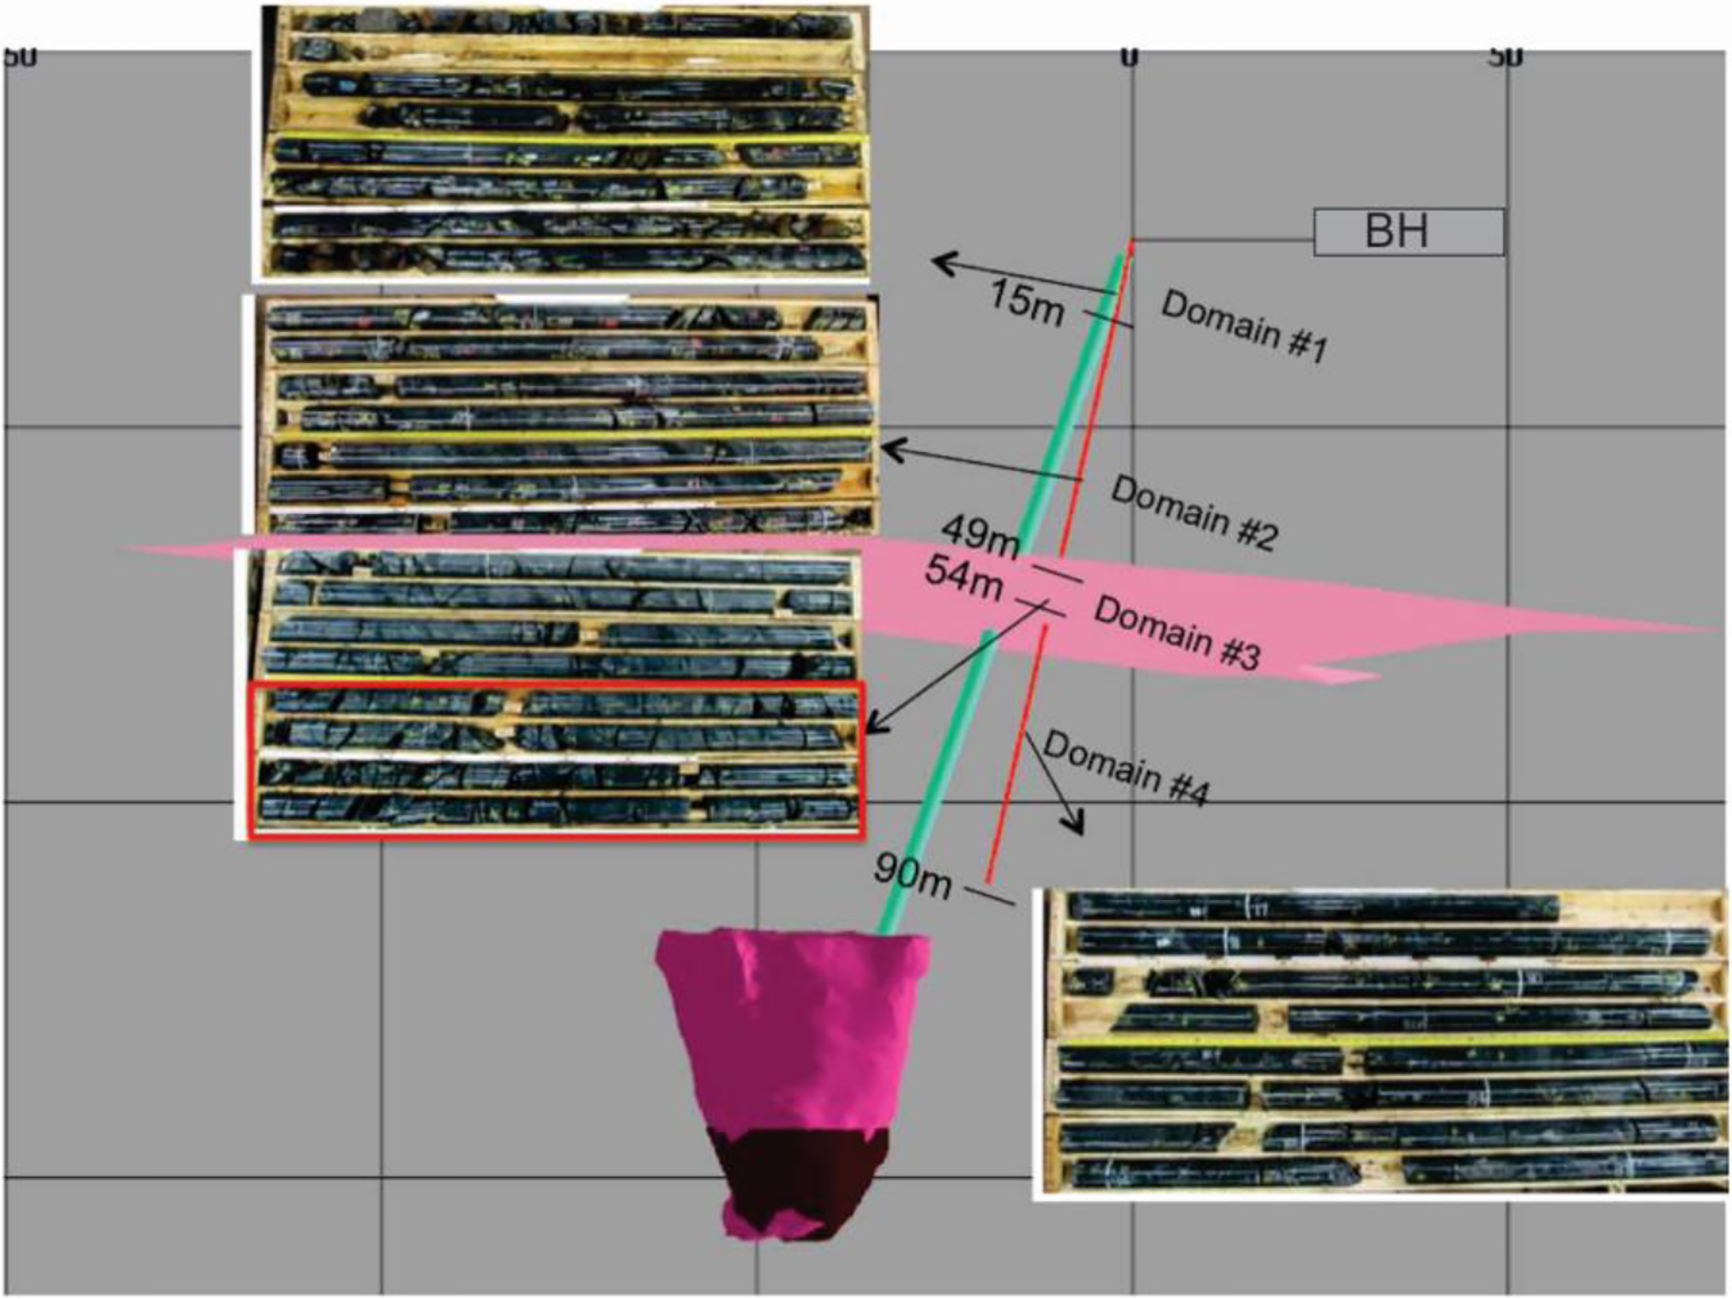
In 2010, a geotechnical borehole was drilled and logged in the vicinity of the ore pass. The borehole was 90.2 m long and oriented near parallel to the ore pass. The first 2.5 m of the borehole was drilled in the overburden. Core samples from the geotechnical borehole were used to characterize the rock mass around the ore pass. It was noted that the borehole intercepted an ultramafic intrusive rock unit consisting of two sequences of peridotite and olivine pyroxenite formations. The rock was described as massive, fine grained and dark grey colour, with moderate pervasive serpentinisation. The rock quality was fair to excellent (50 < RQD < 100) and slightly altered. Some highly fractured zones were encountered at a depth of 13–15.5 m, and from 40 to 45 m. In addition, a fault zone was intercepted at about 49–55 m.
Based on the borehole data, four rock mass domains were identified (Fig. 3):
Domain 1: starts from 2.5 to about 15 m, where the joint surfaces are highly oxidized. Domain 2: extends from 15 to 49 m, the joint surfaces are coated or infilled by clay, calcite or serpentine. Domain 3: extends from 49 to 54 m, the rock mass is highly fractured and fault gauges of less then 30 mm thick have been observed. Domain 4: extends from 54 to 90.2 m, the rock mass is more massive and homogeneous with moderate amount of serpentine joints. Rock mass domains along the geotechnical borehole
Underground mapping
Digital photogrammetry was used for structural mapping. Mapping was undertaken in the drifts and the ramp near the ore pass. The photos were processed to analyse the geometrical characteristics of joints. Figure 4 is a 3D image of the wall and the processed photo used for the joint analysis. Virtual scan-line mapping was performed to construct a 3D image. All joints intersecting the scan-lines were recorded including their orientation, intersection by the scan-line and their trace length on the face of excavation wall. This process enabled the quantification of joint orientation, spacing and trace length.
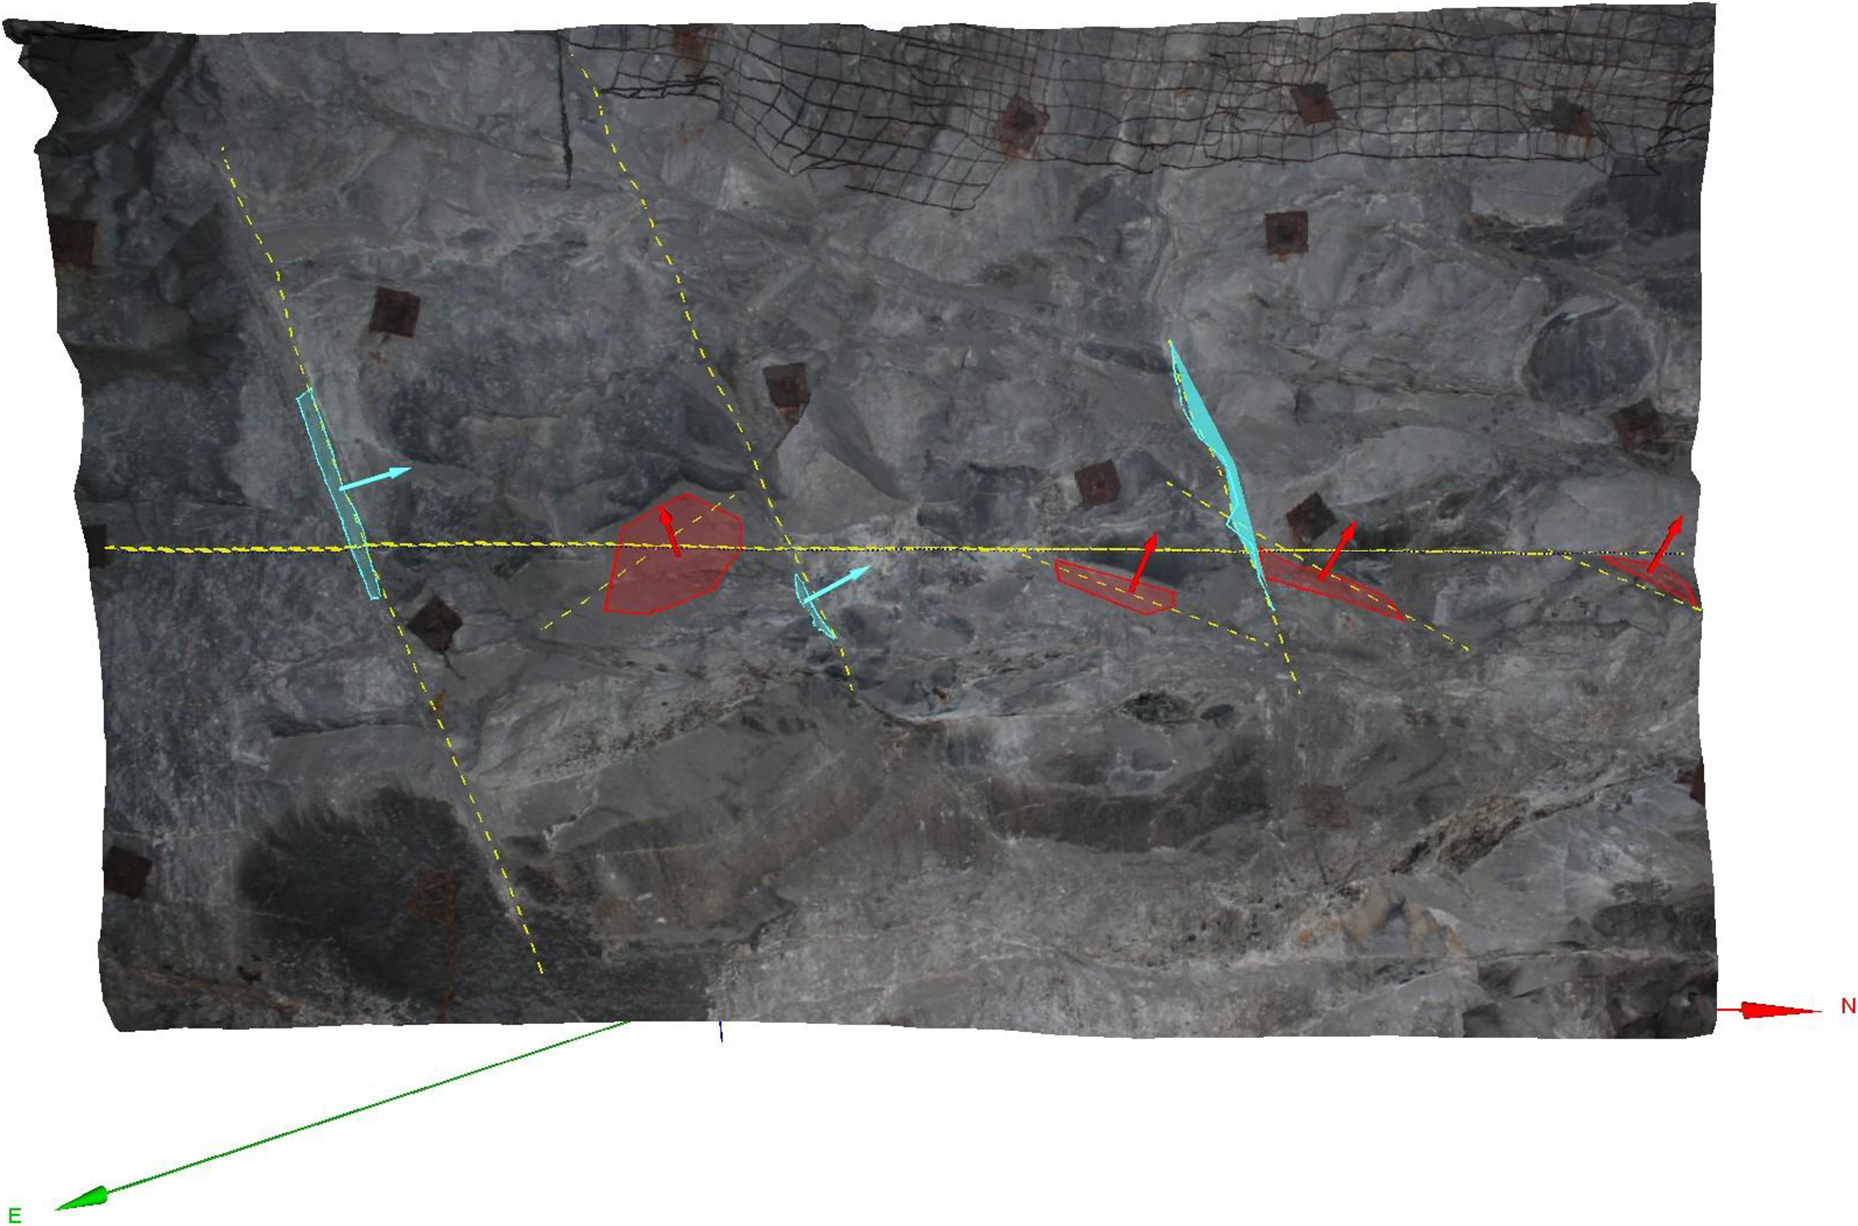
A processed 3D image for underground joint mapping
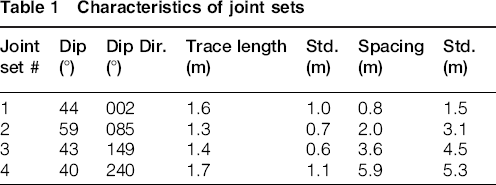
Figure 5 shows stereographic projections of joint data from the inclined geotechnical drillhole and the underground mapping, identifying the major and minor discontinuity sets. In all, 312 structural features were measured along the borehole and 460 by underground mapping. Analysis of the stereographic projections identified four joint sets (three major sets and one minor set), based on both data collection methods. Comparison of the orientation characteristics of the joint sets obtained from the two methods indicates a slight difference in joint set orientation. The joint set characteristics are summarized in Table 1.
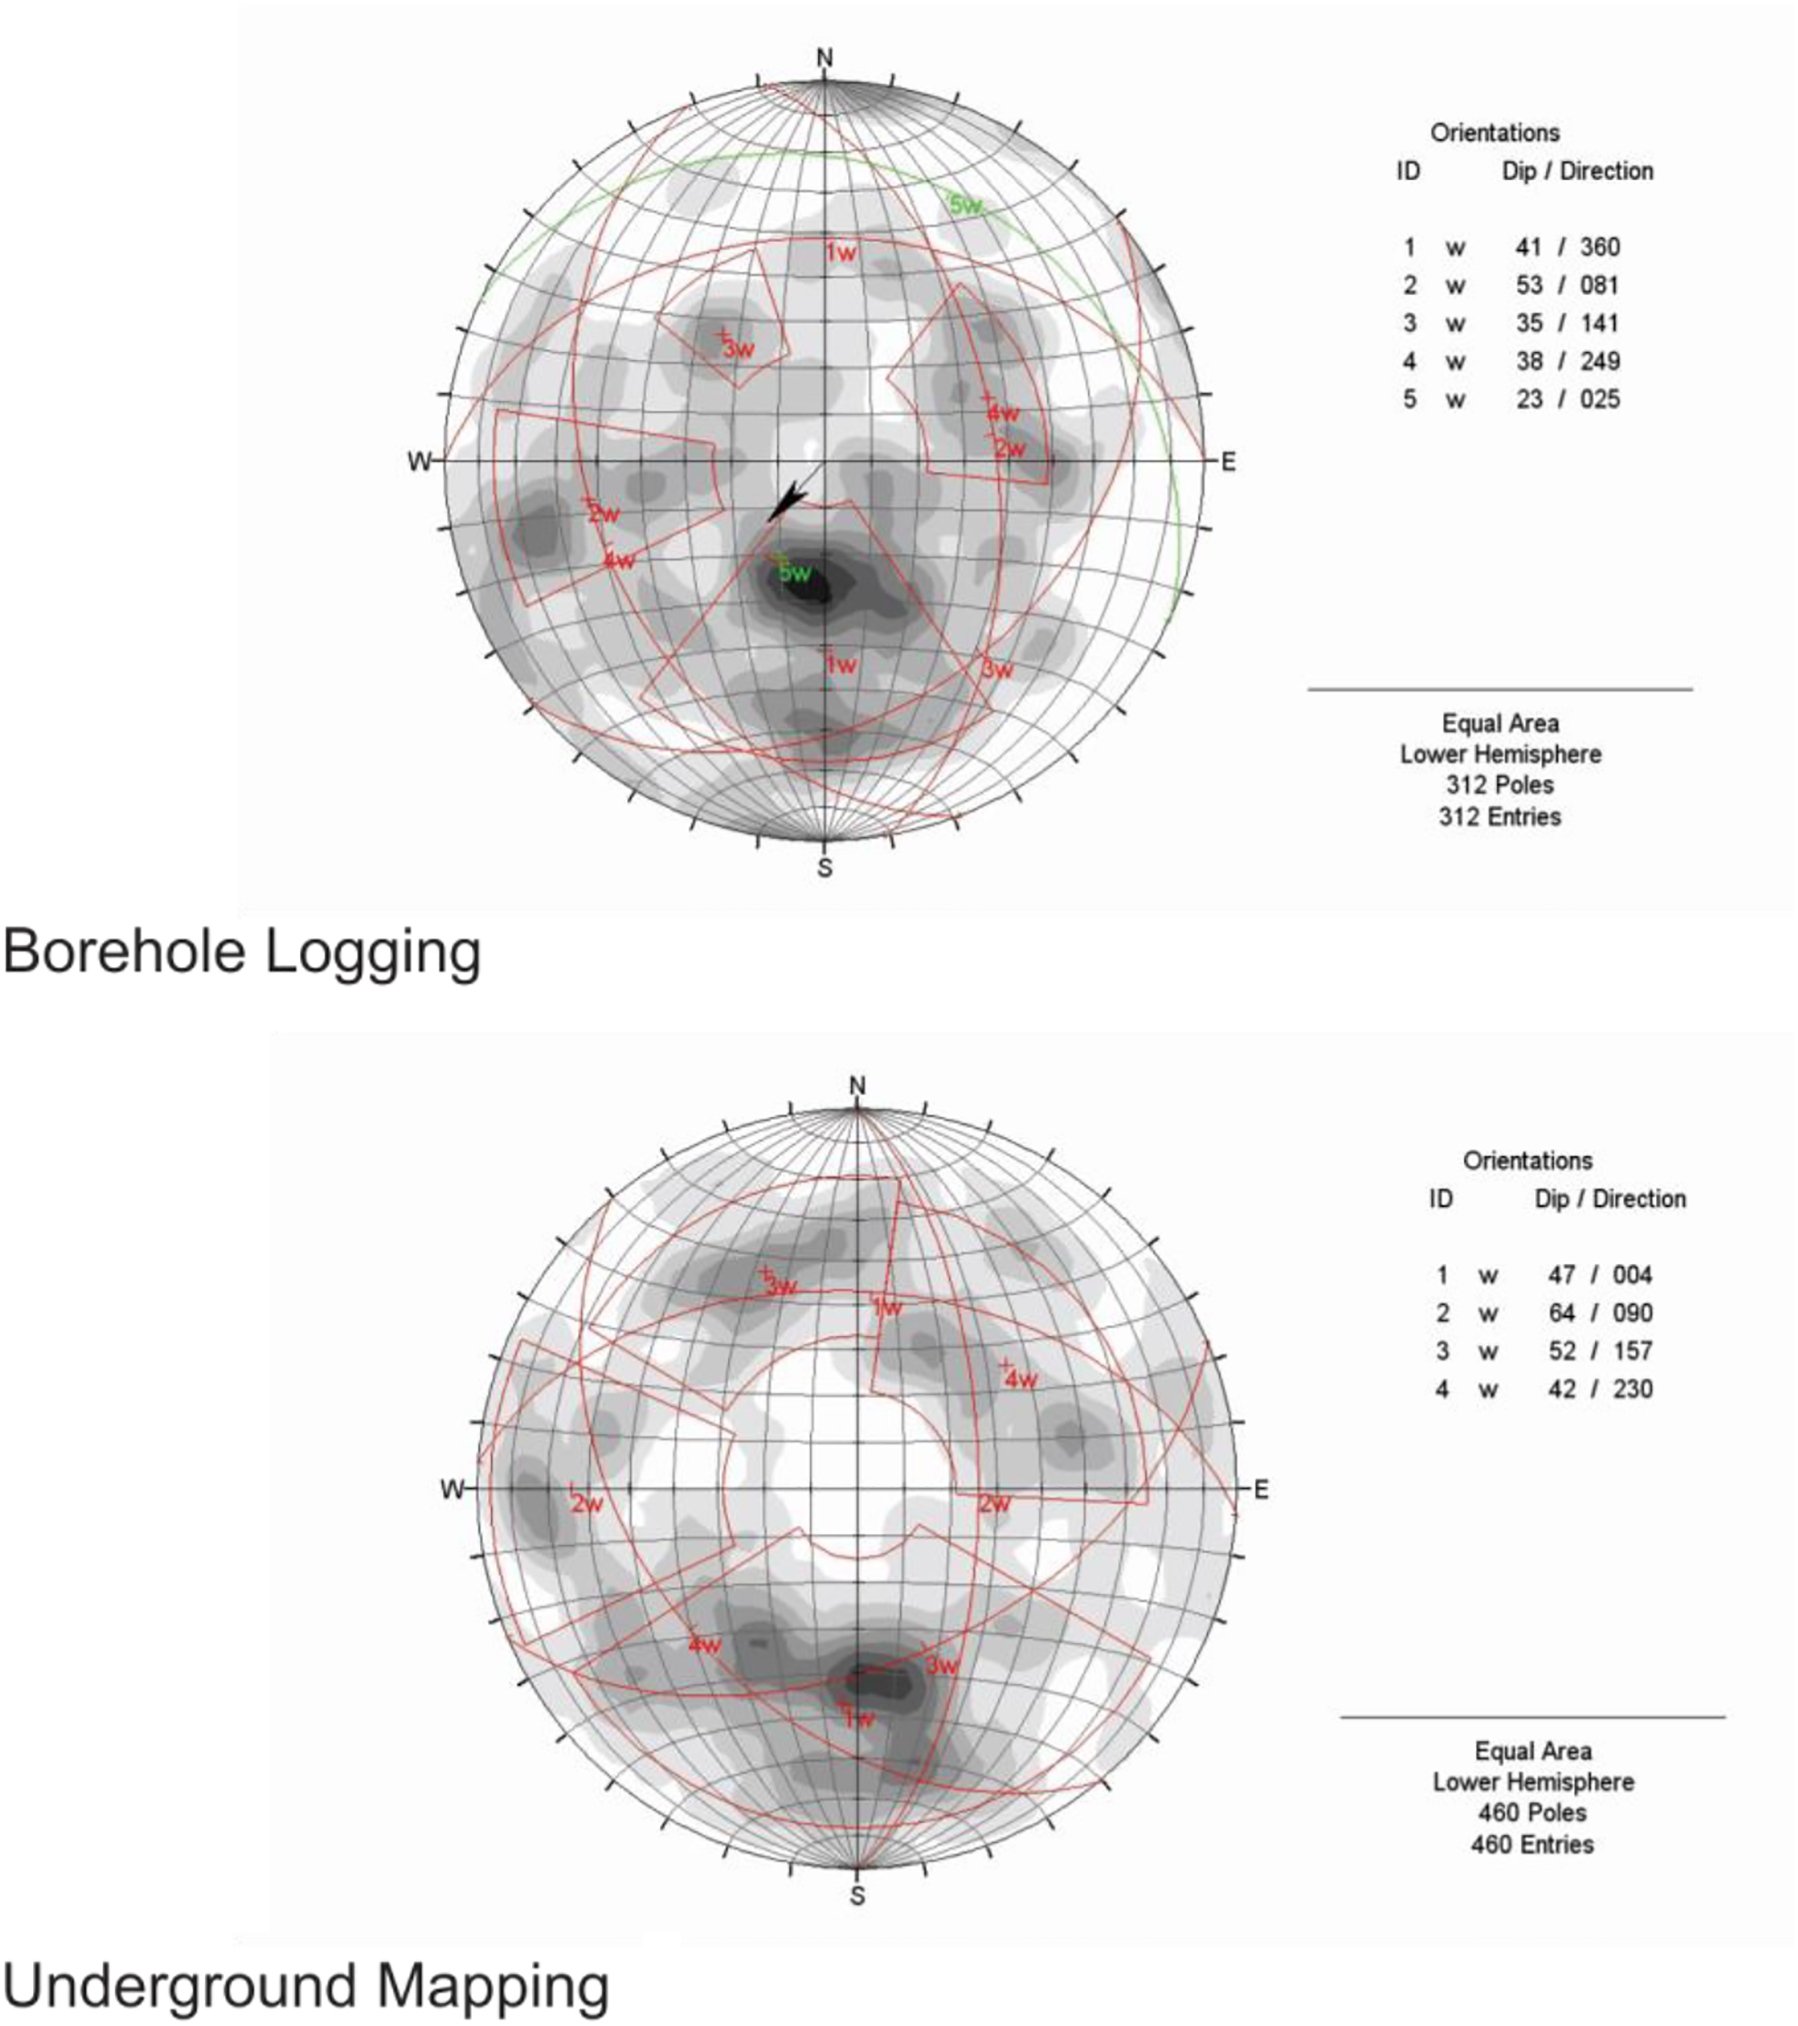
Stereographic projection of discontinuity data obtained from core logging and those mapped in the underground mine
Characteristics of joint sets
Intact rock properties
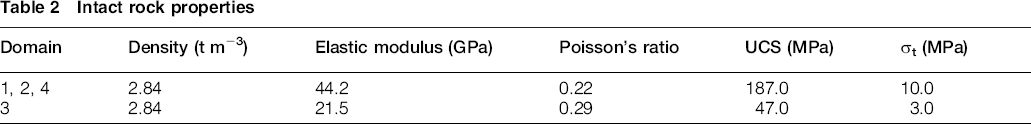
The intact rock properties were measured based on 13 core samples from different borehole elevations. The lowest strength results were obtained for rock samples from Domain 3. Rock samples from domains 1, 2 and 4 had similar mechanical properties, Table 2.
Intact rock properties
Size distribution of transiting materials
Distribution of materials dumping into an ore pass has a significant influence on the impact loads on the ore pass walls. Hambley et al. (1983) suggests that the average force on an ore pass wall because of a single particle impact is directly proportional to the particle velocity and particle weight, and is inversely proportional to impact duration. Therefore, larger rock fragments can cause more damage on the ore pass walls.
Given the importance of impact loads on the ore pass walls it was decided to characterize transiting material. To these purposes the digital photogrammetric method was used. A total of 17 images were collected for the size distribution assessments. Figure 6 shows a muck pile photo. Collected photographs were subjected to photogrammetric techniques to highlight individual fragments within the images. This was achieved using WipWare Inc.'s Wipfrag. The results of the merged image analysis were summarized in Table 3. The results indicated that the maximum boulder size dumped into the ore pass was 2.1 m, while the mode of particle size dumped was 0.2 m.
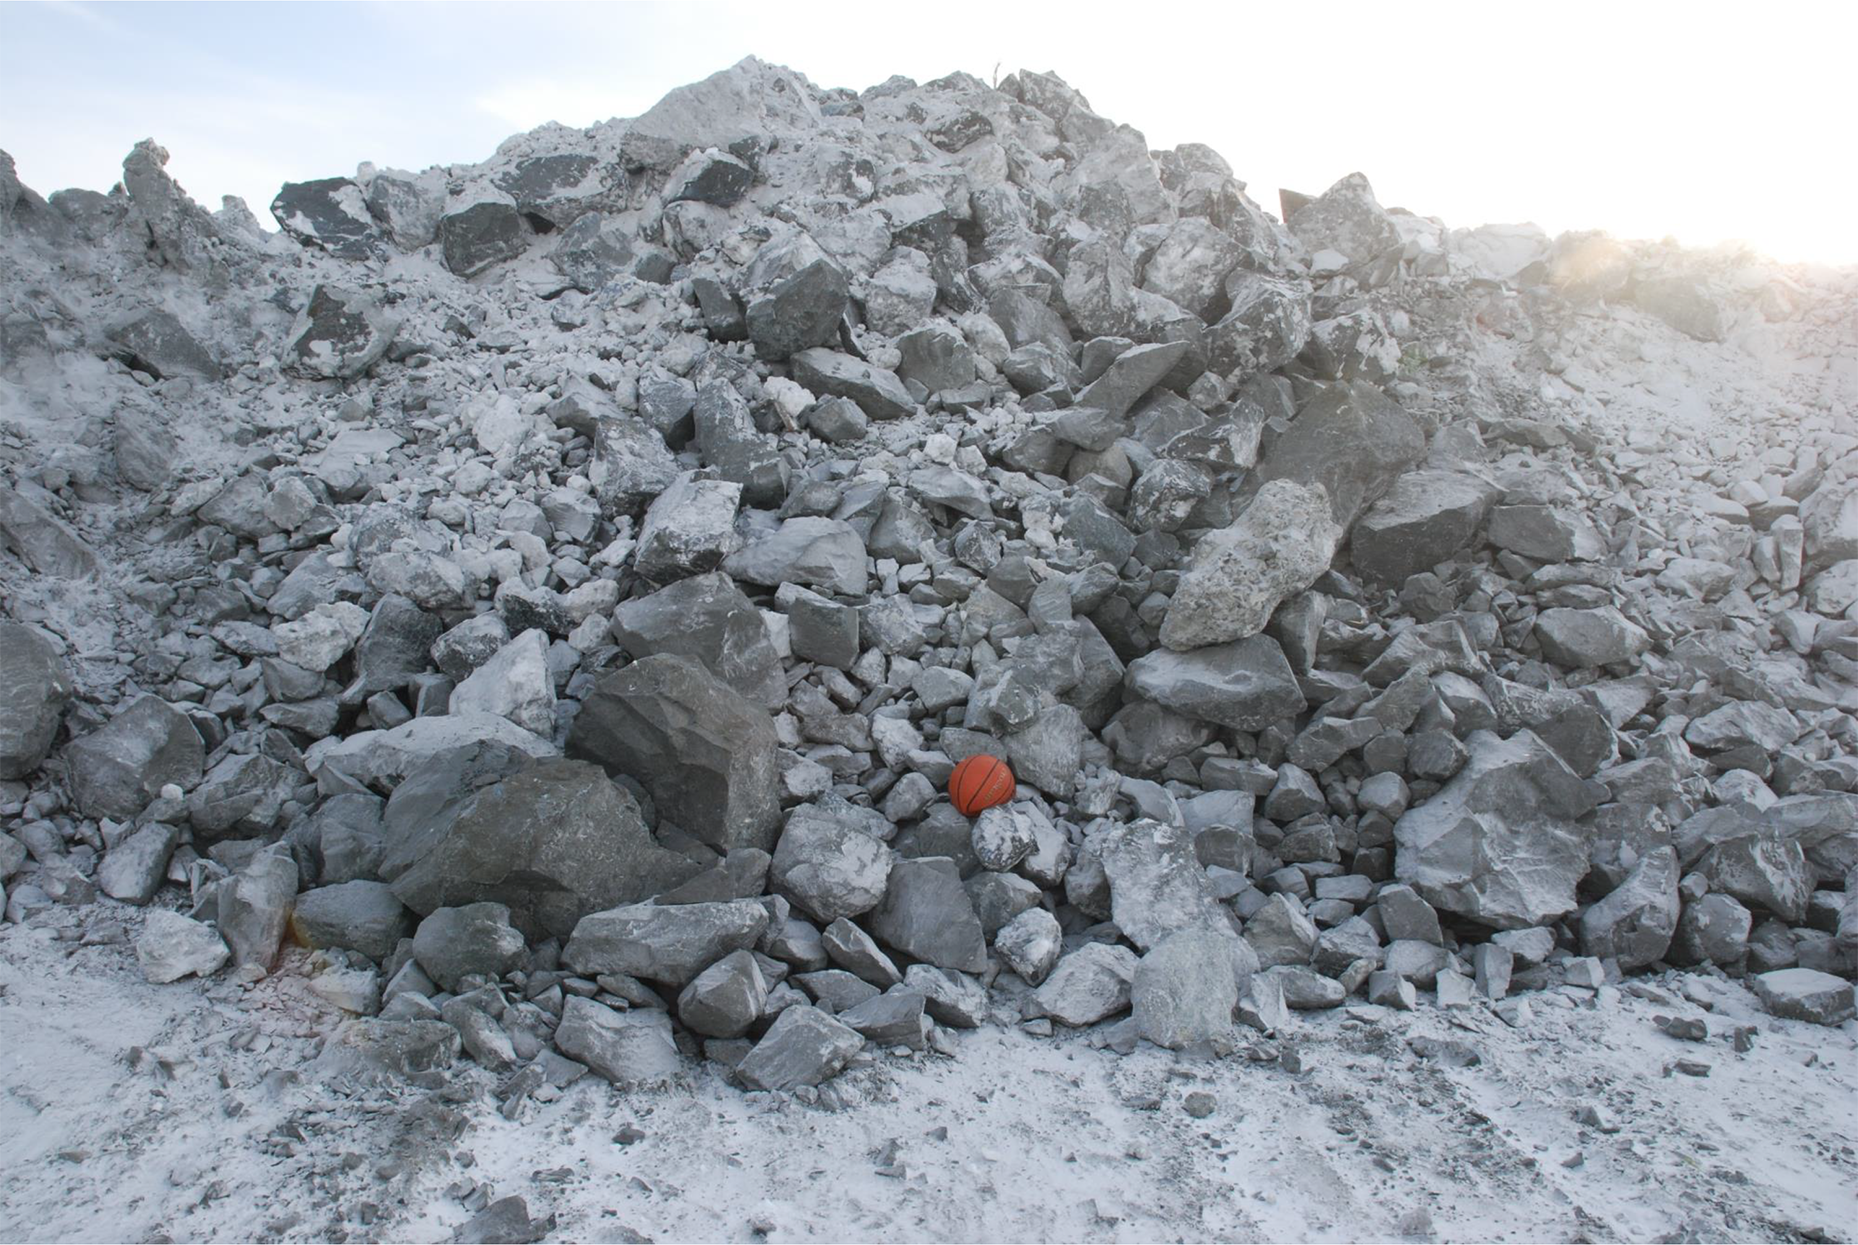
Photo of a muck pile
Particle size distribution analysis (merged analysis of 17 images)

Rock mass classification
Rock Mass Rating, RMR89 (Bieniawski 1989) was used to assess the overall quality of the rock mass around the ore pass. Rock Quality Designation (RQD), joint condition index, and joint spacing were measured from the geotechnical borehole and intact rock strength results from the laboratory testing. Rock Mass Rating89 values were determined along the borehole that was drilled semi-parallel to the ore pass. Ground water conditions were assumed to be dry as the mine is in permafrost with a very low hydraulic conductivity. The RMR index values are varying by domain, ranging in average from poor (domain 3), to fair (domain 1) and to good (domains 2 and 4). Figure 7 presents the variation of the RMR values along the geotechnical borehole. Zones with RMR89>60 are relatively less degraded than those in poorer ground. This is supported by the recorded CMS.
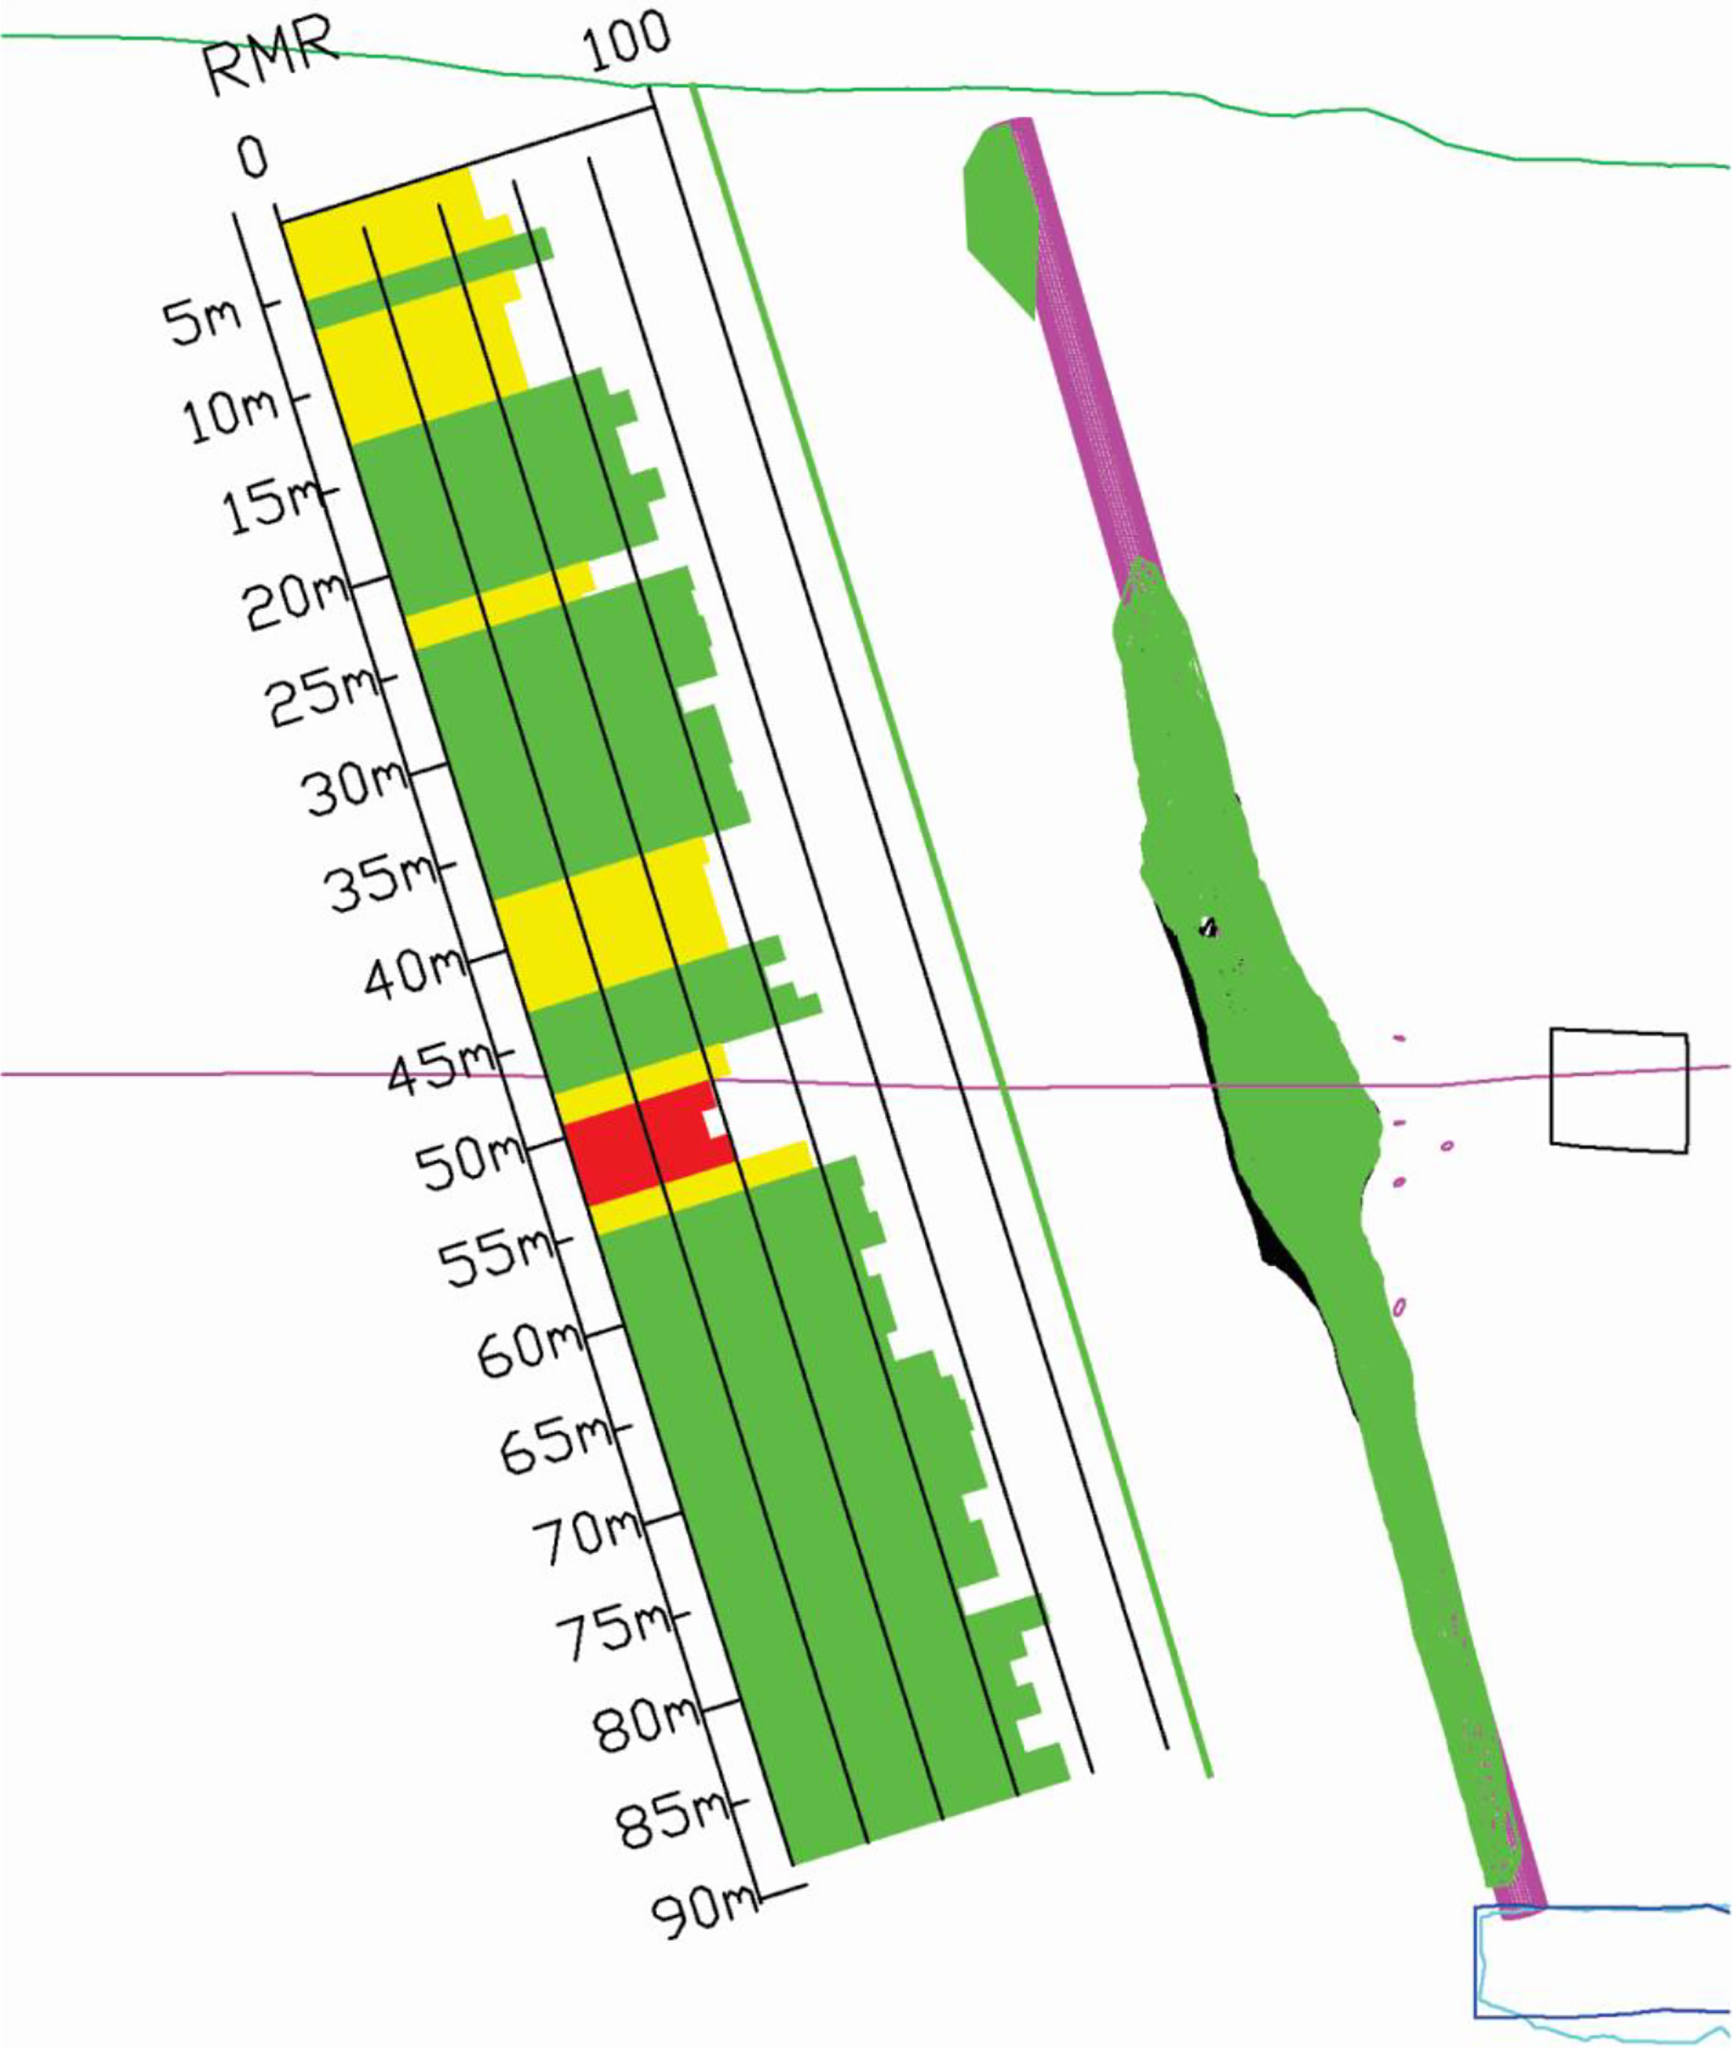
Variation of rock mass quality (rock mass rating, RMR89) by depth
Discrete fracture network
A Discrete Fracture Network (DFN) model is a stochastic model which is generated based on specific relationships between fracture characteristics such as orientation of fracture sets, fracture shape, size, and termination, Dershowitz and Einstein (1988).
Model generation and validation
A DFN was developed for the rock mass around the ore pass using structural data from underground mapping and borehole logging. Data collected during the underground mapping are representative of the rock mass below the fault zone (Domain 4), and do not fully capture fracture variations by depth. Therefore, for fracture network generation, borehole data were used for estimation of fracture sets orientation and linear fracture intensity (P10), while underground mapping data were used for estimating fracture set trace length.
The FracMan code, developed by Golder Associates was used for generation of a DFN model for the rock mass. A 140x140x200 m model was generated based on the field data obtained at the Mine site. Figure 8 illustrates the generated 3D DFN model.
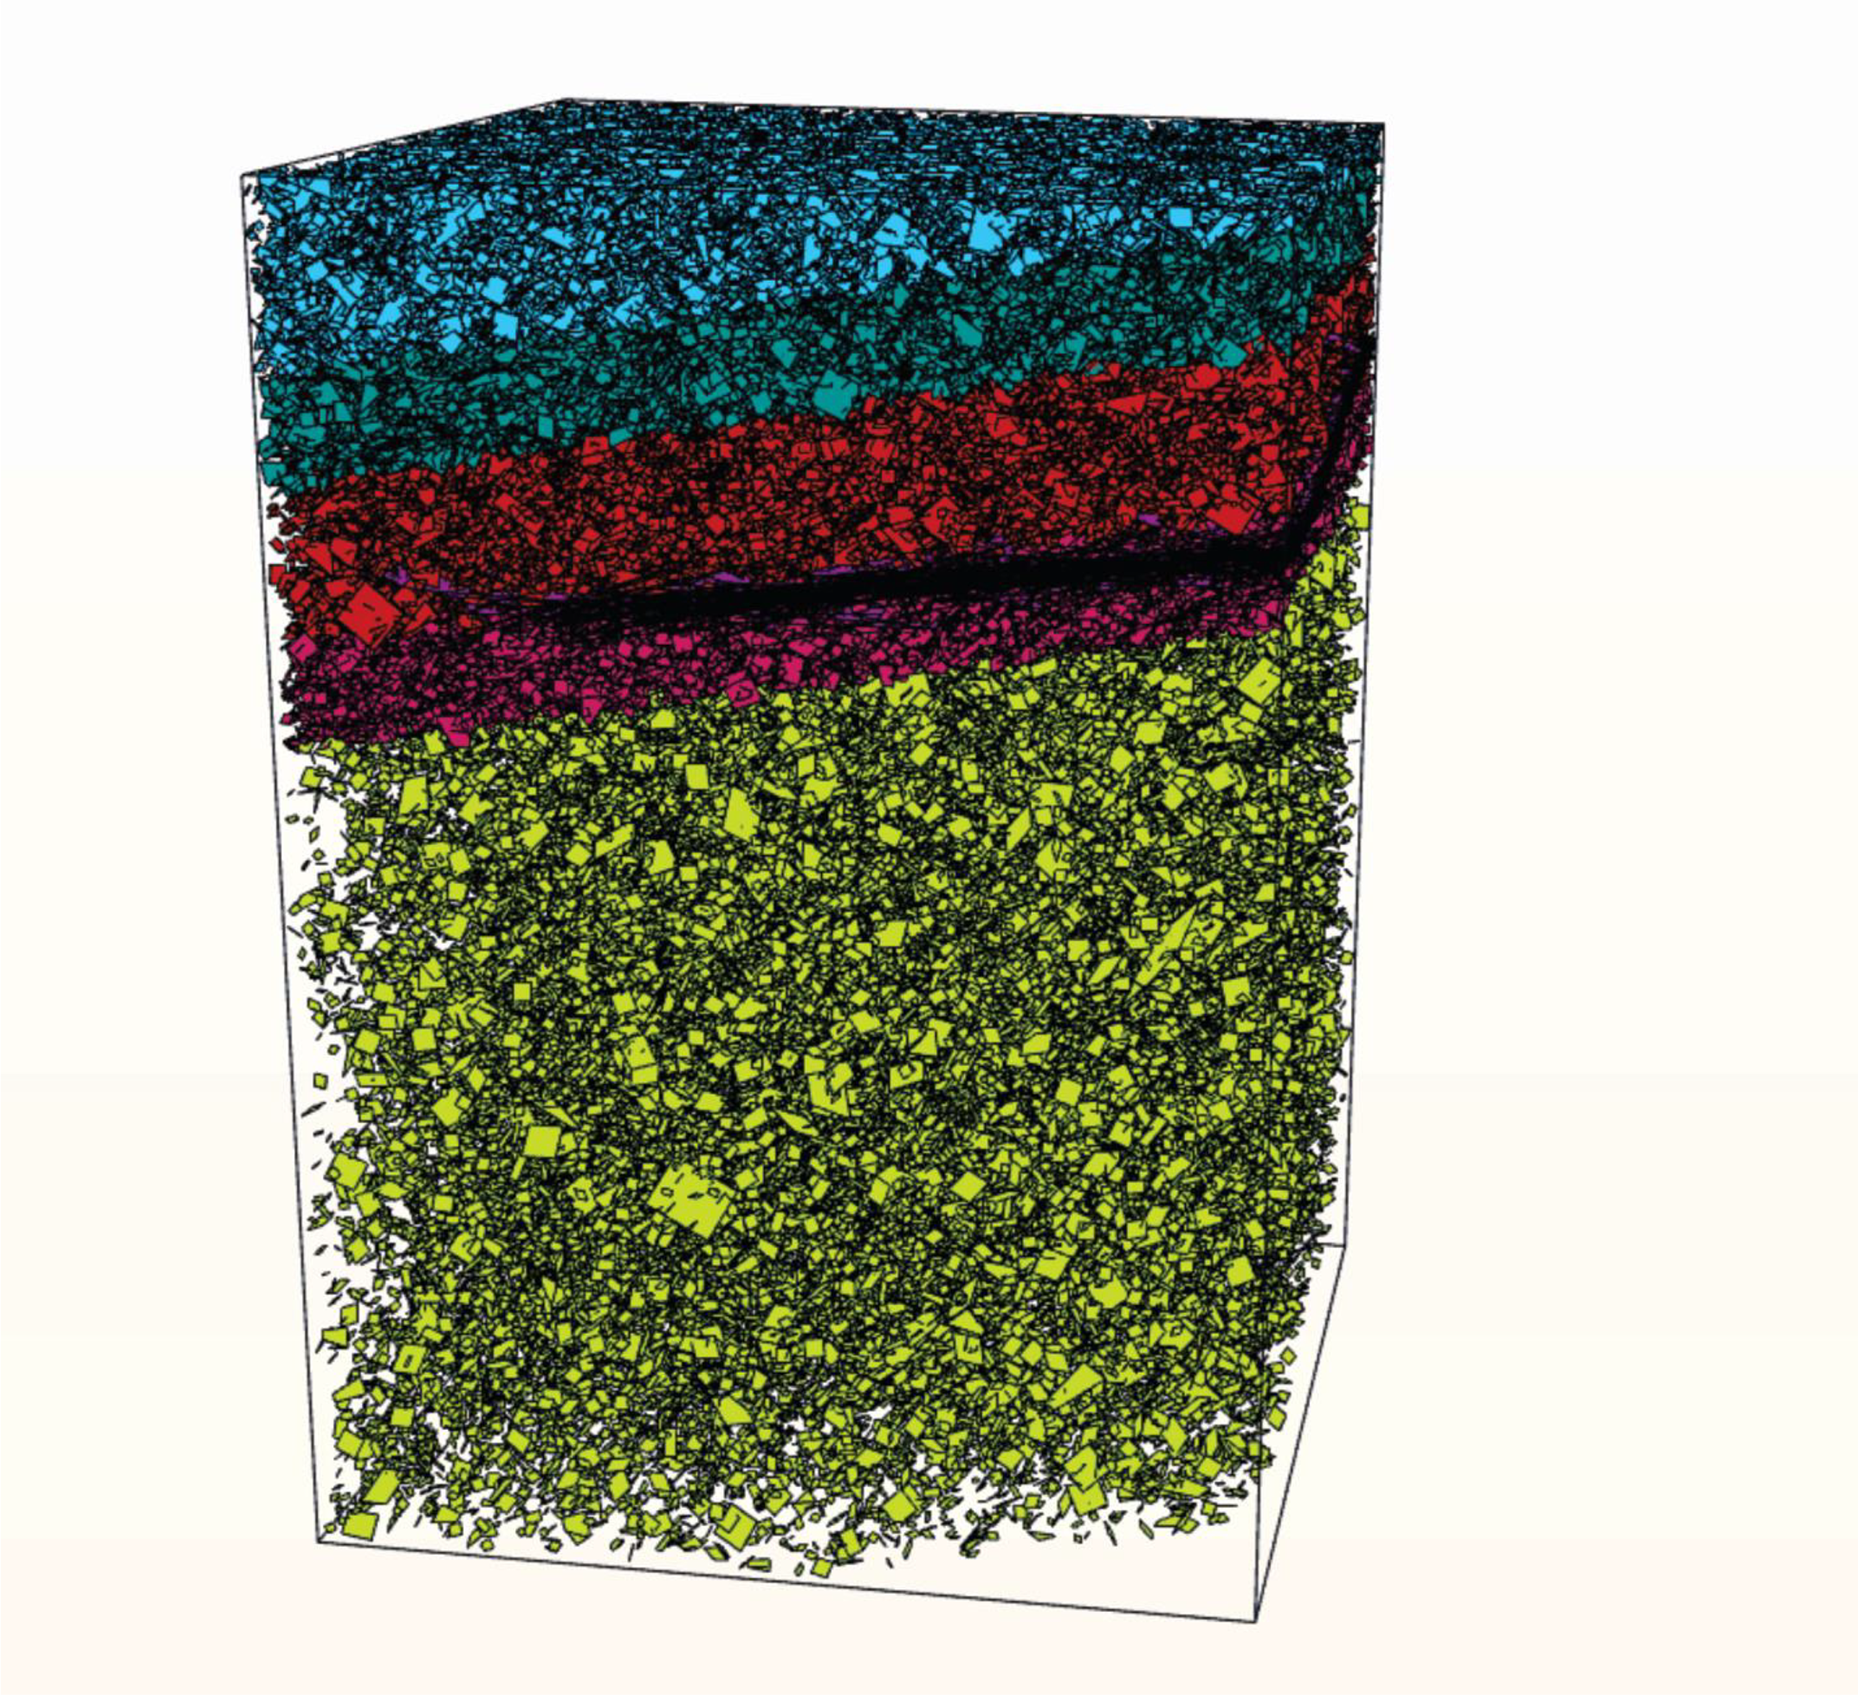
Visualization of the generated discrete fracture network (DFN) model
In order to generate a DFN, with the same characteristics as the fracture sets in the field, a borehole with the same orientation and length as the geotechnical borehole drilled at the mine was introduced into the model. The model was divided into different zones along the borehole length, and the appropriate fracture intensity (P10) was assigned to each zone. This was followed by bootstrapping of fracture orientation from the orientation data obtained from the borehole logging. Bootstrapping techniques use existing fracture orientation data to determine parameters for a Fisher distribution. These two steps ensure that the simulated fracture network will generate fracture sets of the same orientation and intensity as those observed in the field.
Figure 9 compares the average fracture intensity along the borehole in the DFN model with that obtained from the field data.
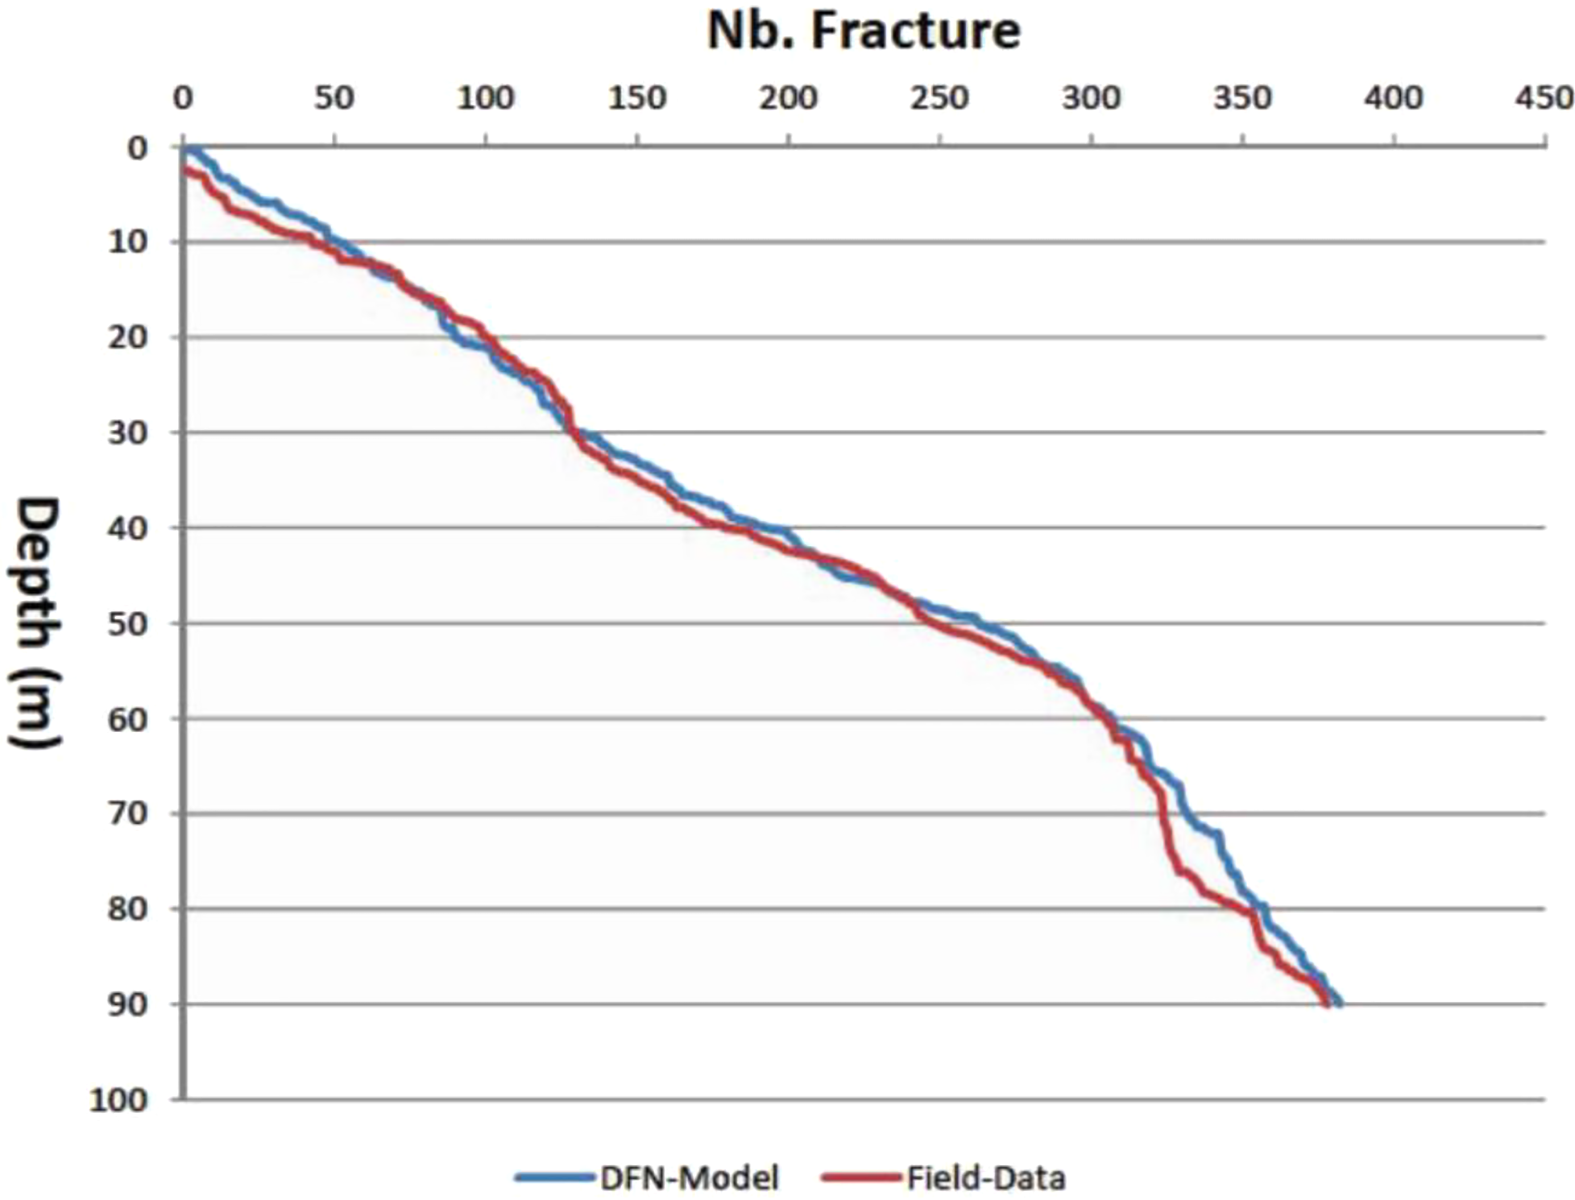
Comparison of the variation of P10 observed along the geotechnical borehole with the one obtained from a virtual borehole in the discrete fracture network (DFN) model
The DFN model was generated by assigning an initial fracture size to the fracture sets. The 2D fracture segments were traced on three scan-planes introduced in the model, parallel to the orientation of the mapped underground drift walls. The generation process was repeated until a statistical agreement was reached between fracture trace lengths in the model with those obtained from the field data. Figure 10 illustrates fracture traces mapped along an underground drift by photogrammetry and fractures intercepted by a scan-line introduced into the 3D-DFN model, parallel to the orientation of the underground drift wall. A comparison of the distribution of fracture trace length in the DFN model, with those obtained from the field data, indicated that they both follow a log-normal distribution. This calibration process resulted in a 3D-DFN model valid for the area of study and could be used for further analysis.
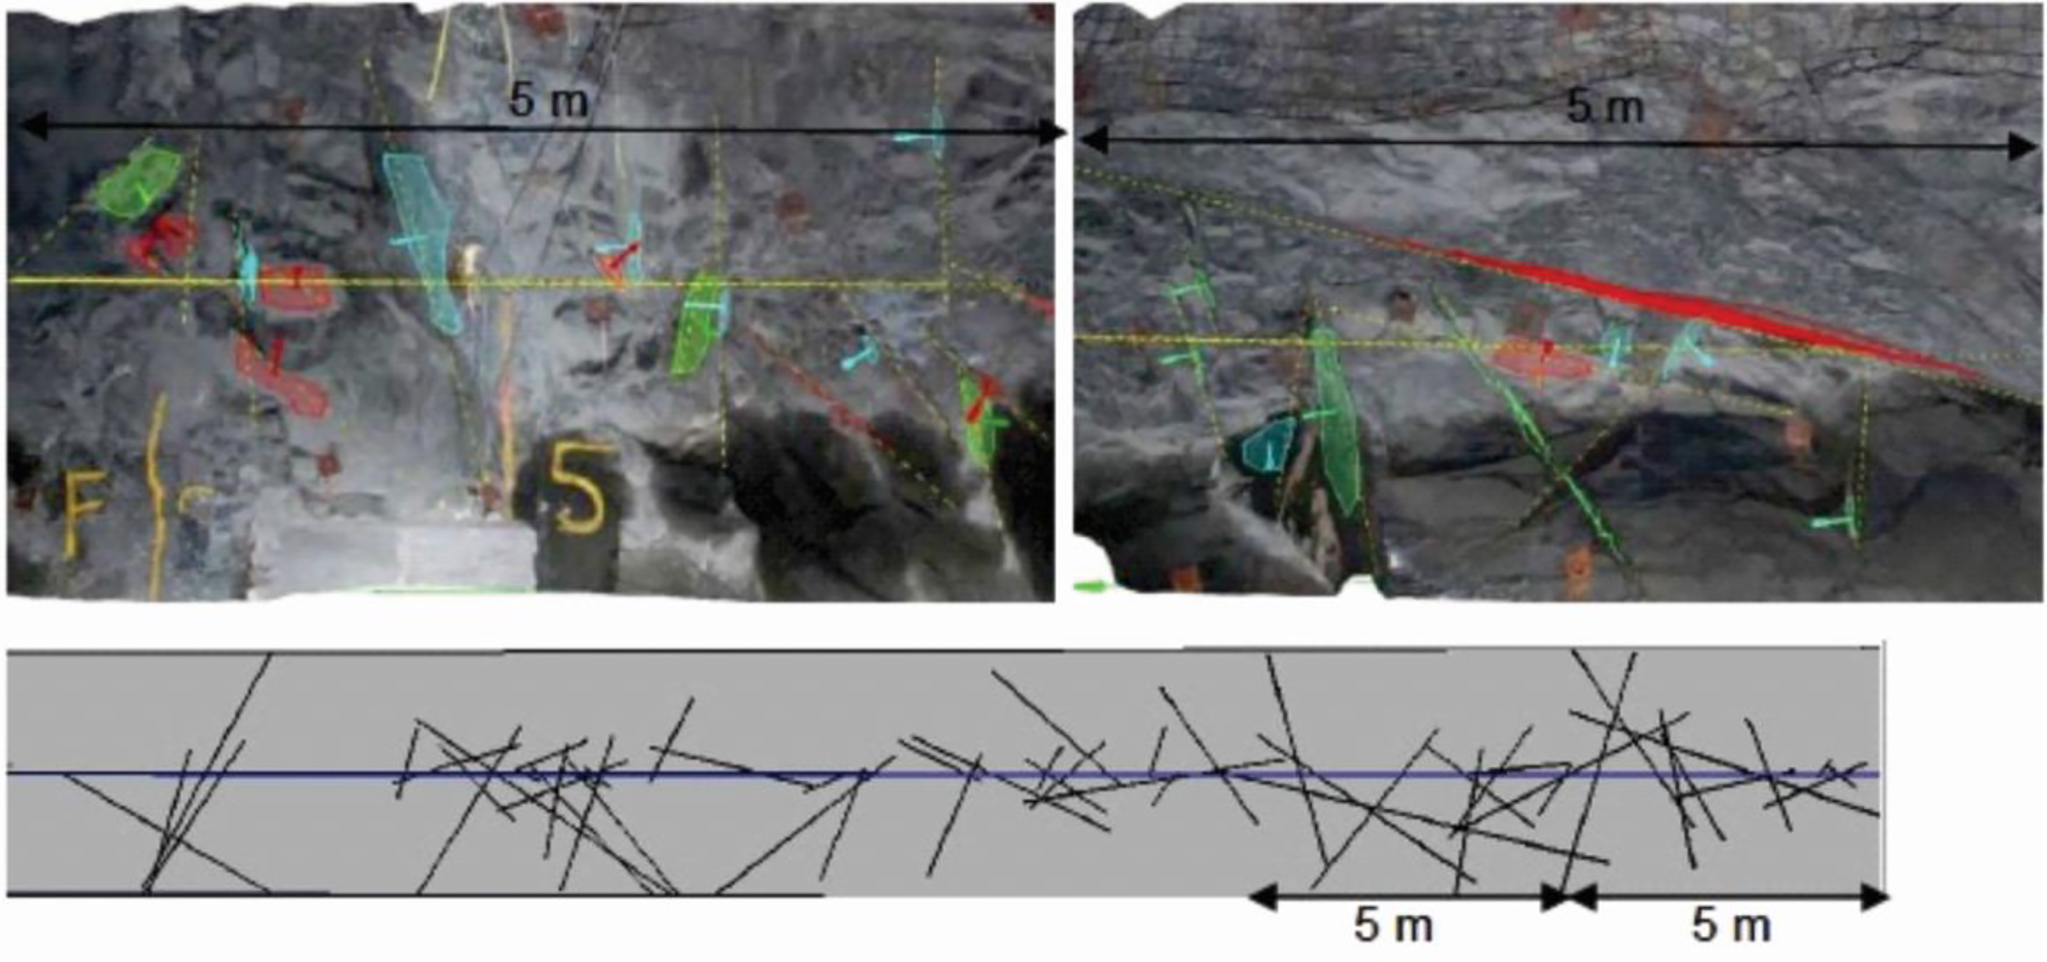
Trace of fractures mapped in underground drifts compared to those obtained from the discrete fracture network (DFN) model
Stability analysis of the ore pass
Examples on the application of DFNs in the stability of surface and underground excavations have been provided by Grenon and Hadjigeorgiou (2003); Rogers, Moffitt and Chance (2006), Hadjigeorgiou, Esmaieli and Grenon (2009), and Elmouttie, Poropat and Krähenbühl (2010). The approaches rely on the generation of a DFN model to determine the number of potentially unstable wedges forms along the walls of an excavation. The stability of individual wedges can subsequently be assessed based on limit equilibrium analysis. This approach can provide a statistical description of wedge size, number of unstable wedges, etc.
In the current work, the potential for instability of the ore pass was investigated by constructing a DFN model and determining the stability of all wedges formed along the ore pass walls.
Kinematic analysis of the ore pass
Once the 3D-DFN models were generated, the configuration of the ore pass and its adjacent infrastructures were introduced in the rock mass models. Figure 11 illustrates the constructed excavation into the DFN model.
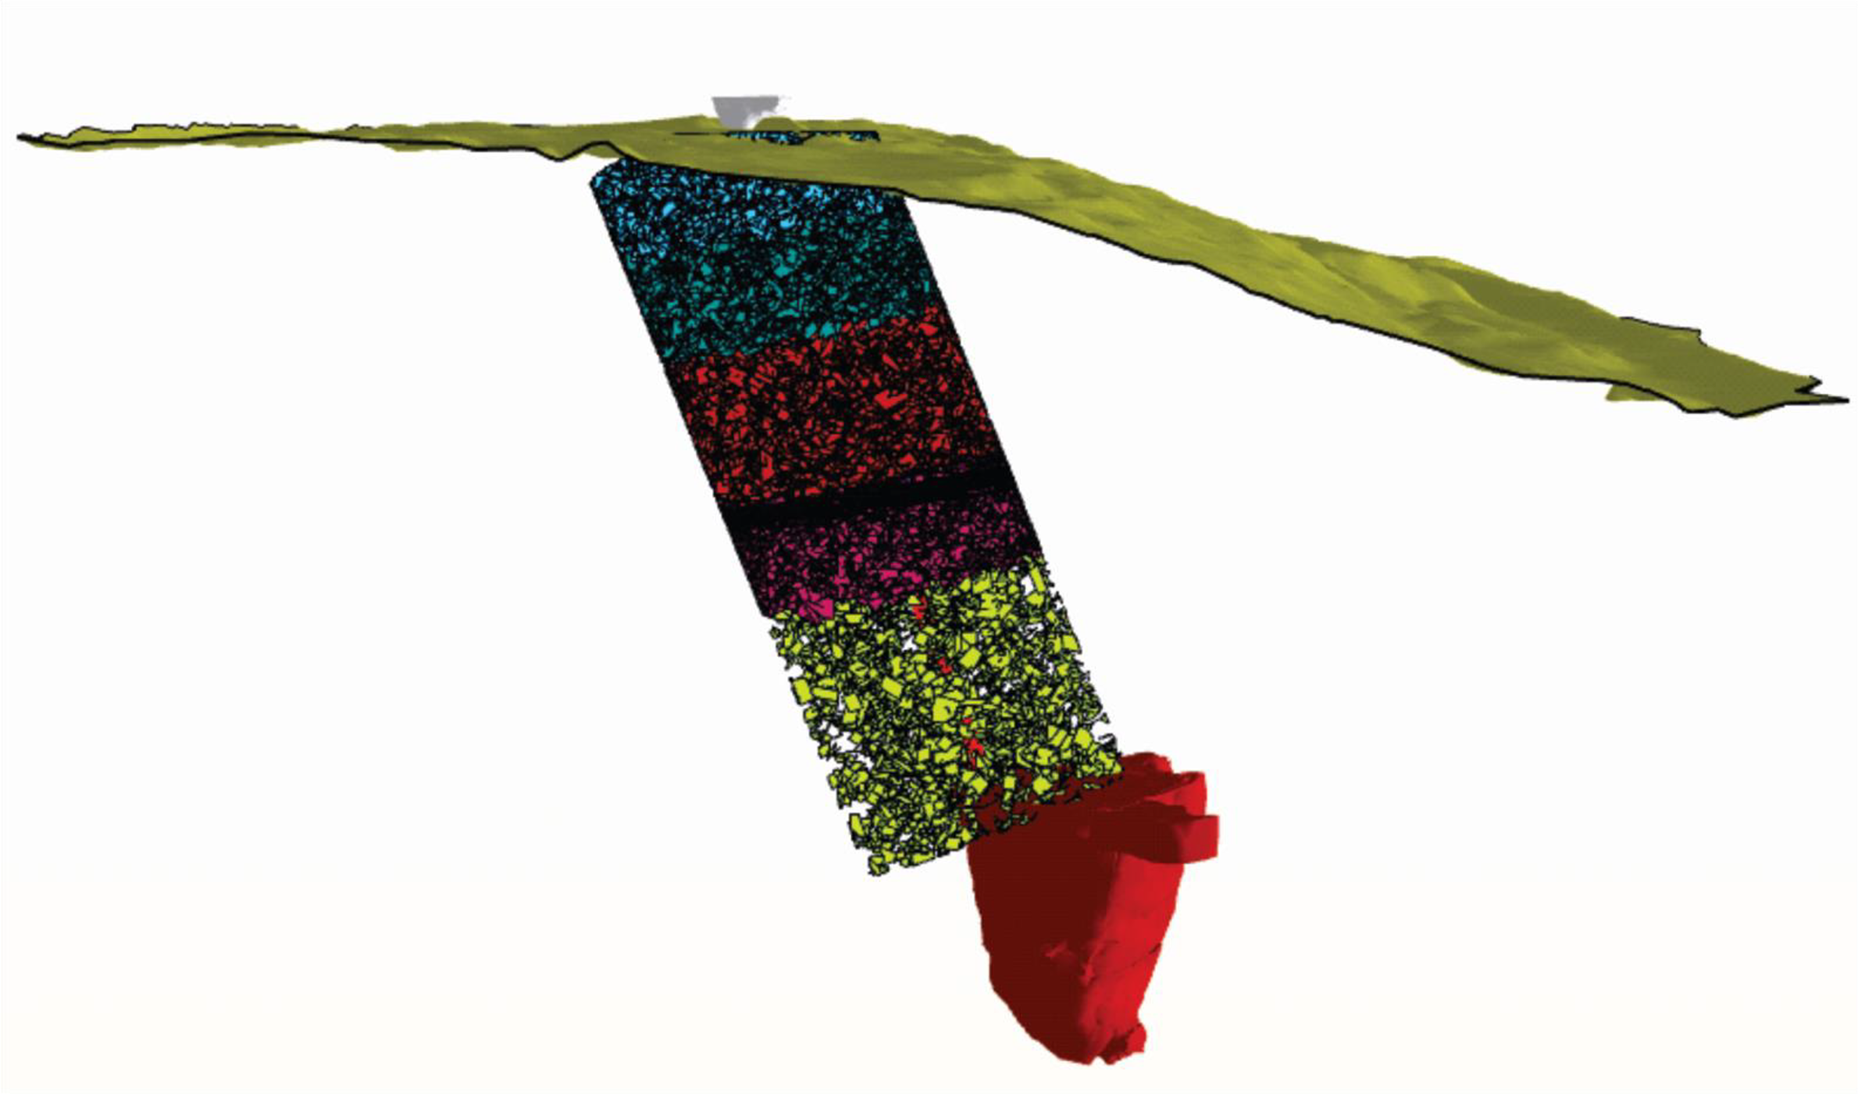
Introduction of the ore pass into the discrete fracture network (DFN) model
As the rock mass is jointed, the introduction of the excavations can expose rock wedges along the ore pass walls. Subsequently, a limit equilibrium analysis was used to determine the stability of all individual wedges daylighting into the ore pass. As there was no readily available information on the shear properties of joints they were assumed cohesionless with an angle of friction equal to 30°.
Figure 12 shows all formed wedges and their distribution along the ore pass for one DFN realization. For comparison purposes, in Fig. 13 the surveyed degradation zones were superimposed on the wedges formed along the ore pass.
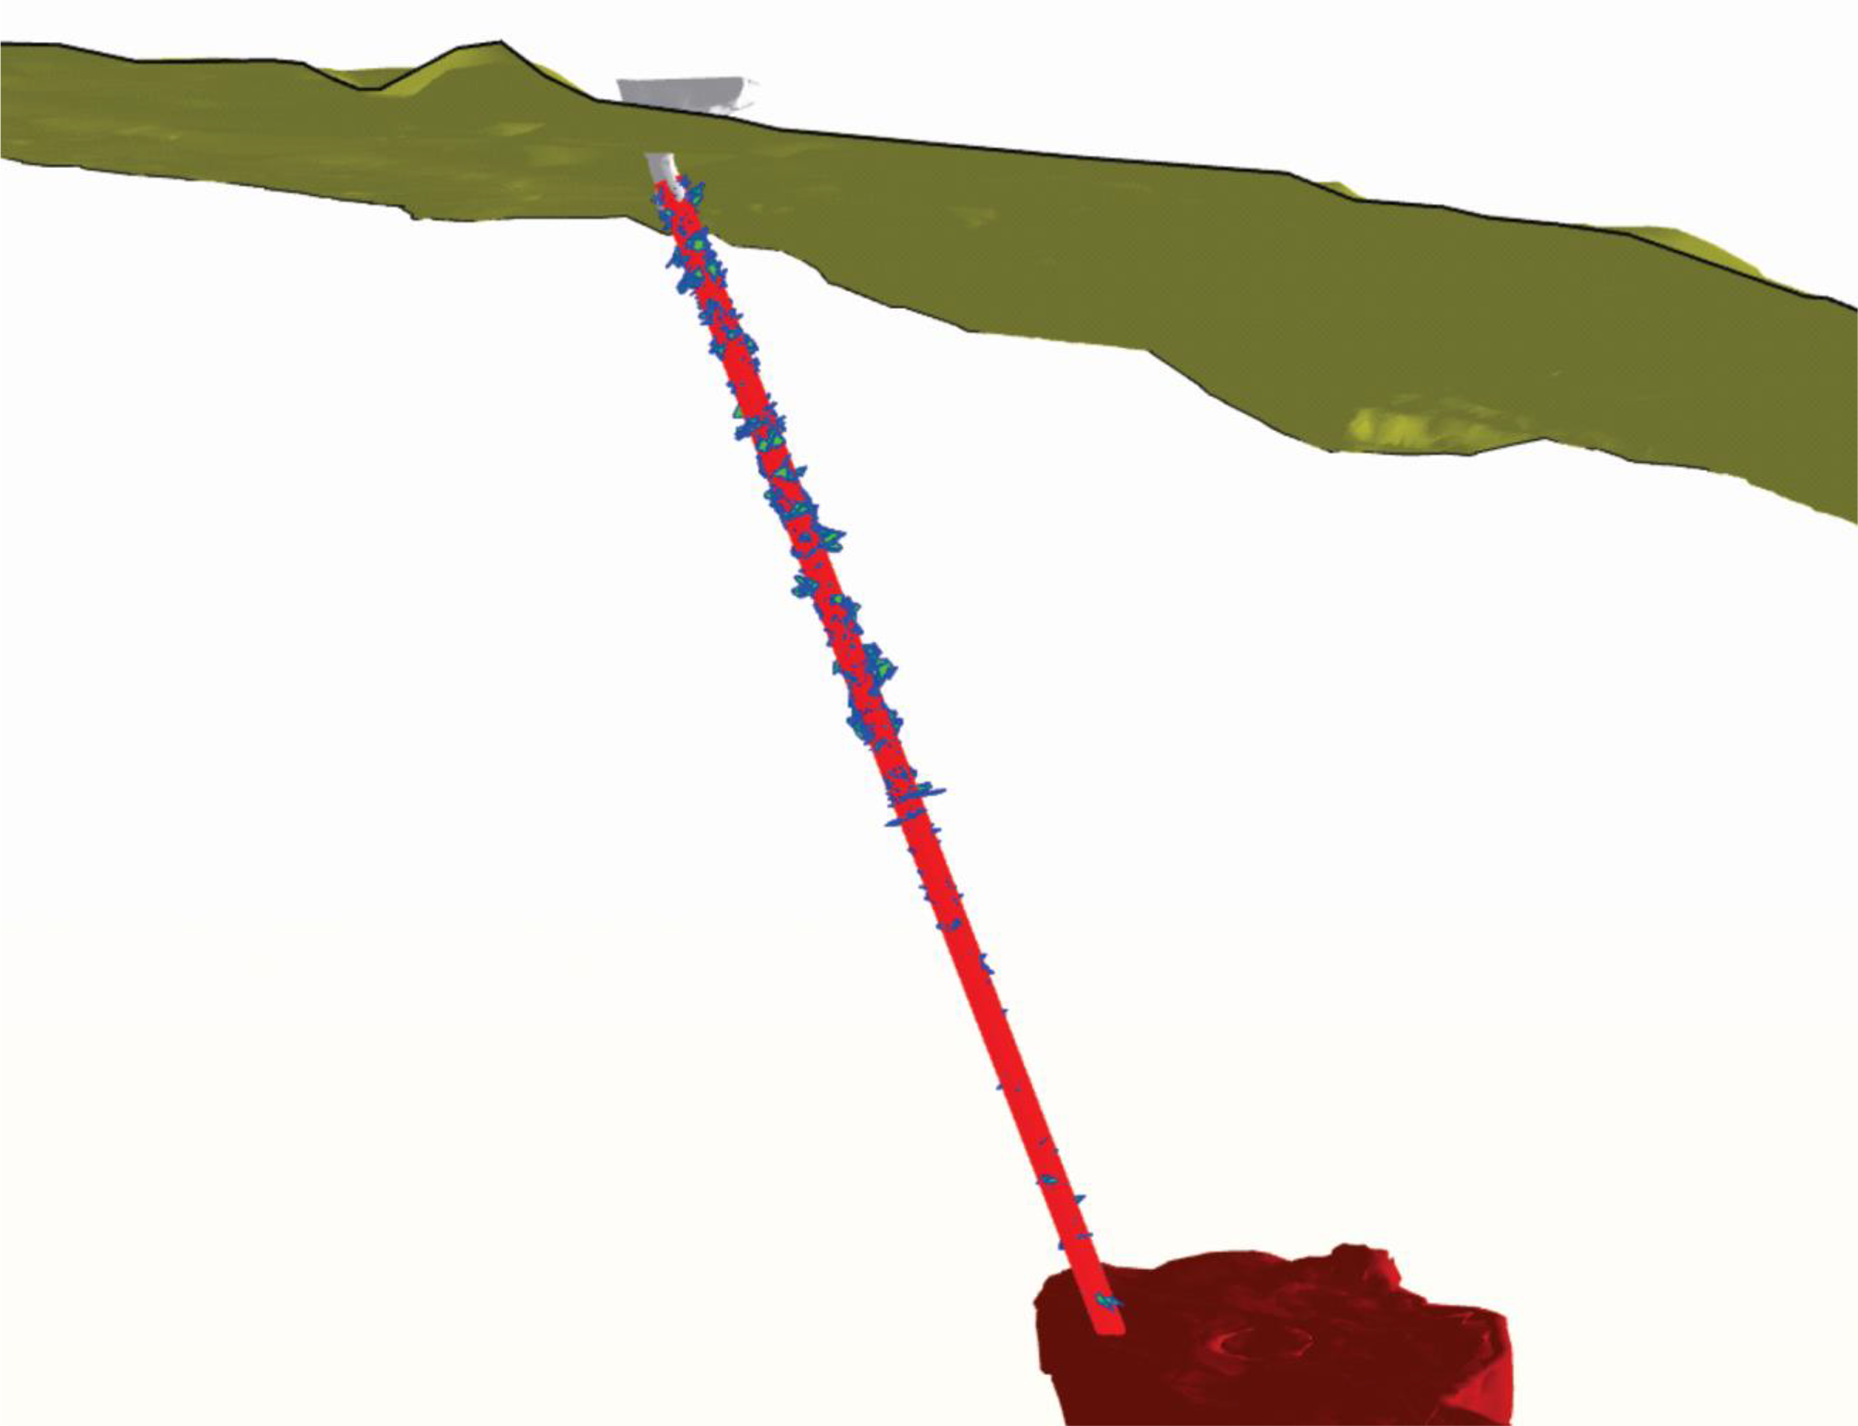
Localization of size and distribution of all wedges formed on the ore pass walls (discrete fracture network (DFN) model #1)
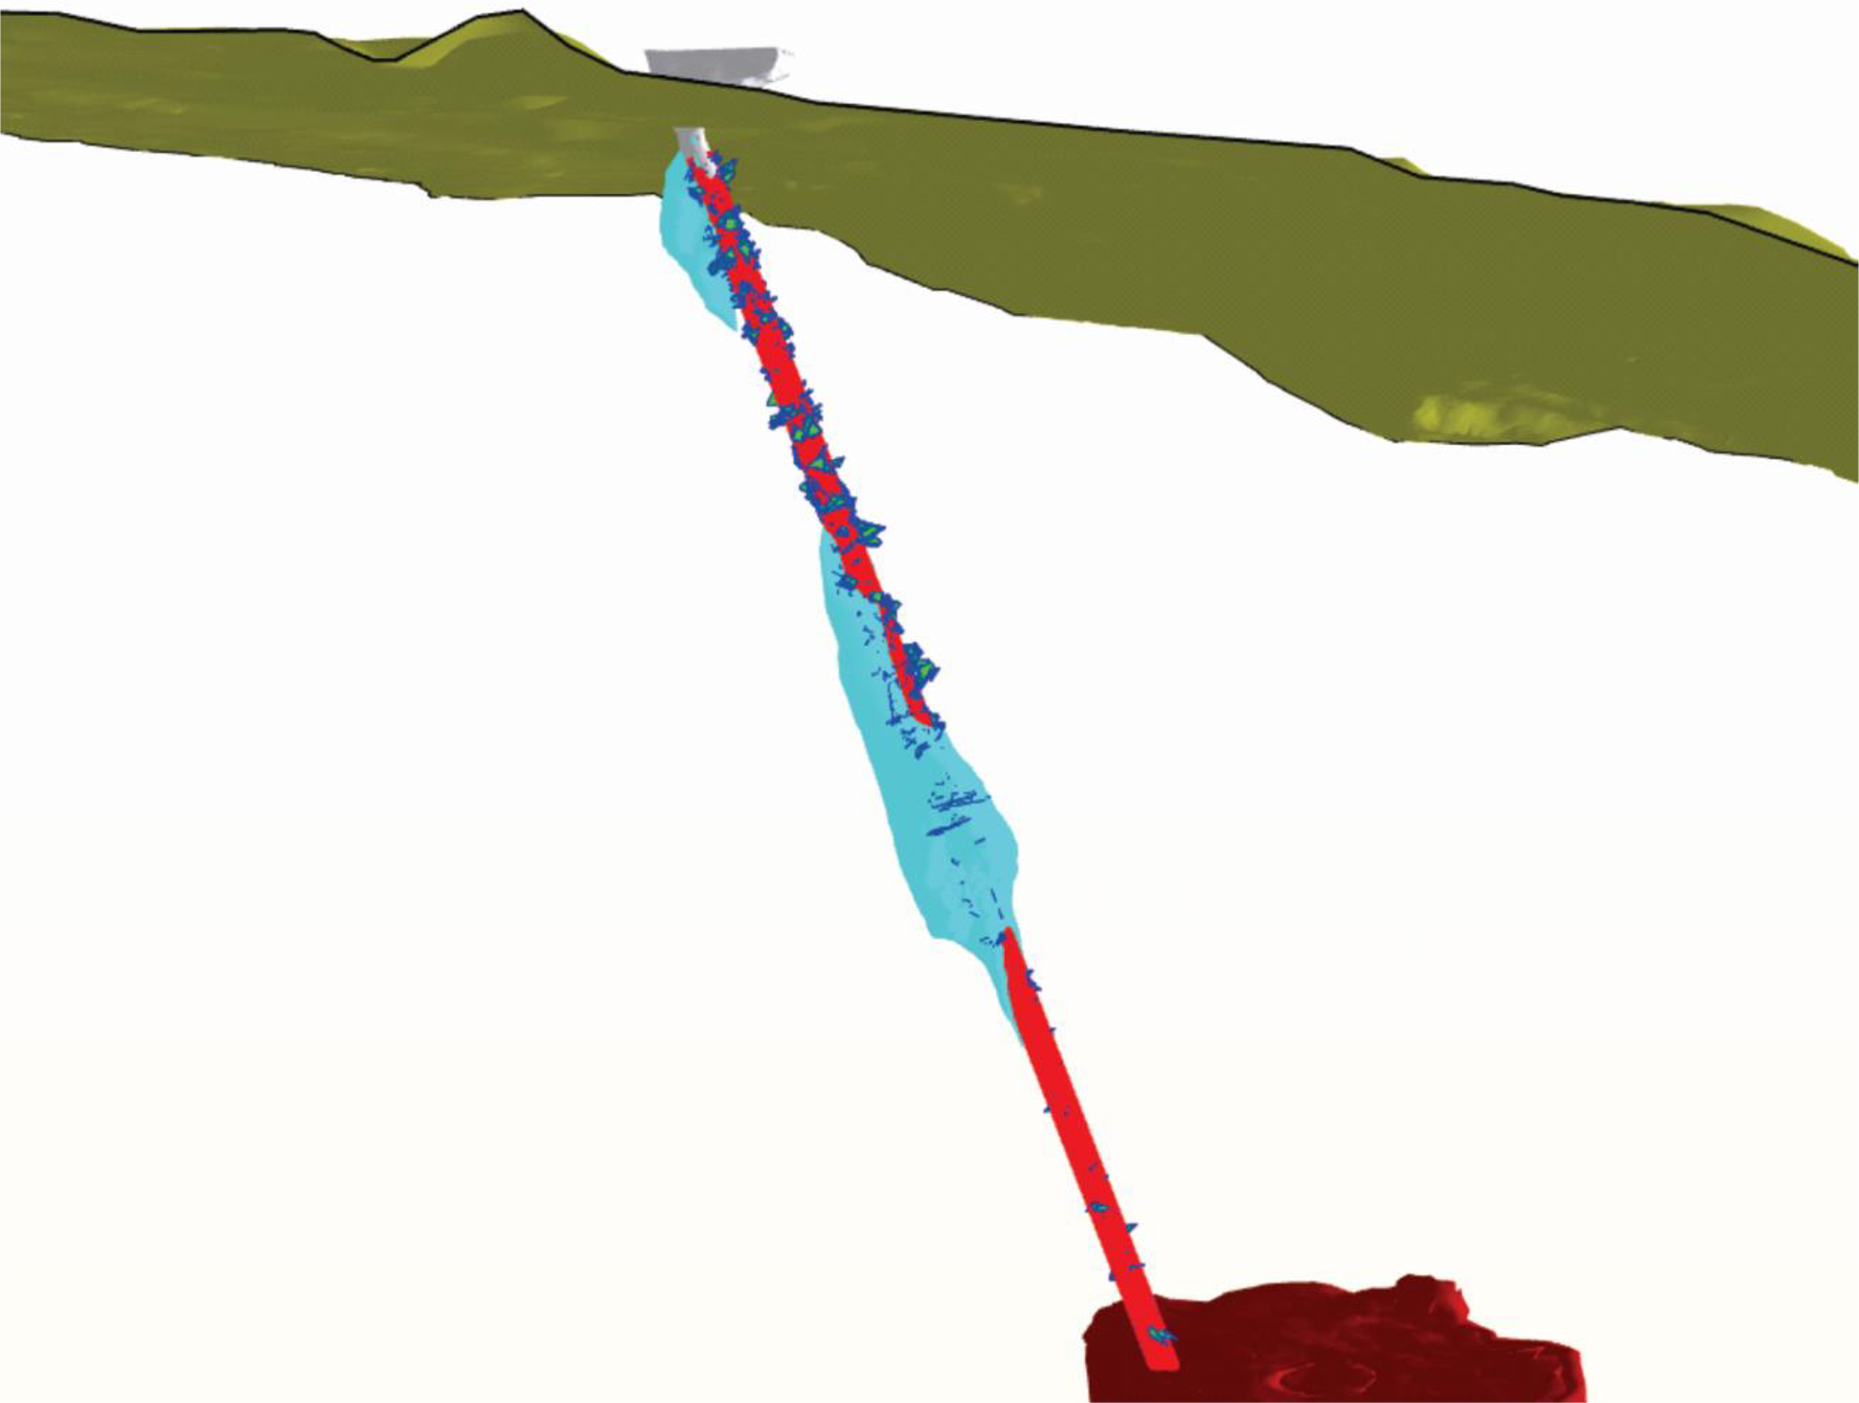
The zones of the ore pass wall degradation recorded by cavity monitoring surveys (CMS) were superimposed into the wedge distribution model
Table 4 summarizes the results of the wedge analyses from three DFN realizations. It shows the total number of wedges generated along the walls of the ore pass for the three generated fracture networks.
Wedge characteristics for the ore pass
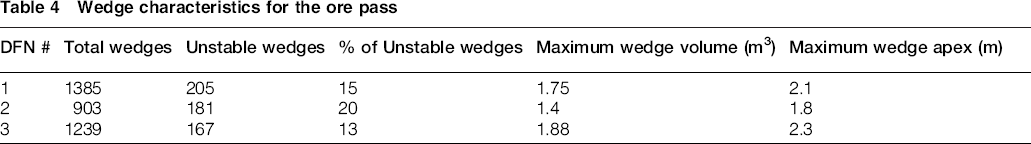
The results of wedge analysis indicate that the majority of rock wedges formed along the ore pass walls are stable. The percentage of unstable wedges, based on the assumed joint strength parameters, varied from 13 to 20%. The distribution of wedges formed along the ore pass wall indicates that most of the large wedges were created in Domains 1 (close to the surface), 2 and 3 (fault zone). The majority of unstable wedges formed on the hanging wall side of the ore pass. The total volume of unstable wedges for the three DFN models was: 0.4, 0.75 and 0.5 m3. These volumes are smaller than the volume of the degradation zones recorded by the CMS. Furthermore, the degradation zones extended deeper into the rock mass, beyond the wedges formed on the ore pass walls. The results of the kinematic analysis along the ore pass suggest that gravity-driven wedge failure was not the only failure mechanism controlling the integrity of the ore pass. This resulted in further investigation of the influence of wall degradation owing to material transfer.
Influence of impact loading on the ore pass walls
In order to investigate the impact load of rock fragments on the ore pass walls, a series of numerical experiments were undertaken using a DFN–DEM model. In these numerical experiments, the rock mass along the ore pass wall was simulated as a 2D Synthetic Rock Mass (2D SRM) model.
Pierce, Cundall and Potyondy (2007) introduced the SRM approach as a link between DFN and bonded particle model (BPM). This technique uses the BPM to simulate intact rock deformation and brittle failure, and the DFN to represent the geometrical fracture characteristics of the rock mass. A detailed review of the SRM approach including its generation, calibration and applications are presented by Mas Ivars et al. (2010). For the current work, using the 2D SRM model allowed quantification of damage, inflicted by rock fragments, on the ore pass wall.
Estimation of the velocity of particles inside the ore pass
The 2D Particle Flow Code (PFC2D), a distinct element code developed by Itasca, was used to simulate the movement and velocity of rock fragments and boulders in the ore pass. Information on material properties collected from the mine site was complemented with past experience to select the input data to construct representative PFC2D models. Esmaieli and Hadjigeorgiou (2011) discussed the physical and mechanical properties of rock fragments that are required to simulate the movement of rock fragments in PFC2D. The properties include: rock size distribution, particle shape, normal and shear stiffness, density, friction coefficient and coefficient of restitution. The material properties used for this study are summarized in Table 5.
Material properties used in the 2D particle flow code (PFC2D) models
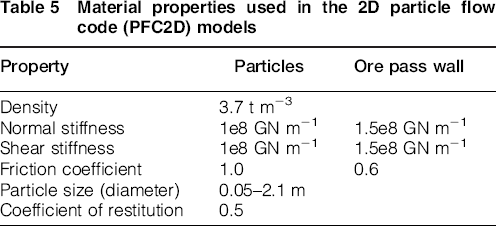
For the purposes of the numerical analysis, elongated (semi-elliptical) particles shapes were used by clumping together three circular particles. This approach resulted in a good representation of rock fragment shape observed at the mine site. The normal and shear stiffness of the particles and walls were fixed at 0.1 and 0.15 GN m− 1, respectively. These values were based on a review of previous simulations performed for material flow in ore passes. In the majority of the ore pass flow simulations a value between 1e8 and 8e8 GN m− 1 were employed for normal and shear stiffness of particles and walls, Beus, Iverson and Stewart (1998). Nazeri (2001) demonstrated that the use of large contact stiffness values results in larger impact forces on the walls of the ore pass. This may lead to an overestimation of impact forces on the ore pass walls.
The constructed PFC models used a slip-model, defined by a friction coefficient between particles to control their frictional characteristics. The coefficient of friction of particles is comparable to the inter-granular friction. Based on previous work by Turcotte, Hadjigeorgiou and Lessard (2003), the friction coefficient was assigned a value of 1, which represents a friction angle of granular materials of 40°. However, to prevent material hang-ups along the ore pass a lower friction coefficient was assigned to the walls (0.6).
In order to simulate collisions that would occur between particles flowing inside the ore pass, it was necessary to establish appropriate coefficient of restitution (COR) values for the rock fragments. In the present work, the COR was defined as the ratio between the magnitude of rebound and impact particle velocity. There is no standard way of determining the coefficient of restitution of rock fragments, particularly in an underground infrastructure like an ore pass. For the purpose of these numerical analyses, a coefficient of restitution of 0.5 was assigned to the rock fragments. This is within the range of 0.2 to 0.6, reported by Iverson, Jung and Biswas (2003) for hard rocks based on physical pendulum tests.
The ore pass configuration, including the degradation shapes, was simulated in PFC2D. Figure 14 displays a simulated ore pass configuration. In each numerical experiment, only one batch of rock fragments was generated in the particle generation zone. Each batch contained 250 particles of varying size, from 0.05 to 2.1 m of diameter. In all six numerical experiments were performed.
Ore pass configuration used for the 2D particle flow code (PFC2D) modelling
The velocity of particles hitting a rock mass influences the extent of inflicted rock mass damage. Hutchings (1992) reported that the extent of impact damage depends on the number and mass of individual boulders striking the surface, and on their impact velocity. More specific to ore passes, Goodwill, Craig and Cabrejos (1999) suggested that erosion wear in ore passes is roughly proportional to the impact velocity raised to the power of 2.5.
Particles created in the generation zone were allowed to drop into the ore pass. The velocity of several particles of different size was monitored as they transited inside the ore pass. Once the particles fall into the ore pass, they begin to collide among themselves and the excavation wall. The velocity of a particle travelling in the ore pass depends on the mass of the particle and the external forces acting on the particle via particle–particle or particle–wall collisions. The velocity of a particle decreases when it collides with the ore pass wall. The velocity of particles varied from 0 to 14 m s− 1 with an average velocity of 12 m s− 1. More incidents of impact on the hanging wall than on the footwall impact were recorded.
The impact load from a big rock boulder (2.1 m of diameter) on the ore pass wall segments is approximately two to four times higher than the impact load from the average (0.2 m of diameter) particle size.
SRM modeling
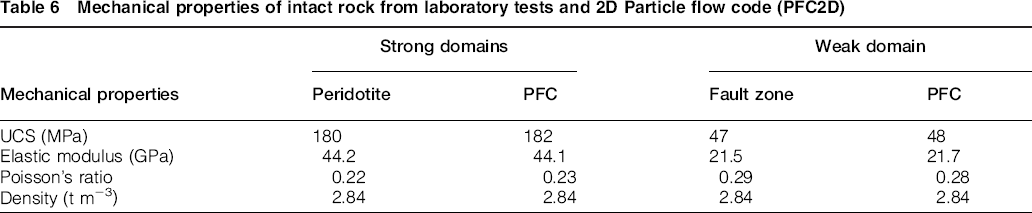
Synthetic Rock Mass (SRM) models were used to simulate the rock masses in different domains along the ore pass wall. A BPM was generated to simulate the intact rock properties encountered along the ore pass. This includes a BPM for the hard rock (Peridotite) encountered in Domains1, 2 and 4 and another model to represent the weak intact rock properties encountered in Domain 4. The inverse calibration method was used to establish the necessary micro-mechanical parameters for the generation of the 2D BPM that result in representative intact rock properties. For this purpose the PFC2D (V-4.0) modelling software was used to simulate a series of uniaxial compressive tests. The mechanical properties for the intact rock around the ore pass obtained from laboratory tests were compared to the results of computational PFC2D tests, Table 6.
Mechanical properties of intact rock from laboratory tests and 2D Particle flow code (PFC2D)
Modelling the full length of the ore pass section (96 m) in a 2D SRM model would have resulted in prohibitively long modelling times. Consequently, a tactical decision was made to construct four 2D SRM models of 10 m height representing the four rock mass domains along the ore pass.
A rectangular assembly of particles of 10 × 20 m was generated. The dimensions of the model were chosen to be large enough with respect to the 2.4 m ore pass diameter. The micro-mechanical properties obtained from intact rock calibration were used for the particles and bonds in the model. For the model in Domain 3, a weak zone was identified in the bonded model and the micro-mechanical properties of the weak rock were assigned to this zone. Figure 15a and b present the BPMs generated for Domains 1, 2 and 4, and for Domain 3, respectively.
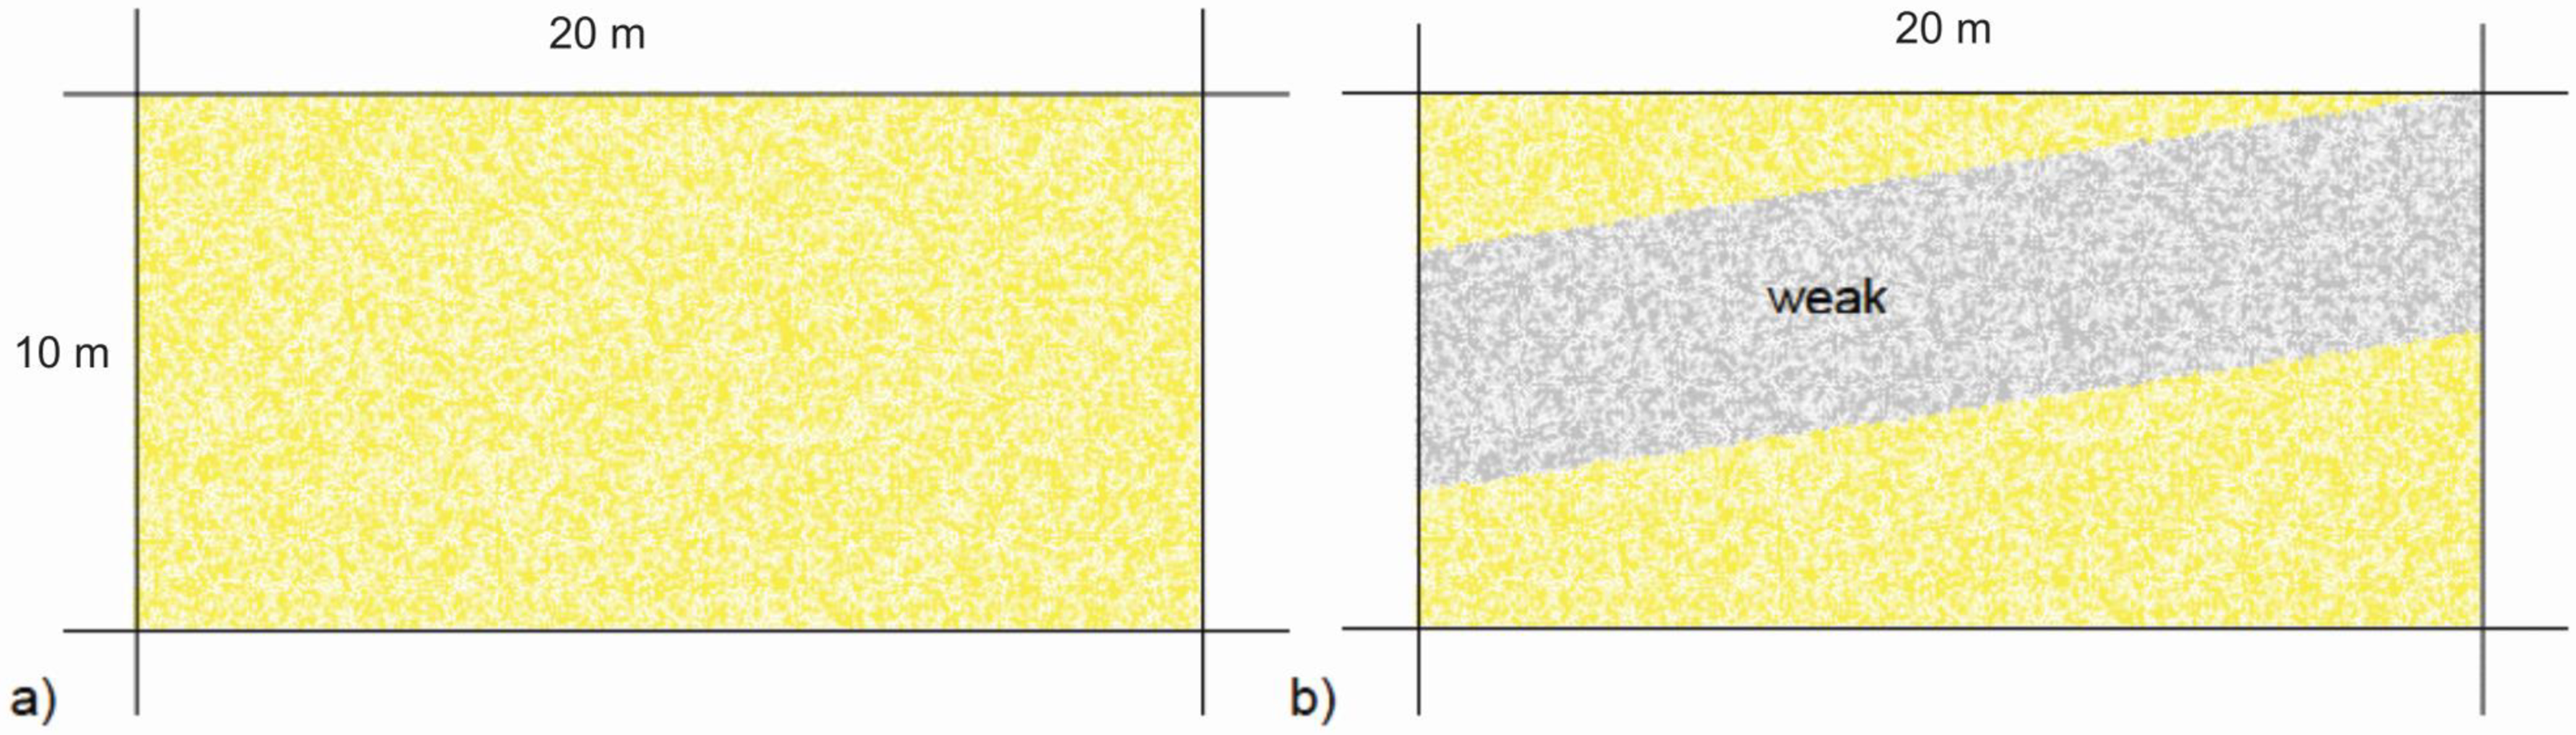
Bonded particle model (BPM) for a domains 1, 2, 4; b domain 3
Once the BPMs were constructed, the fracture traces, obtained by intersecting four longitudinal planes with the 3D-DFN model, were transferred to the BPMs. Figure 16 illustrates the four 2D SRM models of 10 × 20 m generated.

2D Synthetic rock mass (SRM) models for a domain 1, b domain 2, c domain 3, d domain 4
Effect of material flow impact on the ore pass wall damage
The generated SRM models were employed to quantify the impact-induced damage on ore pass wall for different rock mass domains along the ore pass. The ore pass was excavated in the SRM models. To compare the impact-induced damage by rock fragments on ore pass walls for different rock mass domains, five projectile rock fragments of various sizes were thrown against the ore pass walls. Collision of the projectile particles with the ore pass walls resulted in the generation of micro-cracks. This enabled the quantification of impact-induced damage in the rock mass domains along the ore pass walls. The diameter of the projectile rock fragments was selected as: 2.1 m (representing the largest rock boulders dumped into the ore pass), 0.9, 0.7, 0.4 and 0.2 m (representing the mode of rock fragments dumped into the ore pass). The mechanical properties listed in Table 5 were assigned to the projectile particles. Particles were thrown vertically against the ore pass wall with an impact velocity of 12 m s− 1. Figure 17a and b shows projectile particles hitting the rock domains 4 and 3 along the ore pass wall.
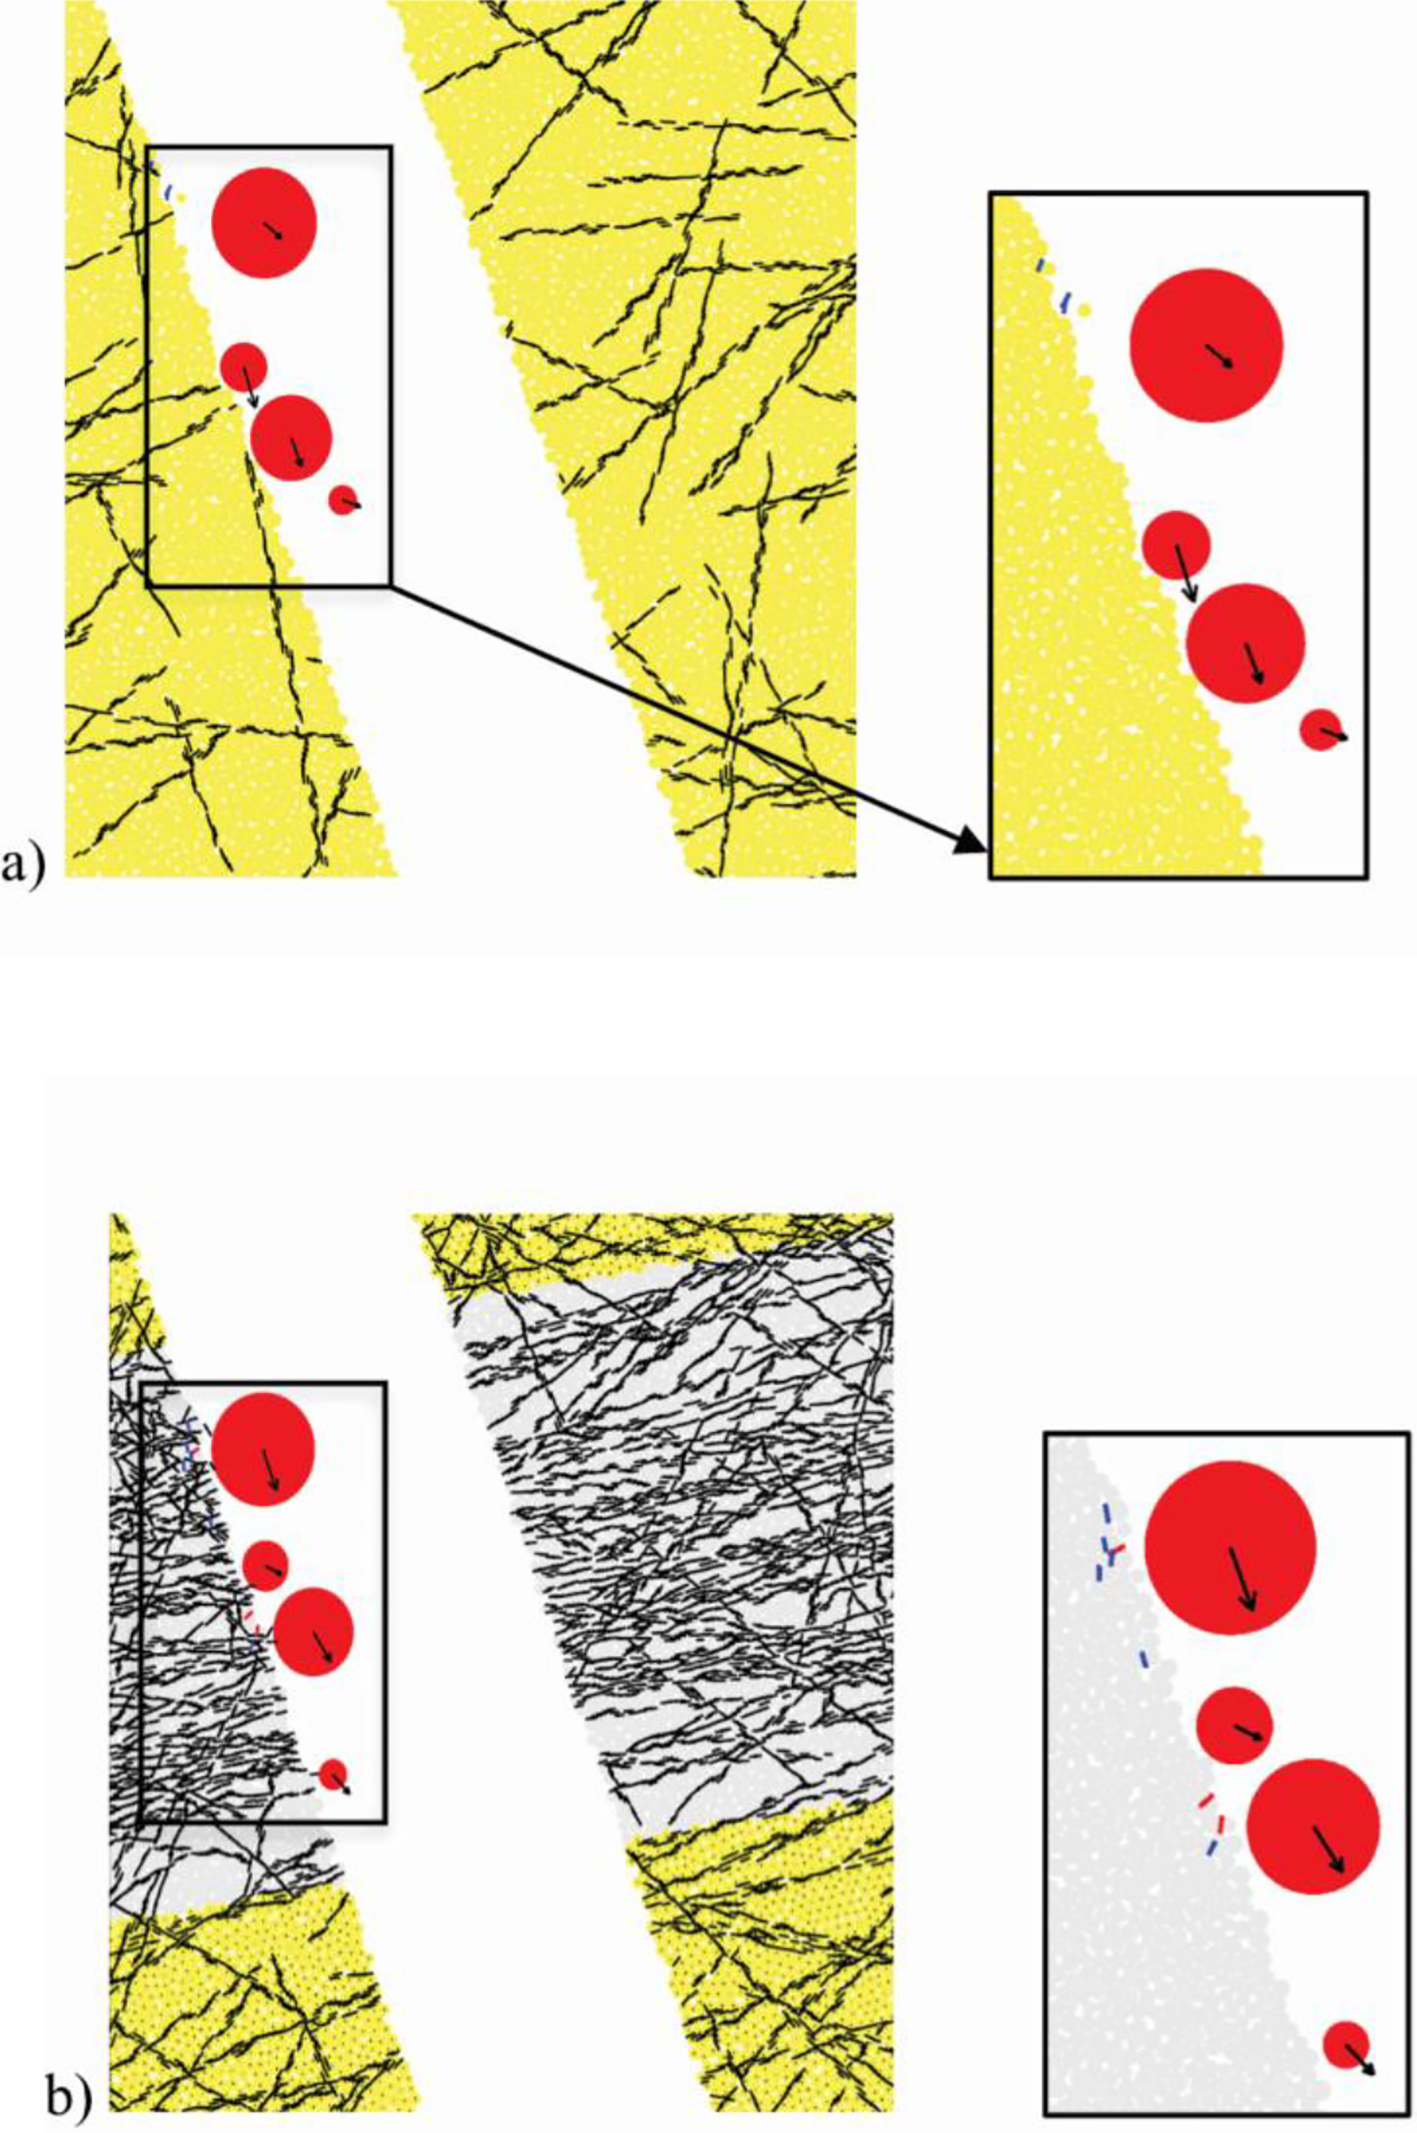
Projectile particles impacted a domain 4, b domain 3 along the ore pass wall
The inflicted damage by the projectile particles for different rock mass domains is presented as micro-cracks (the inter-particle bonds failed). The numbers of micro-cracks developed by the impact of projectile particles on the ore pass walls of different rock domains are summarized in Fig. 18. The results of this analysis demonstrated that there is a correlation between the extent of impact-induced damage on the ore pass walls and the size of projectile particles. The damage inflicted by the big boulder of 2.1 m diameter is considerably greater than other particle sizes. The maximum number of impact-induced micro-cracks was recorded in rock Domain 3. This implies that the impact-induced damage on the ore pass walls depends not only on the size of projectile particles striking the wall but also on the characteristics of the rock mass along the ore pass wall hit by the rock fragments. The key rock mass characteristics that control the impact-induced damage are the intact rock properties and the intensity of fracturing. Owing to a lower fracture intensity in Domain 4, the impact of projectile rock fragments on the ore pass wall resulted in minimal damage. No impact-induced damage was recorded on the ore pass wall by the impact of the smallest projectile particle (0.2 m).
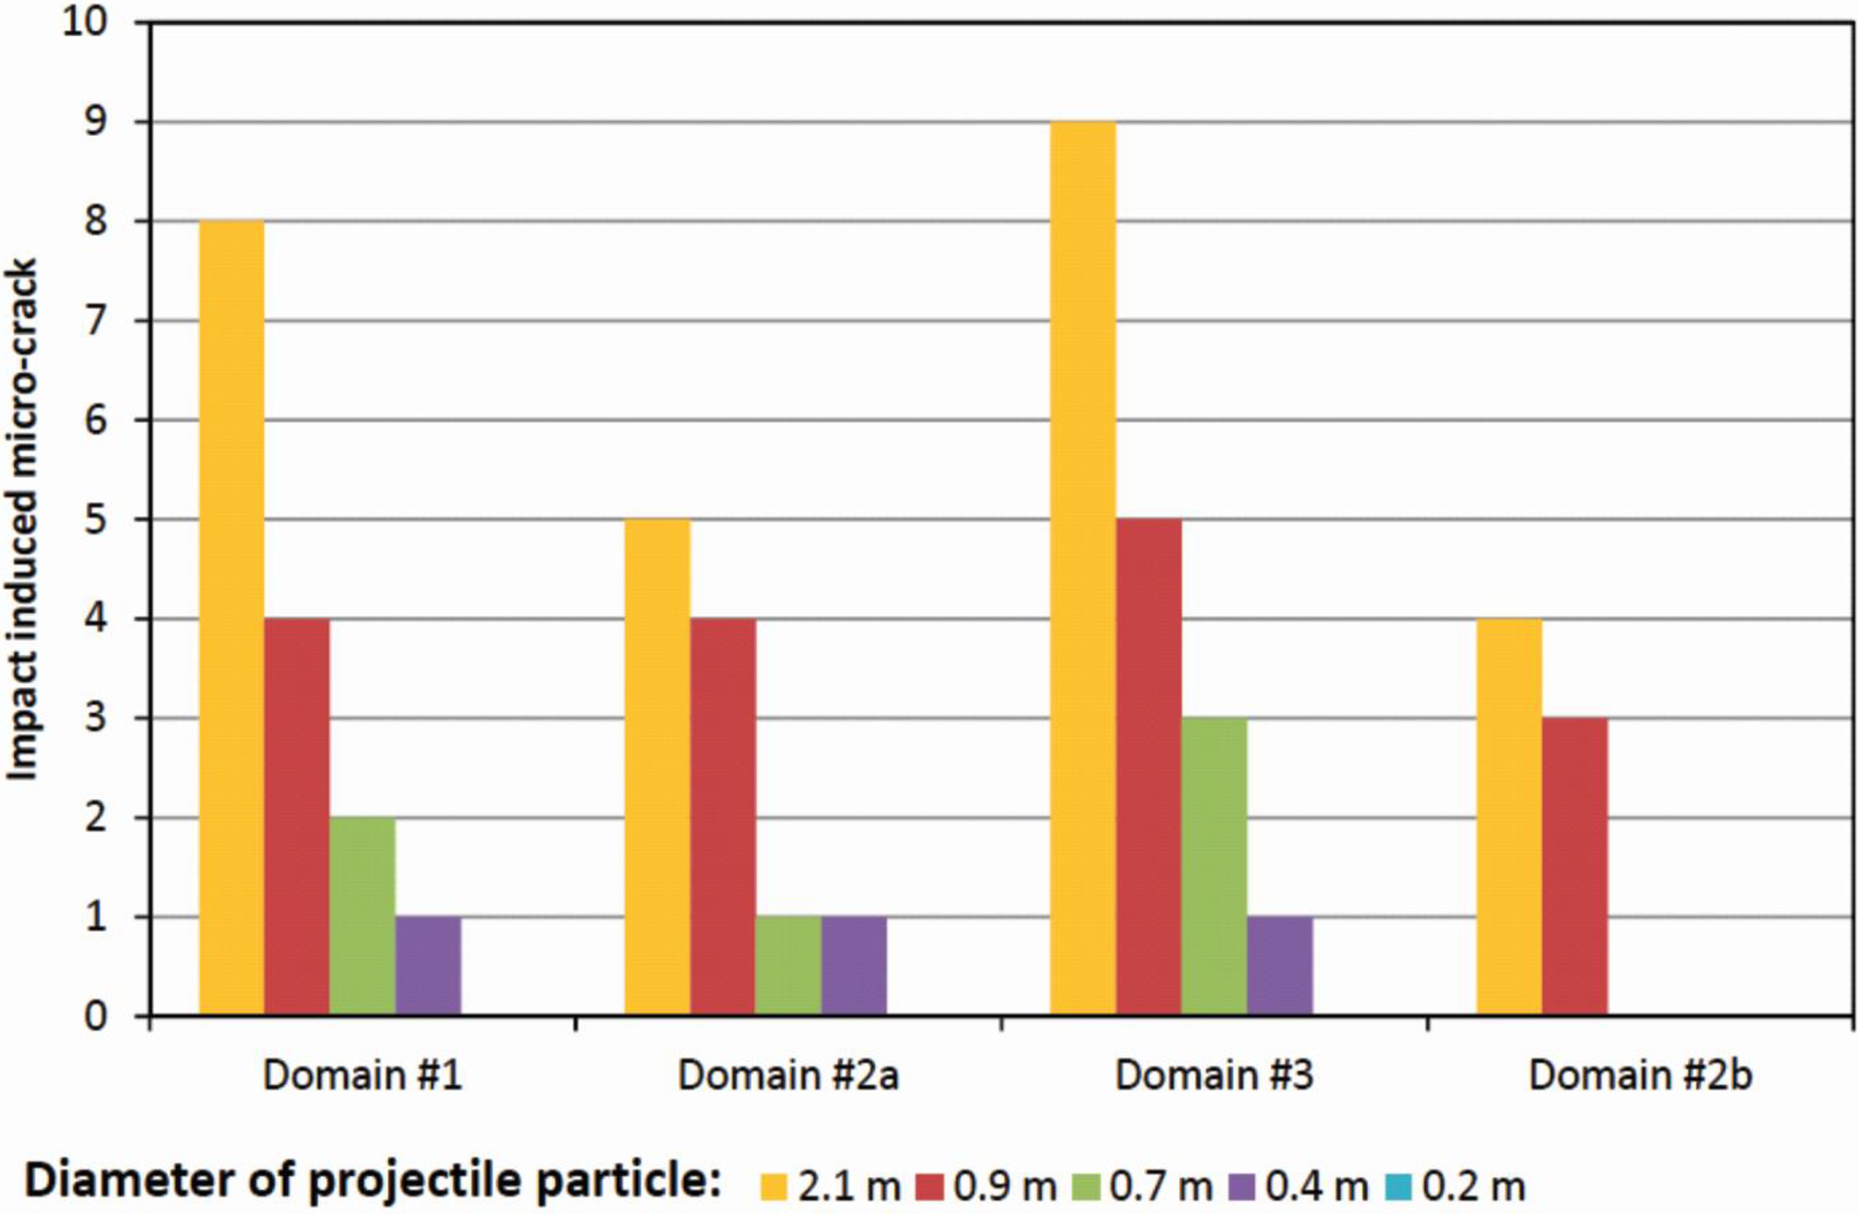
The number of micro-cracks inflicted by impact of the projectile particles for different rock domains
Rehabilitation
The useful working lifetime of an ore pass can be extended using rehabilitation, including reinforcement and surface support. This technique is employed where sufficient middling (pillar) exists between the ore pass and adjacent excavations to provide stability. The ore pass is reinforced to accommodate its expanded size and shape. Figure 19a and b present two examples of external ore pass reinforcement in underground mines. The first example (Fig. 19a) is presented by Singh (1973), where a comprehensive support system of grouted cable bolts, rebar and pre-stressed grouted rock bolts was installed from an access point to reinforce fractured zones around an existing ore pass system. The second example (Fig. 19b) shows the ore pass rehabilitation at Lockerby Mine near Sudbury reported by Clegg and Hanson (1992). Cable bolts were installed from an adjacent drift, in order to reinforce the rock mass surrounding the ore pass.
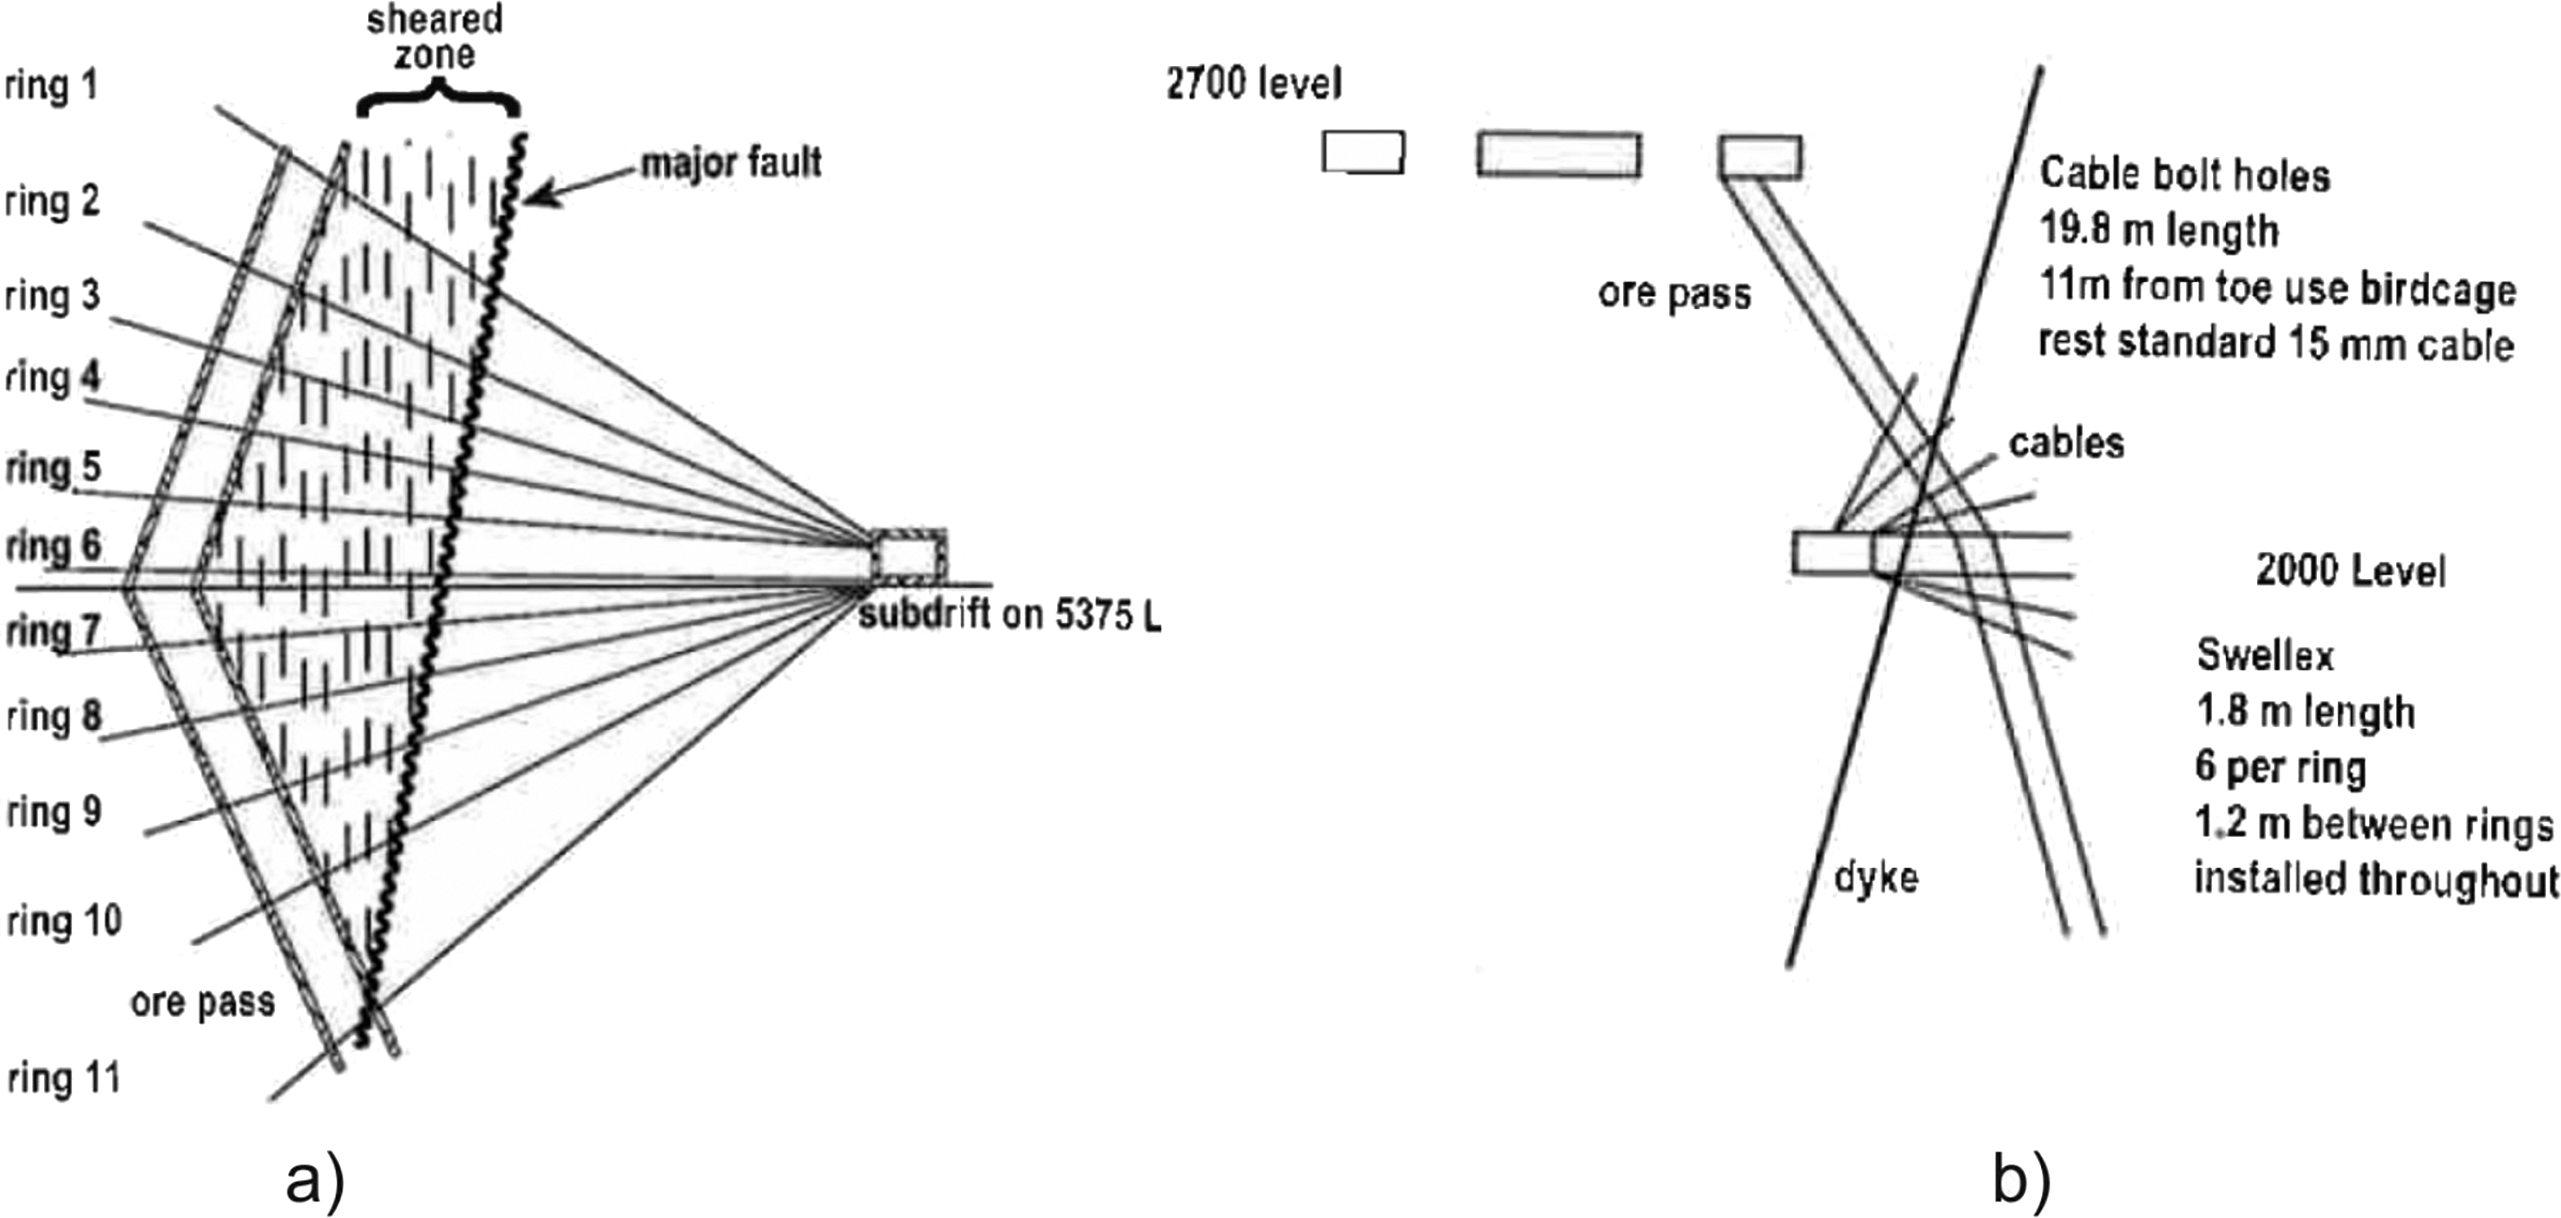
a Reinforcement of a fault zone near an ore pass using cable bolts, Singh (1973), b Reinforcement of an ore pass at Lockerby mine, Clegg and Hanson (1992)
In order to investigate the influence of rock mass reinforcement on the stability of the ore pass, a numerical model was constructed. Phase2 a two-dimensional finite element code developed by Rocscience Inc. was used. A longitudinal section was taken through the ore pass. It is recognized that the problem is clearly not suited for 2D plane strain analysis; hence the model was only used to compare alternatives with and without reinforcement. We have changed the term ‘Phase2’ to ‘Phase2’ model throughout the article.
The adjacent ramp was also introduced into the model. Once the dimensions of the excavations were developed, the model was divided into four zones representing the four Domains along the ore pass. Using the fracture network option in Phase2, discrete fracture sets were generated for each rock mass domain based on the structural characteristics of each domain. The material properties used for the numerical analysis include the elastic properties of the rock mass in each domain. Since the rock mass is represented by intact rock blocks and discrete joints, the elastic parameters (Elastic modulus and Poisson ratio) of the intact rock were included in the numerical analysis. A friction angle of 30° and zero cohesion were considered for the joint properties. The model accounted for cable bolts installed from the adjacent ramp, in both the hanging wall and footwall side of the degraded zone of the ore pass. Six cables were installed on each side. The properties of cable bolts are listed in Table 7.
Properties of the cable bolts used in the Phase2 model

The ore pass dimensions were expanded in two stages representing the observed progressive ore pass wall degradation. This allowed the cable bolts to be loaded by the rock mass deformation. Figure 20 presents the Phase2 model developed for the ore pass. A gravity field stress was used based on the ground surface elevation.
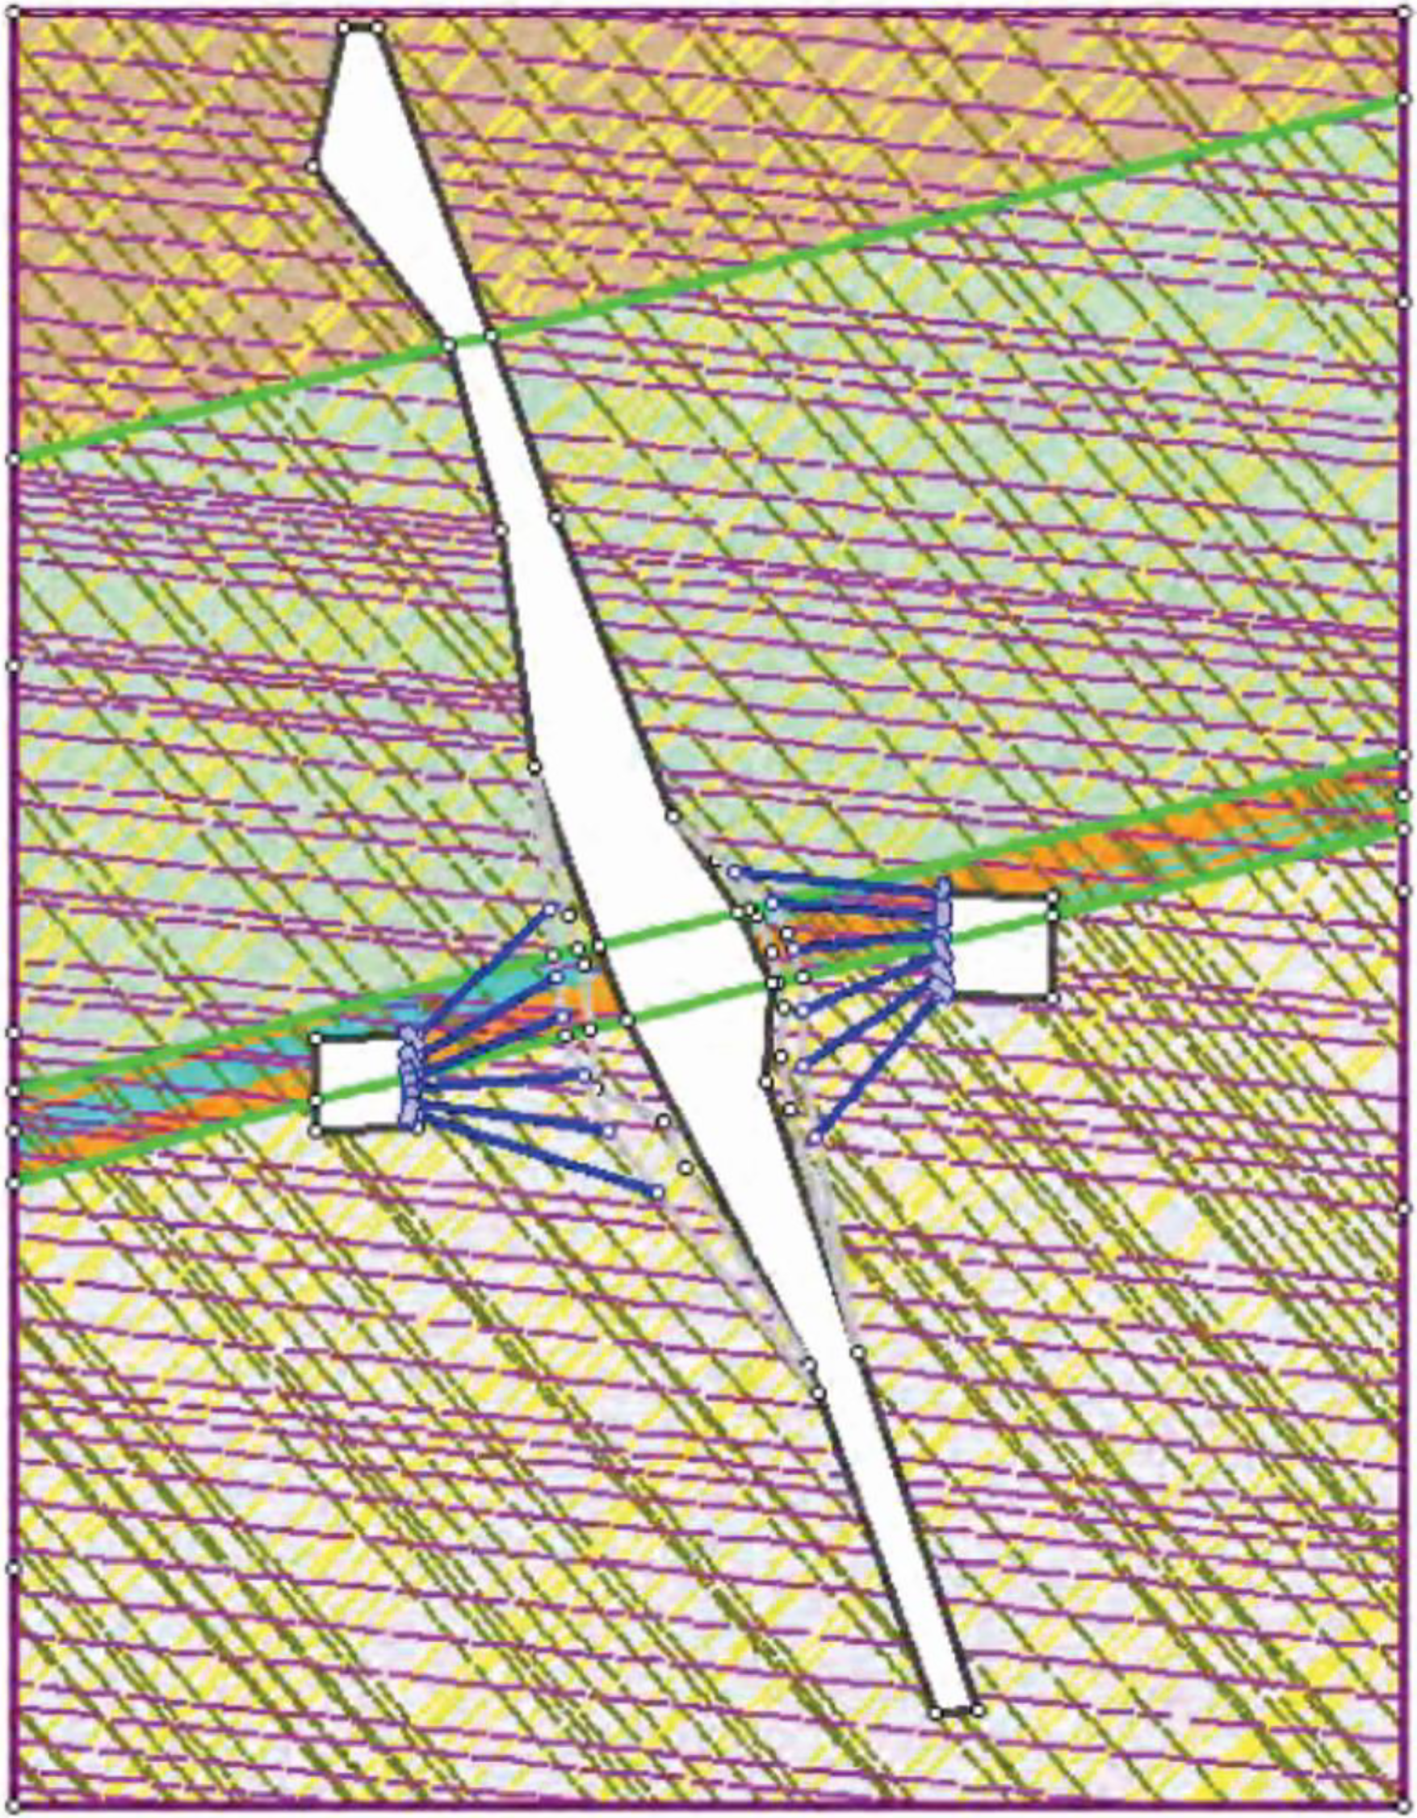
Phase2 model developed for the ore pass
Finally, in order to compare how the rock mass reinforcement could improve the stability of the ground around the ore pass, the same numerical simulation was performed without the cable bolts. Figure 21 presents the comparison of the total displacements for the model of the rehabilitated ore pass and the one without cable bolts. The reinforcement of the rock mass around the ore pass with cable bolts reduces (1) the total displacement of the rock mass around the ore pass and (2) the number of yielded joints near the ore pass.
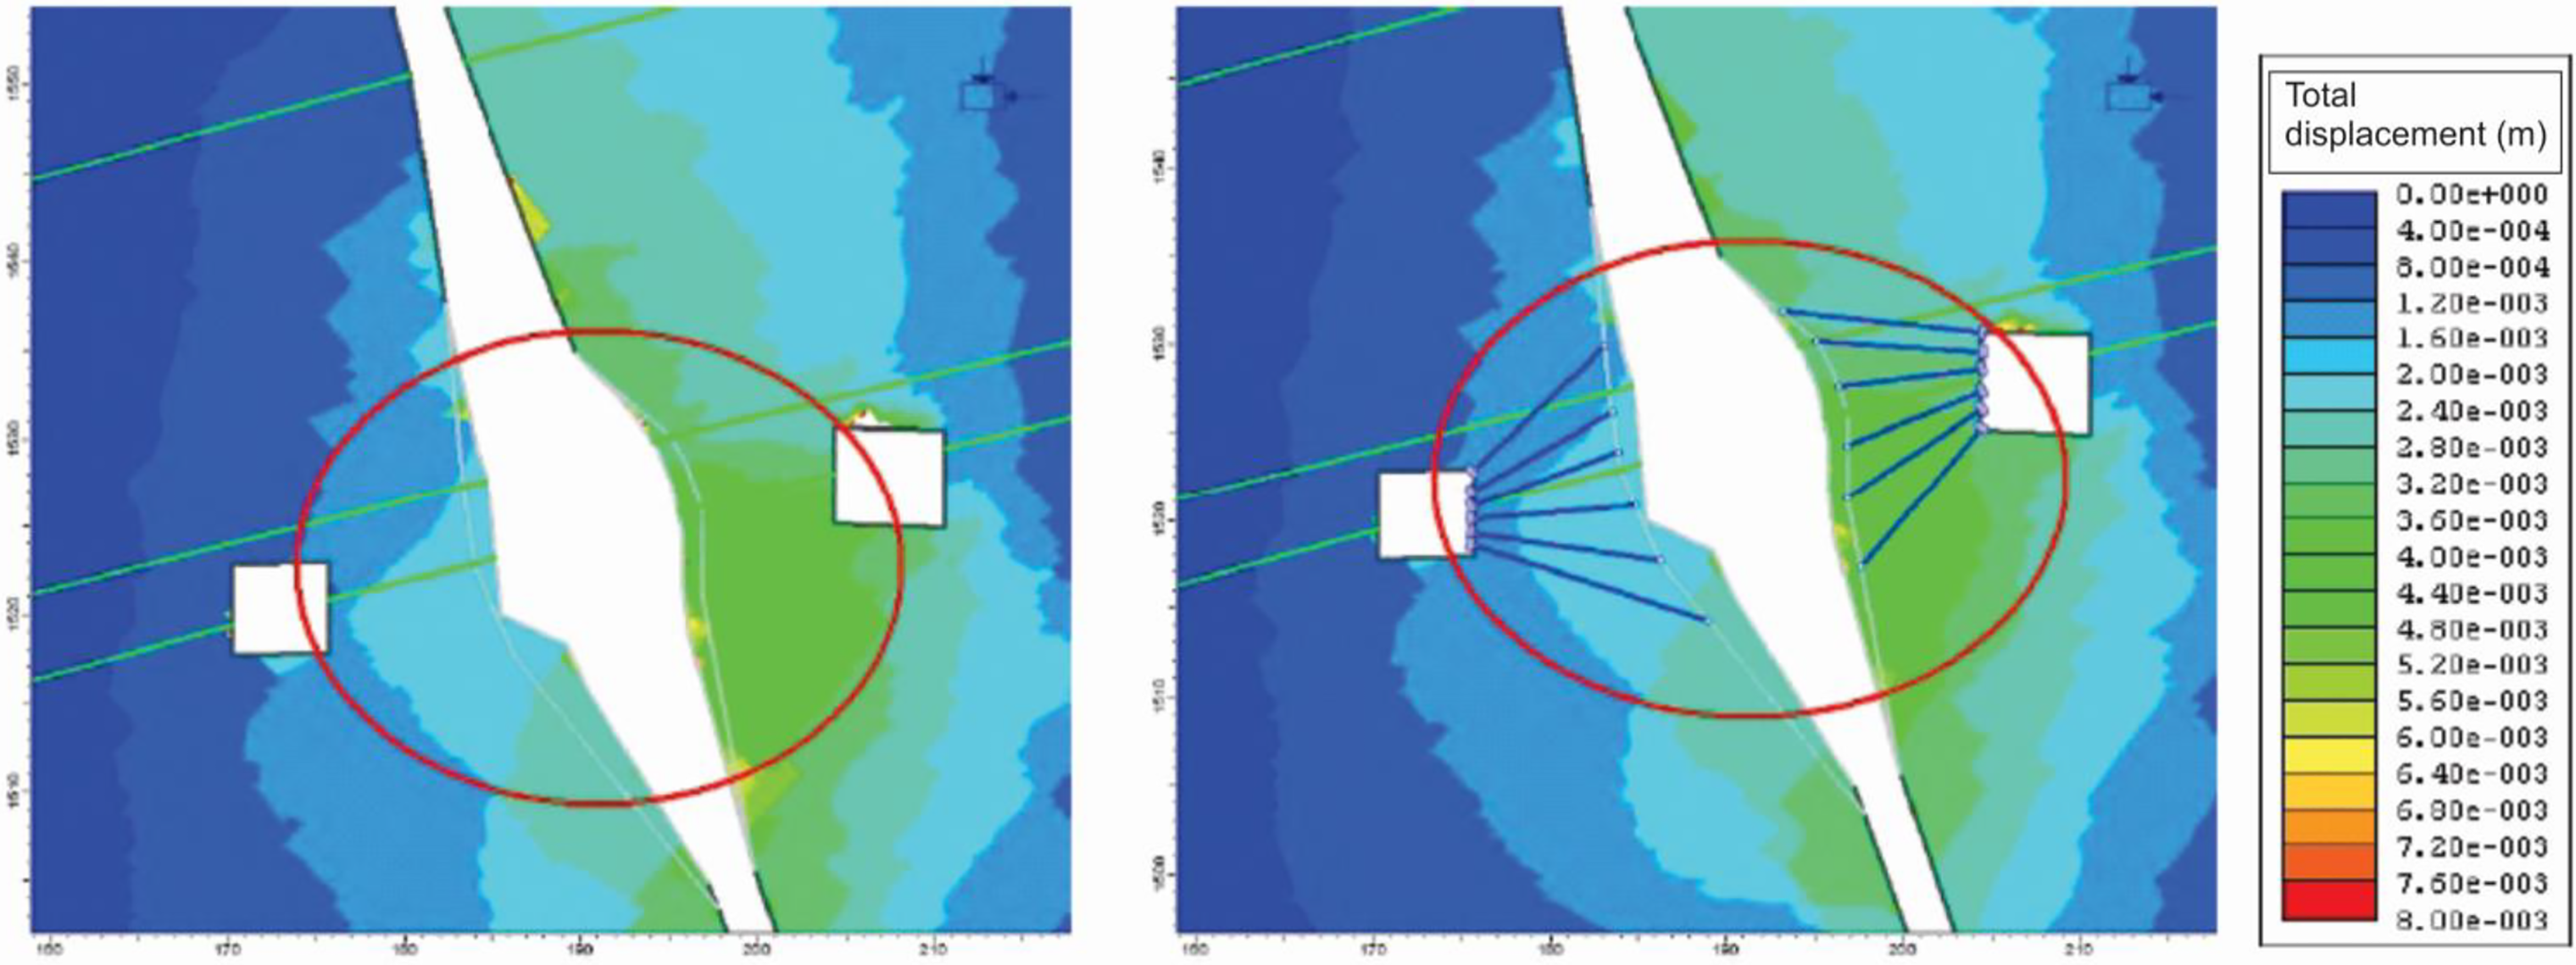
Total displacement around the ore pass wall without and with reinforcement
The numerical analysis demonstrates that reinforcement of the degraded zone in the ore pass, by installing cable bolts from the access ramp, can enhance the structural integrity of the ore pass and consequently increase the useful lifetime of the ore pass.
This recommendation was successfully implemented by the mine in 2011. Since then, CMS undertaken in the ore pass shows that the ore pass degradation rate has significantly decreased. The installed reinforcement clearly improved the structural integrity of the ore pass.
Conclusions
This paper has documented the geomechanical investigations and analyses performed to evaluate the stability and longevity of an ore pass in an underground mine in Canada. Geotechnical data collected from a borehole drilled close to the ore pass and from the underground mine mapping were used to characterize the rock mass around the ore pass. This was followed by characterization of transiting materials dumped into the ore pass.
A DFN model was developed for the study area based on the collected field data. Kinematic analysis of rock wedges formed around the ore pass indicated that structurally controlled failure was not the only failure mechanism for the ore pass. A DFN model was used to develop 2D synthetic rock masses of four rock mass domains. The maximum impact-induced damage was recorded for the rock mass Domain 3 (representing the fault zone). The damage inflicted by the big rock boulder of 2.1 m in diameter is considerably greater than from the other particle sizes.
The installation of a grizzly (1x1 m) on the ore pass collar controlled the size of rock fragments dumped into the ore pass. This approach, in combination with the installation of cable bolts around the degraded ore pass zone, contributed to controlling the ore pass degradation. The mine reports that the results of this investigation contributed to the management of an important material transfer issue.
This work employed 2D numerical models, taking advantage of the shorter execution times as a result of the simplified geometry. It is recognized that these simplifications have limitations. Use of the PFC2D model, for material impact simulation, may influence the flow and interaction of particles in the ore pass and consequently the particle velocity. The 2D finite element model used to determine the stability of the ore pass is a simplification of the 3D case, making it difficult to calibrate with respect to the displacements of the ore pass walls. This approach was acceptable as the purpose of this study was to compare the influence of reinforcement on the stability of the ore pass.
Acknowledgements
The authors would like to acknowledge the collaboration of industrial partners.
This paper was originally presented at the first International Conference on Discrete Fracture Engineering (DFNE 2014) (19–22 October 2014, Vancouver, BC, Canada) and has subsequently been revised and extended before consideration by Mining Technology.