
Abstract
Two different pre-conditioning techniques have been applied at the Sur Andes mine sector (SuaPi) of the El Teniente mine in order to improve caving performance of the primary copper ore, which can be considered as a typical heavily veined massive, competent and unfractured rock masses. Hydraulic fracturing (HF) and blasting under confined conditions (BUCC) have been applied to a significant portion of the ore column to be mined. Both techniques introduce new open fractures into the massive rock mass with the aim of improving fragmentation performance at the draw points.
A range of rock mass characterisation activities were undertaken before and after pre-conditioning took place in order to evaluate any change in rock mass condition. These geotechnical campaigns included both drill core logging and borehole camera (BHC) inspection and mapping. Mapping of the borehole walls allow the identification of the massive rock mass including the healed veins, the sub-horizontal HF fractures and also the sub-vertical (both radial and concentric to the blast hole) BUCC fractures.
Using these rock mass characterisation properties, a Discrete Fracture Network (DFN) model was developed for both HF and BUCC fractures in order to quantify the occurrence of new open fractures within the primary ore. The DFN models allow the estimation of in situ fragmentation following preconditioning and these data were compared with fragmentation performance measured at the draw points in the SuaPi mine Sector. This paper presents the results of the pre-conditioning on the rock mass, the DFN modelling procedure undertaken (particularly the BUCC fractures), the characterisation of the preconditioning intensity and how it is related to the fragmentation performance at the SuaPi mine sector.
Keywords
Introduction
With ever-increasing global demand for mineral resources, mass mining methods for large lower-grade deposits (e.g. block and panel caving) are becoming more attractive. A large-scale block or panel cave mine constitutes an example of a high volume rock-factory, whose success and viability are dependent to a large extent on the caveability of the deposit and the fragmentation of the ore material. To help mitigate the risks associated with unfavourable cave propagation and fragmentation in stronger competent rock masses, pre-conditioning through hydraulic fracture generation or confined blasting is increasingly being used. To date, there has been little in the way of testing and quantification of the actual results of the various pre-conditioning methods that are being utilised for de-risking critical aspects of the caving process. The work described here is part of a wider study to directly evaluate how pre-conditioning modifies the rock mass and what impact this might have on operational cave issues.
The primary copper ore at the El Teniente mine is described as very competent and massive; it exhibits a brittle behaviour, often failing violently under high stress conditions, (Rojas, Cavieres, Dunlop and Gaete 2000). This description is consistent with the geological description of a rock mass having few or no discontinuities (joints) by the definition provided by International Society of Rock Mechanics (ISRM 1981). The only true discontinuities are faults although they are widely spaced within the rock mass. The primary copper ore has a high frequency of veins, in which the copper mineralisation is hosted typically as vein network structures or stockwork (Fig. 1).
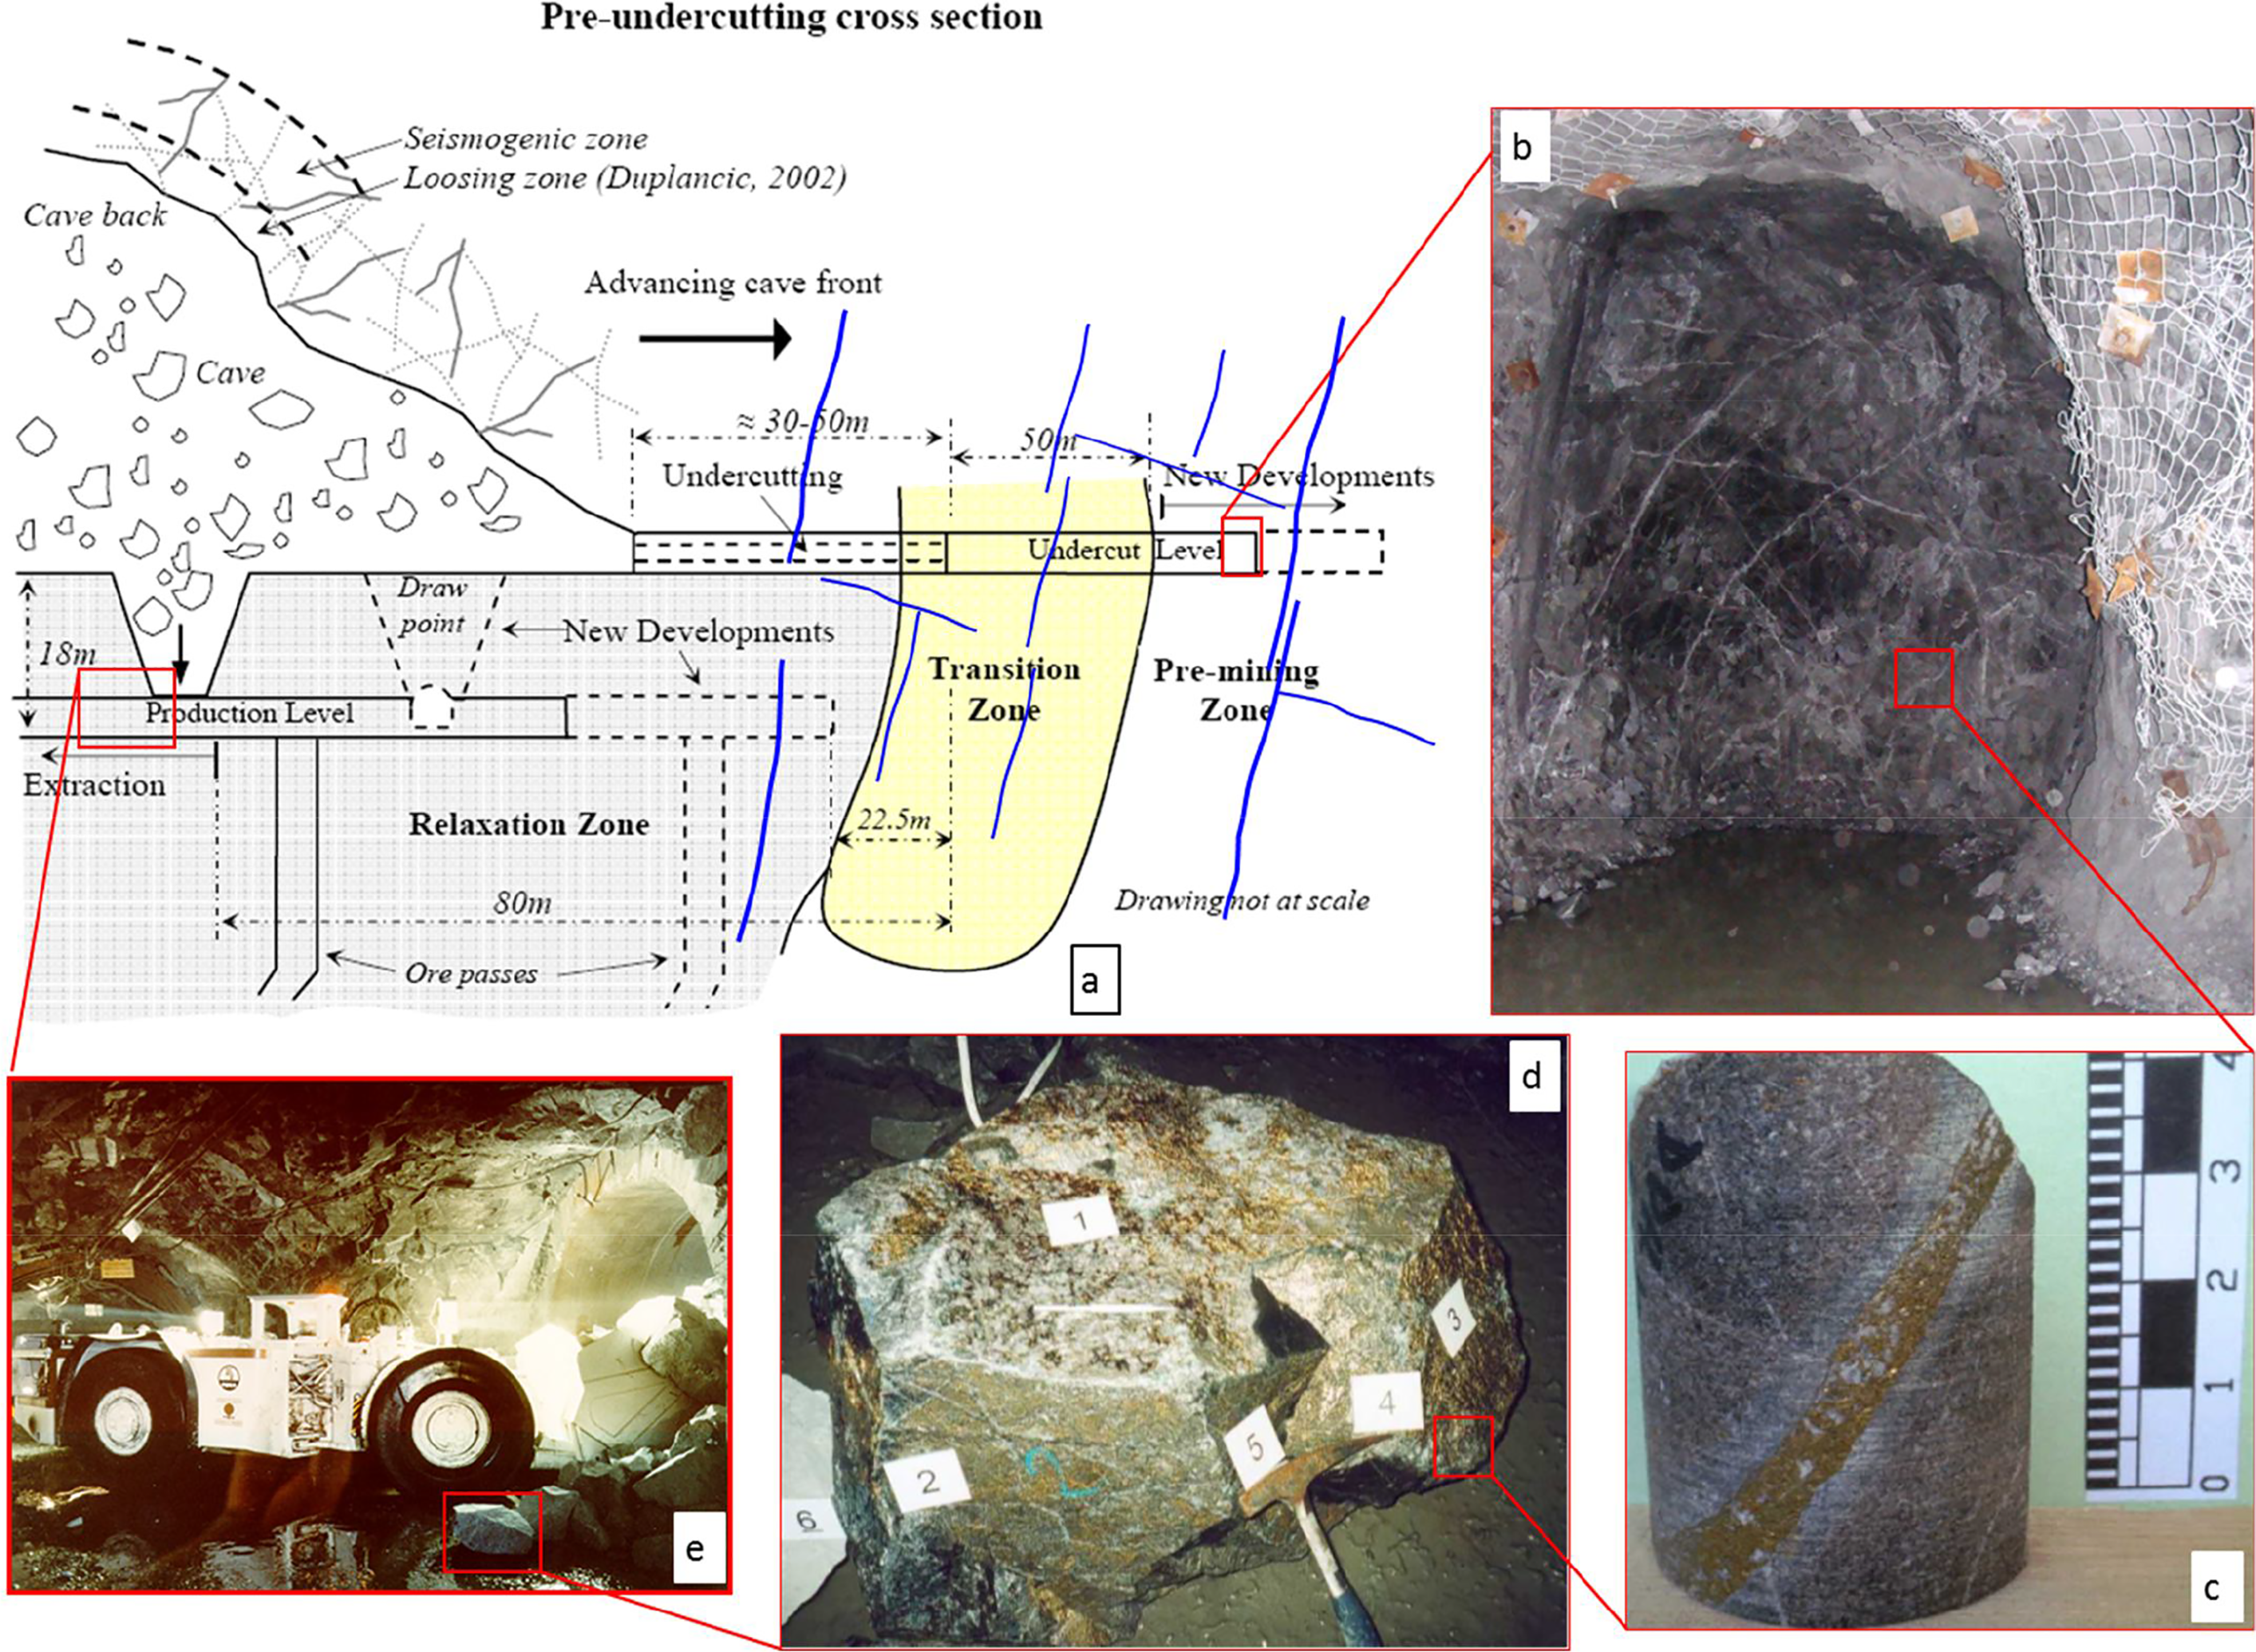
Rock mass and mining method at the El Teniente Mine. a Cross-section of pre-undercut mine method; b Intense vein network “stockwork” at a development ahead of the cave front; c Laboratory scale sample showing weak veins; d Weak veins as faces of caved rock blocks; e LHD at the production level loading mine production From Brzovic and Villaescusa 2007
It has been previously observed that vein mineralogy plays a big part in rock mass fragmentation at El Teniente, with soft veins containing weak minerals (chalcopyrite and anhydrite mainly) control the disassembling of the rock mass during caving (Brzovic and Villaescusa 2007; Brzovic 2009). To help reduce the likelihood of unfavourable caving performance within this very strong and massive rock mass, several pre-conditioning methods have been applied.
Pre-conditioning of the rock mass
Overview
Pre-conditioning has been applied at El Teniente for a number of years, initially aimed at reducing mining-induced seismicity in this seismically very active mine. However, more recently it has been used as a method to improve caveability and fragmentation of the very strong and massive rock mass.
The main pre-conditioning techniques available are hydraulic fracturing (HF) and also confined blasting (BUCC). Hydraulic Fracturing has been applied mine wide since 2008, whereas the confined blasting approach has only been applied within more limited trials. The focus of this paper has three main goals:
to use a Discrete Fracture Network (DFN) approach to characterise and reproduce the fracture observations of the BUCC pre-conditioning applied at the Sur Andes Pipa (SuaPi) mine sector; to build a block model of preconditioning intensity as the sum of all new open fractures created by the HF and BUCC fracturing processes modelled as explicit fractured network; and to correlate the preconditioning intensity with the fragmentation performance measured during mining.
This work primarily relates to the Dacite rock type (Fig. 2), which is the stronger and more massive rock mass for caving at the El Teniente mine (Brzovic and Herrera 2011; Brzovic et al. 2014c). This paper is a combination of analysis of the original papers already published in Brzovic, Hurtado and Marin (2014a) and Brzovic et al. (2014b).
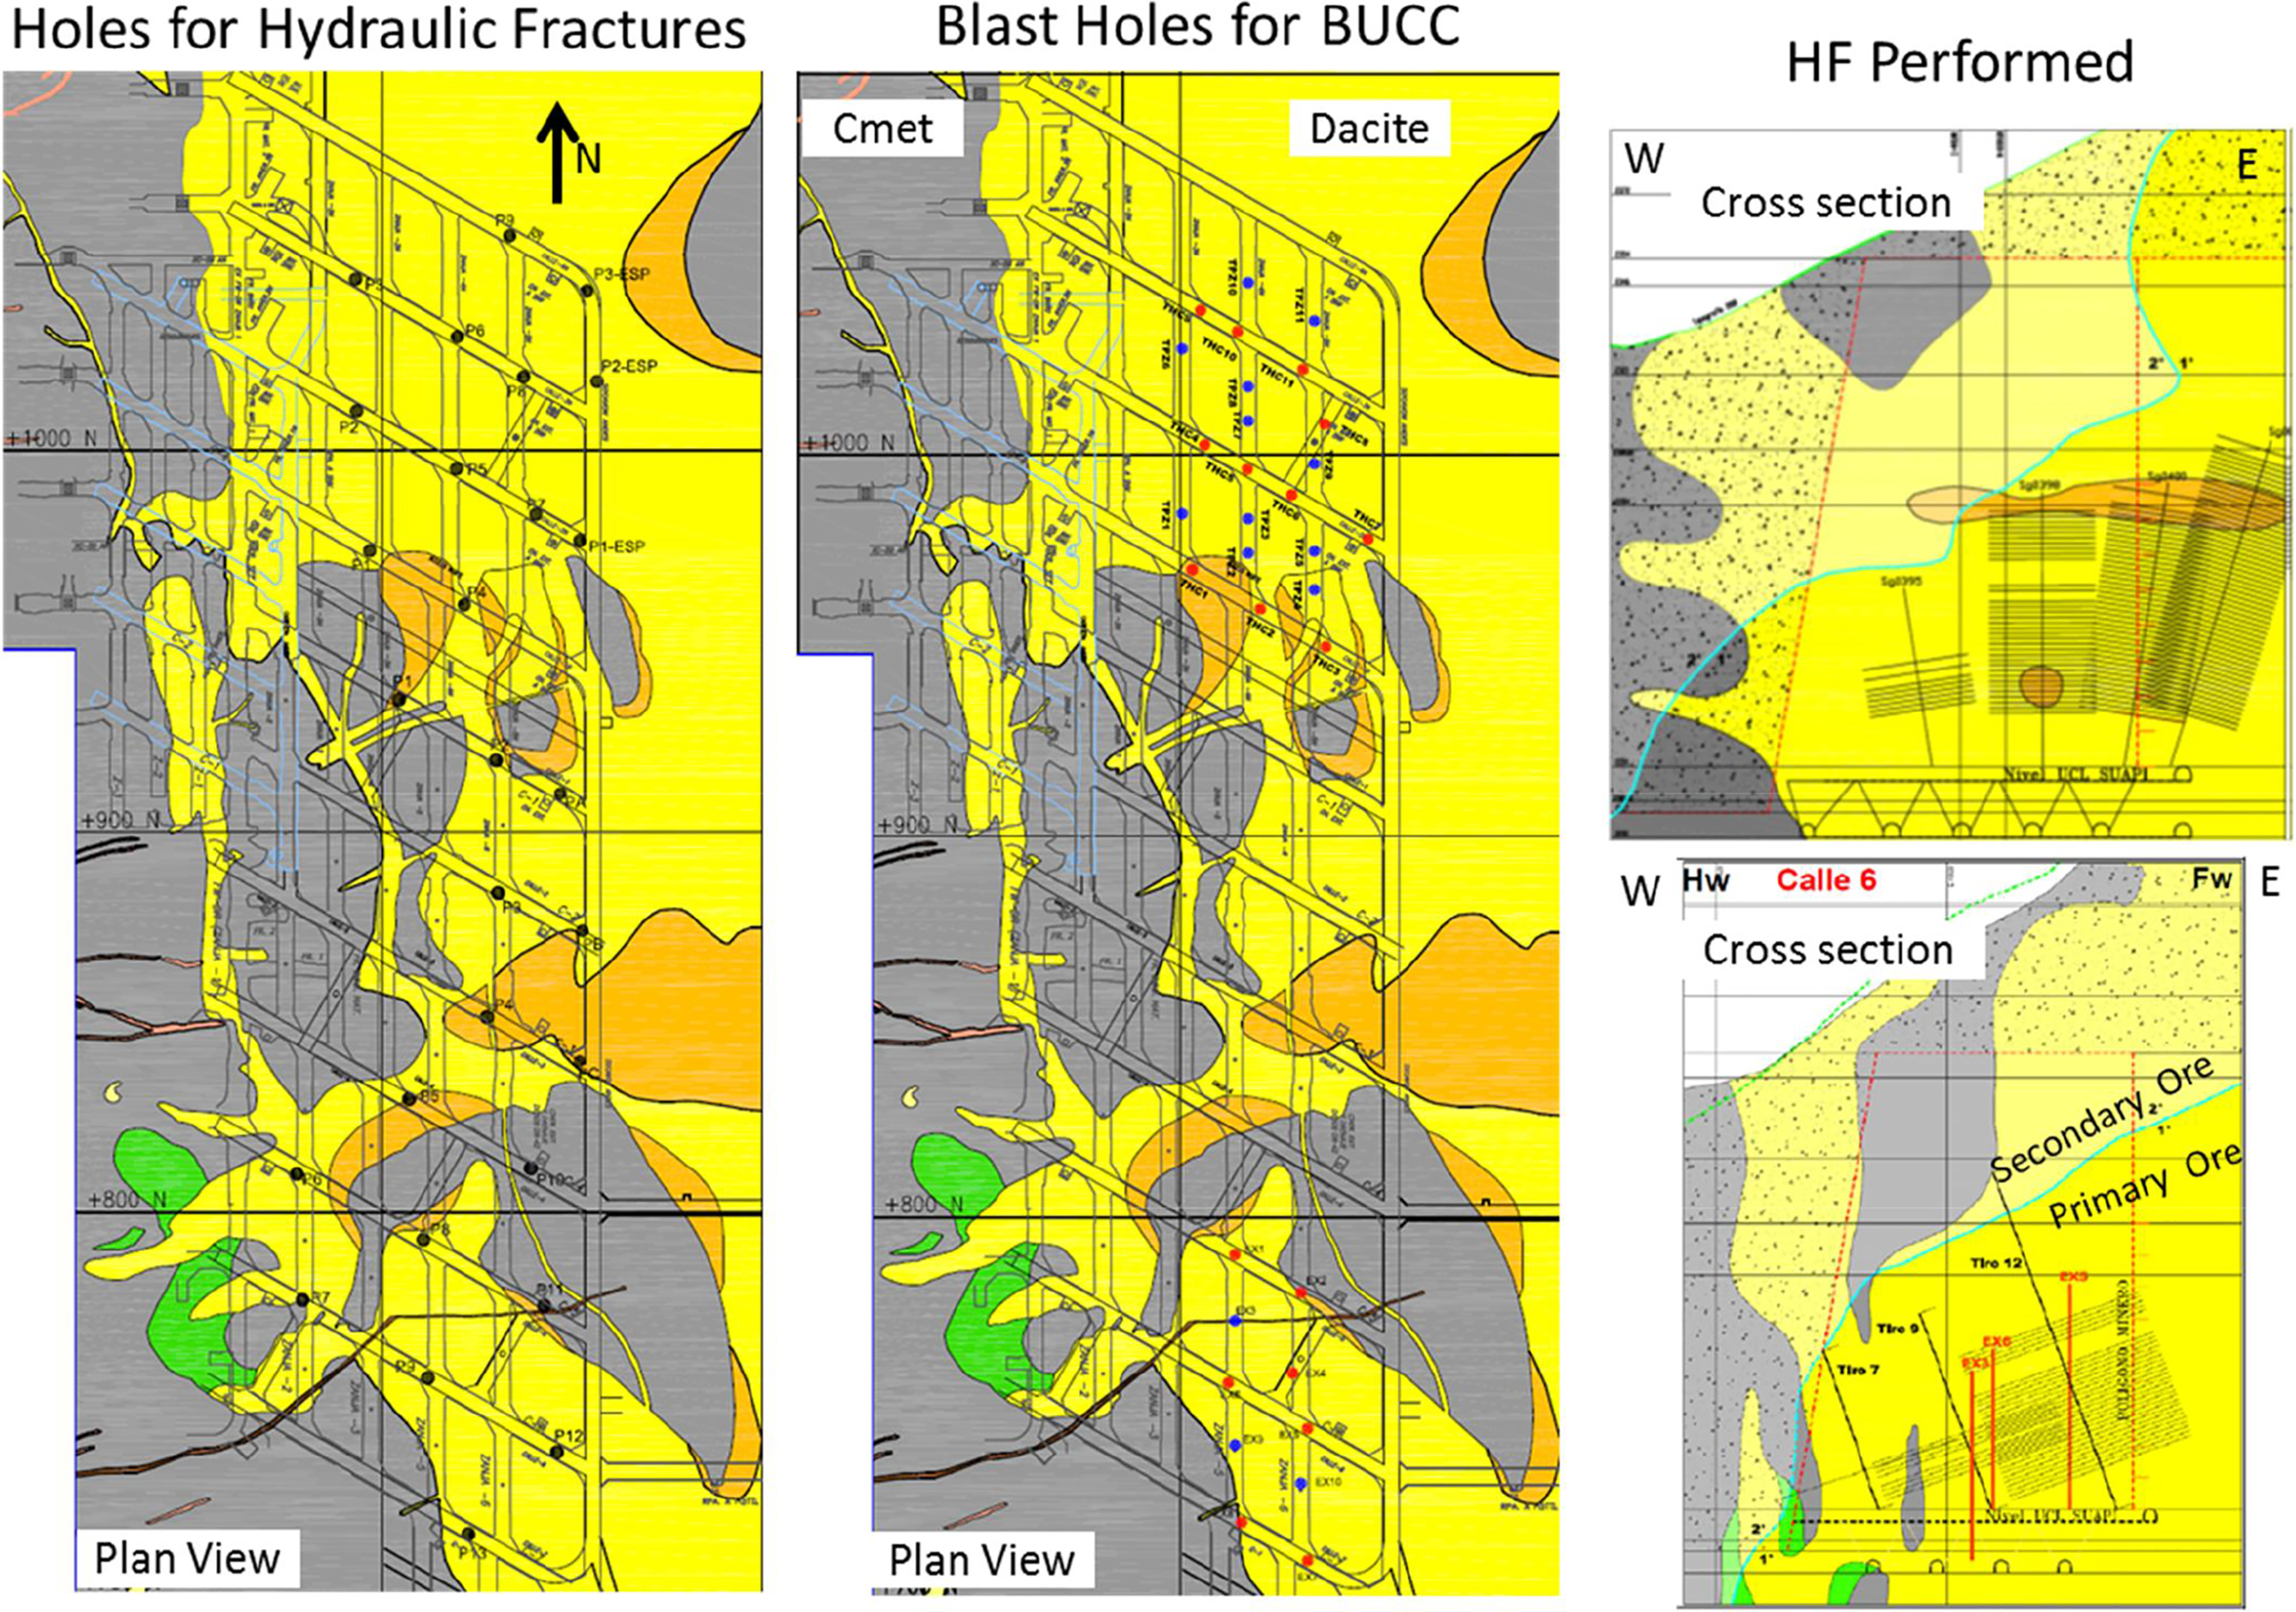
Plan views and cross-sections of Sur Andes Pipa mine sector at the El Teniente mine. Hydraulic Fracturing (HF) holes (black dots and lines) and blasting under confined conditions (BUCC) blast holes (blue and red dots and red lines) are shown. Hydraulic Fracturing fractures performed are also displayed (black lines perpendicular to HF holes in cross-sections)
Pre conditioning strategies
Preconditioning by both techniques was not consistently applied at SuaPi mine sector, because HF injection holes and BUCC blast hole were placed with different spacings through the entire Dacite rock mass. Blasting under confined conditions blast holes were drilled with a closer spacing (i.e. a higher intensity of holes) in the northern area in comparison to the southern area. Blasting under confined conditions blasting procedure was also varied with more blast holes being detonated at the same time in the northern area of the mine sector. Hydraulic fracturing was also not consistently spaced through the column height, because some HFs could not be created as a result of operational issues as can be seen in geological cross-section (Fig. 2).
Pre and post pre-conditioning rock mass characterisation
Both before and subsequent to a BUCC blast, a number of boreholes were cored with the extracted core log and borehole camera (BHC) record being used to identify and to characterise the in situ rock mass and subsequent induced rock damage. Rock damage was determined from changes in RQD and pre-conditioning fractures were identified based upon their measured geometric characteristics, location and orientation. Recorded observations of RQD with distance from the BUCC holes are shown in Fig. 3. Owing to the evolving nature of the pre-conditioning trials, the same data was not uniformly acquired across the whole of the mine sector. In the southern area, the three pre and six post-BUCC blast drill cores were only manually logged. In the northern area, only core from the 4 post-BUCC blast holes was logged, with the boreholes also being inspected with BHCs. In between these two sub sectors, only HF was implemented (Fig. 2).
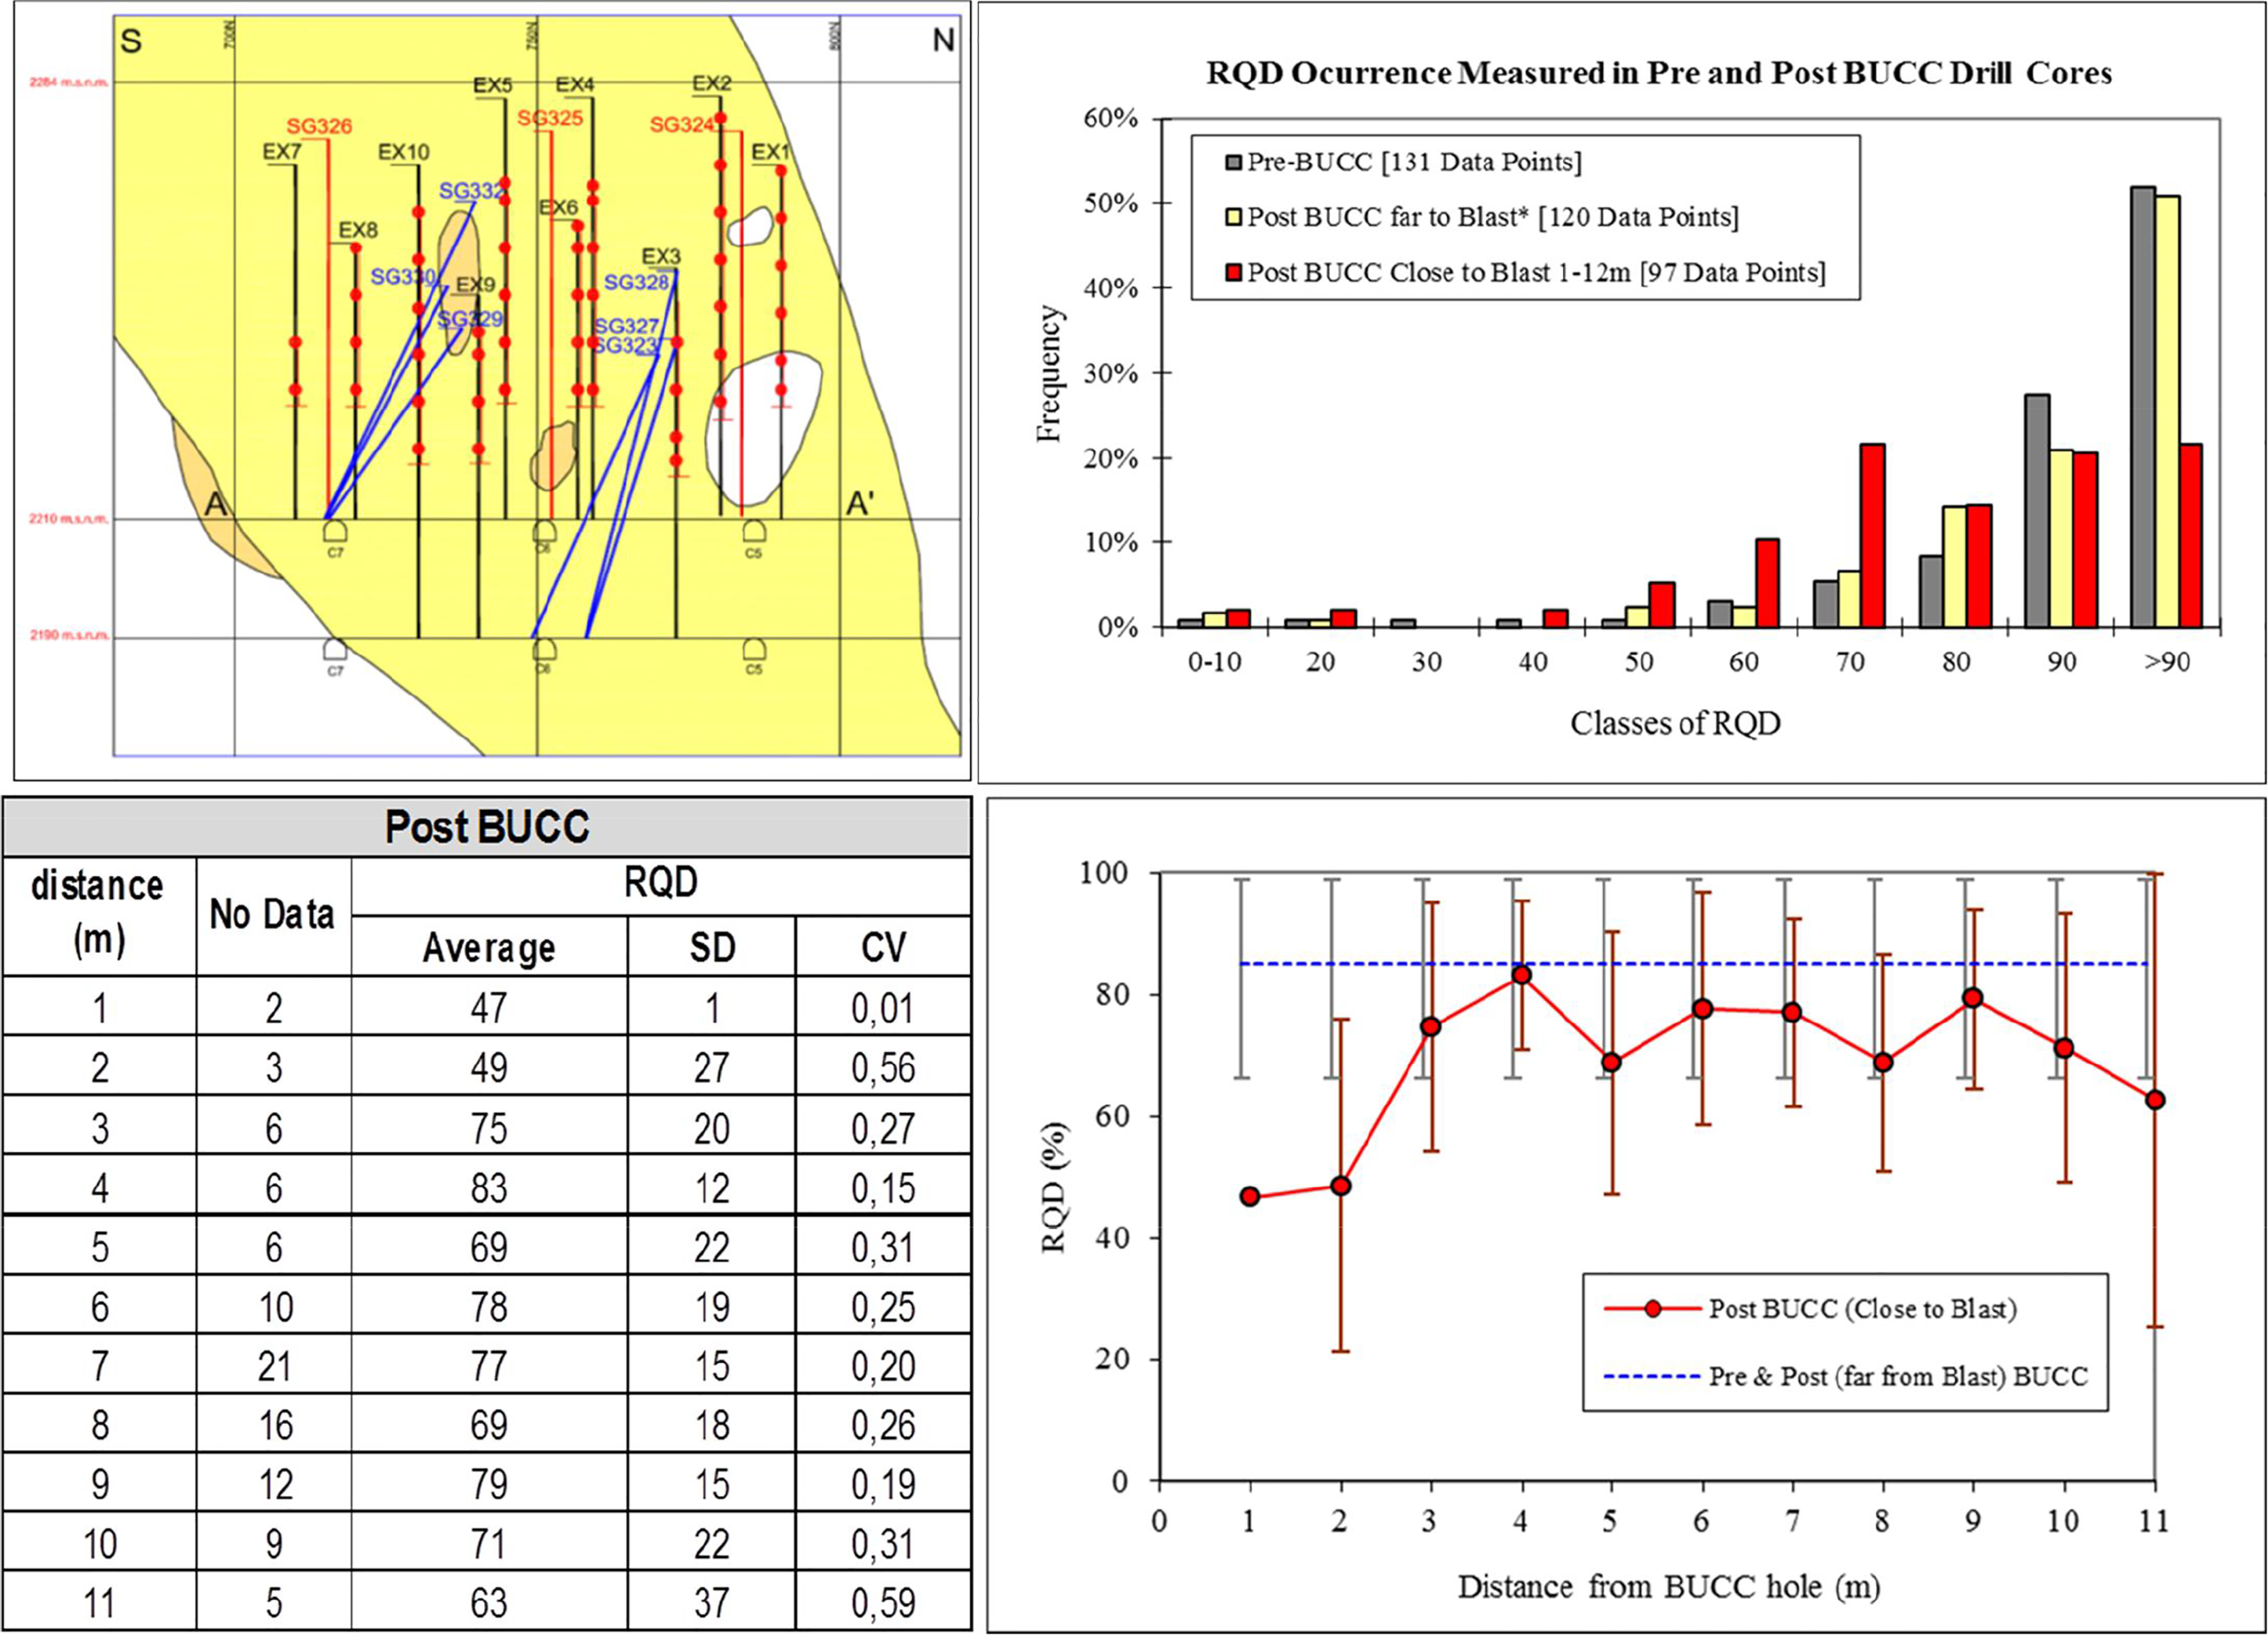
RQD measurement and core information. Top left, Location of pre (red lines) & post (blue lines) blasting under confined conditions (BUCC) drill cores of the South Trial in a cross-section, black lines are blast holes, all within dacita rock type (yellow). Top right, Statistical data analysis of RQD pre & post-BUCC, which also includes post-BUCC data far from the blast. Bottom right, Statistical data analysis of RQD post-BUCC against distance from the blast. Bottom left, Table of RQD data post-BUCC
Hydraulic fracturing fracturing and BUCC blasting resulted in the creation of new and fresh sets of open fractures that were not observed in the primary ore before pre-conditioning. Blasting under confined conditions fractures tend to have sub-vertical orientation (radial and concentric to the blast hole) and conceptually are similar to a typical pre-split blasting pattern with the creation of a few simple fractures rather than extensive micro cracks development within the intact rock (Fig. 4). HF fractures tend to have a more sub-horizontal orientation that in most cases, cross-perpendicular to BUCC fractures. It has also been noticed that the roughness of HF-induced fractures is less than the BUCC as observed in both core and BHC (Fig. 4).
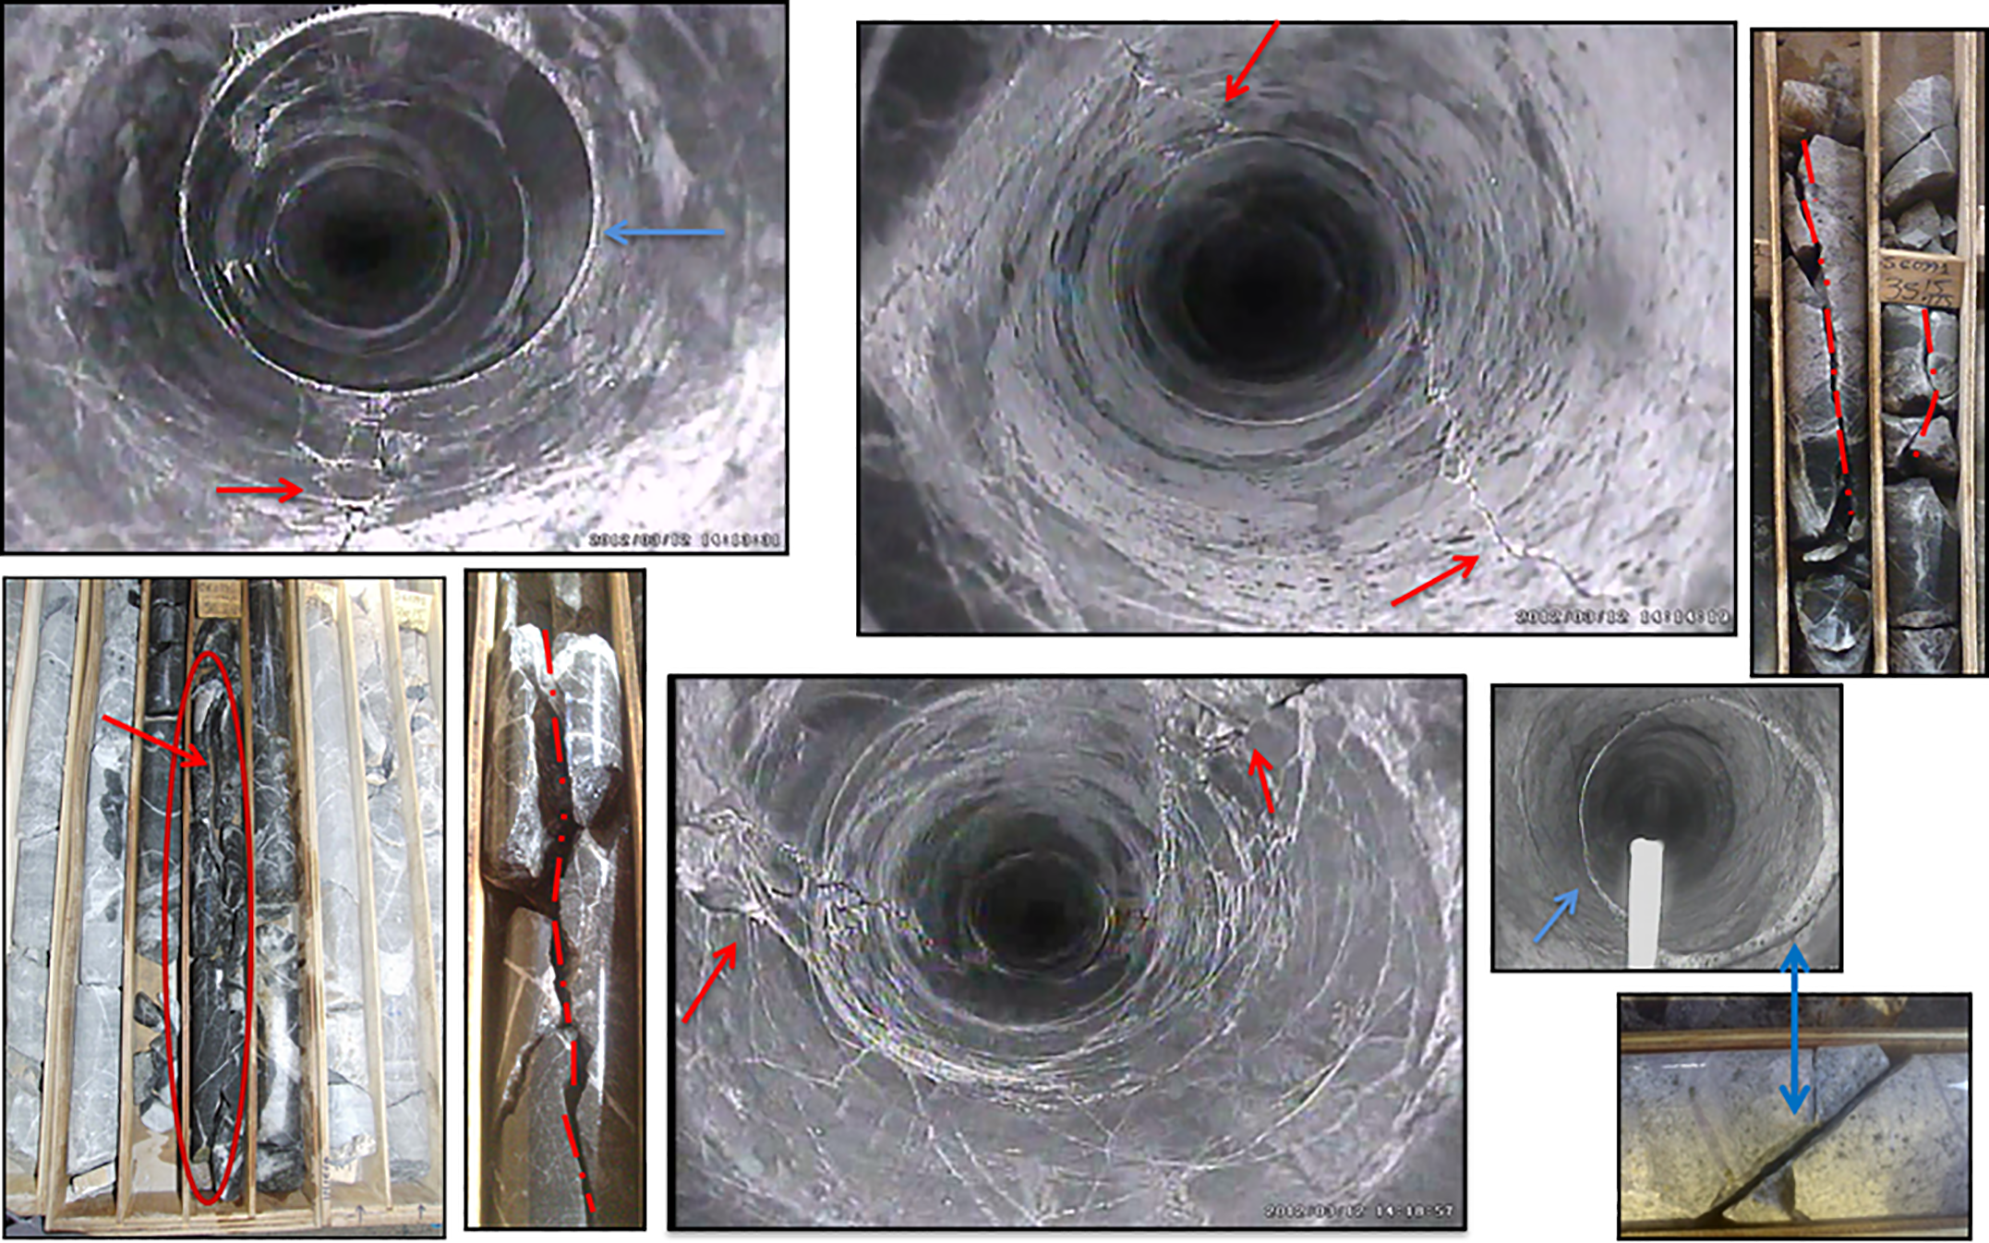
Photos from borehole camera (BHC) and core tray showing hydraulic fracturing (HF) and blasting under confined conditions (BUCC) fractures within the unfractured primary rock mass at the El Teniente mine. Blasting under confined conditions fractures in vertical inspection holes show large roughness profile (pointed by red arrows). Hydraulic fracturing fractures with sub horizontal orientation when crossing inspection holes and cores (pointed by blue arrows), show smooth roughness profile
Deriving BUCC fracture properties
Introduction
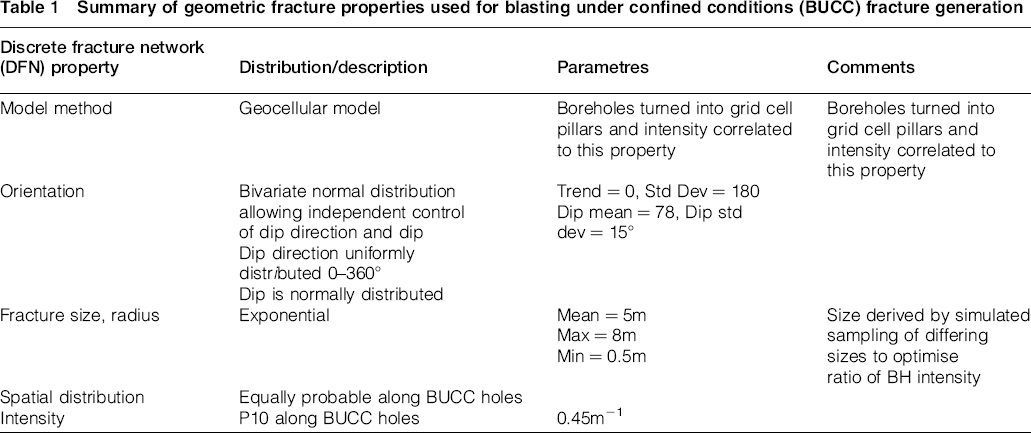
Having undertaken the extensive post-pre-conditioning site investigation, the main objective has been the analysis of these data in order to derive the geometric properties of these induced fractures. The primary geometric properties that need to be described in order to construct a Discrete Fracture Network (DFN) model of the BUCC-induced fractures are fracture size, fracture orientation and fracture intensity (Rogers, Elmo, Beddoes and Dershowitz 2009). The methodologies to derive these properties are shown below.
BUCC orientation assumptions
The primary assumption on induced fracture orientation is that the BUCC blasting fractures will be approximately sub vertical and generated axially or close to it by the blast. Confined blasting causes the opening of vertical cracks extending away from the borehole as a result of the hoop stresses caused by the radial expansion of the borehole, (International Society of Explosive Engineers, ISEE 2015). Orientation data from four boreholes show sub vertical fracture distribution with average dip of 77° (Fig. 5) and these data have been used to produce a simulated set of fracture dips with no directional preference, Fig. 6.
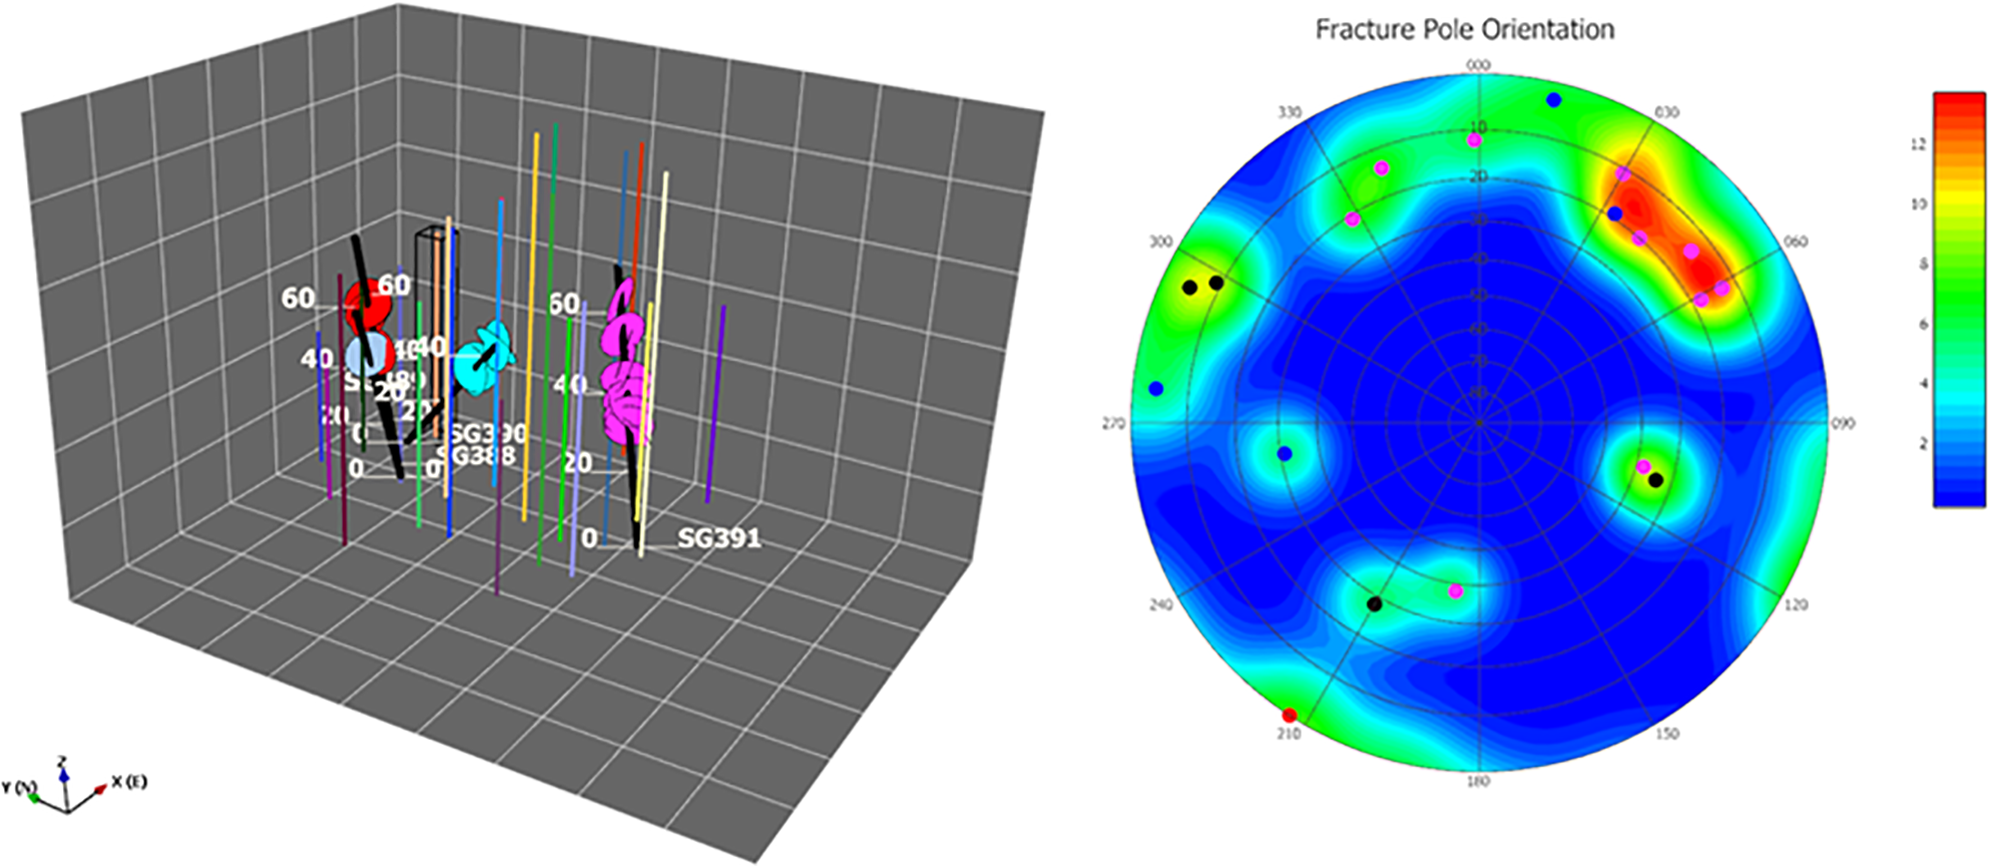
Array of blasting under confined conditions (BUCC) blast holes and two characterisation boreholes drilled post-pre-conditioning. The identified BUCC fractures are shown on the inspection borehole. The white grid cells are 20 × 20♣m. Blasting under confined conditions factures orientations from four inspection holes is also shown (left)
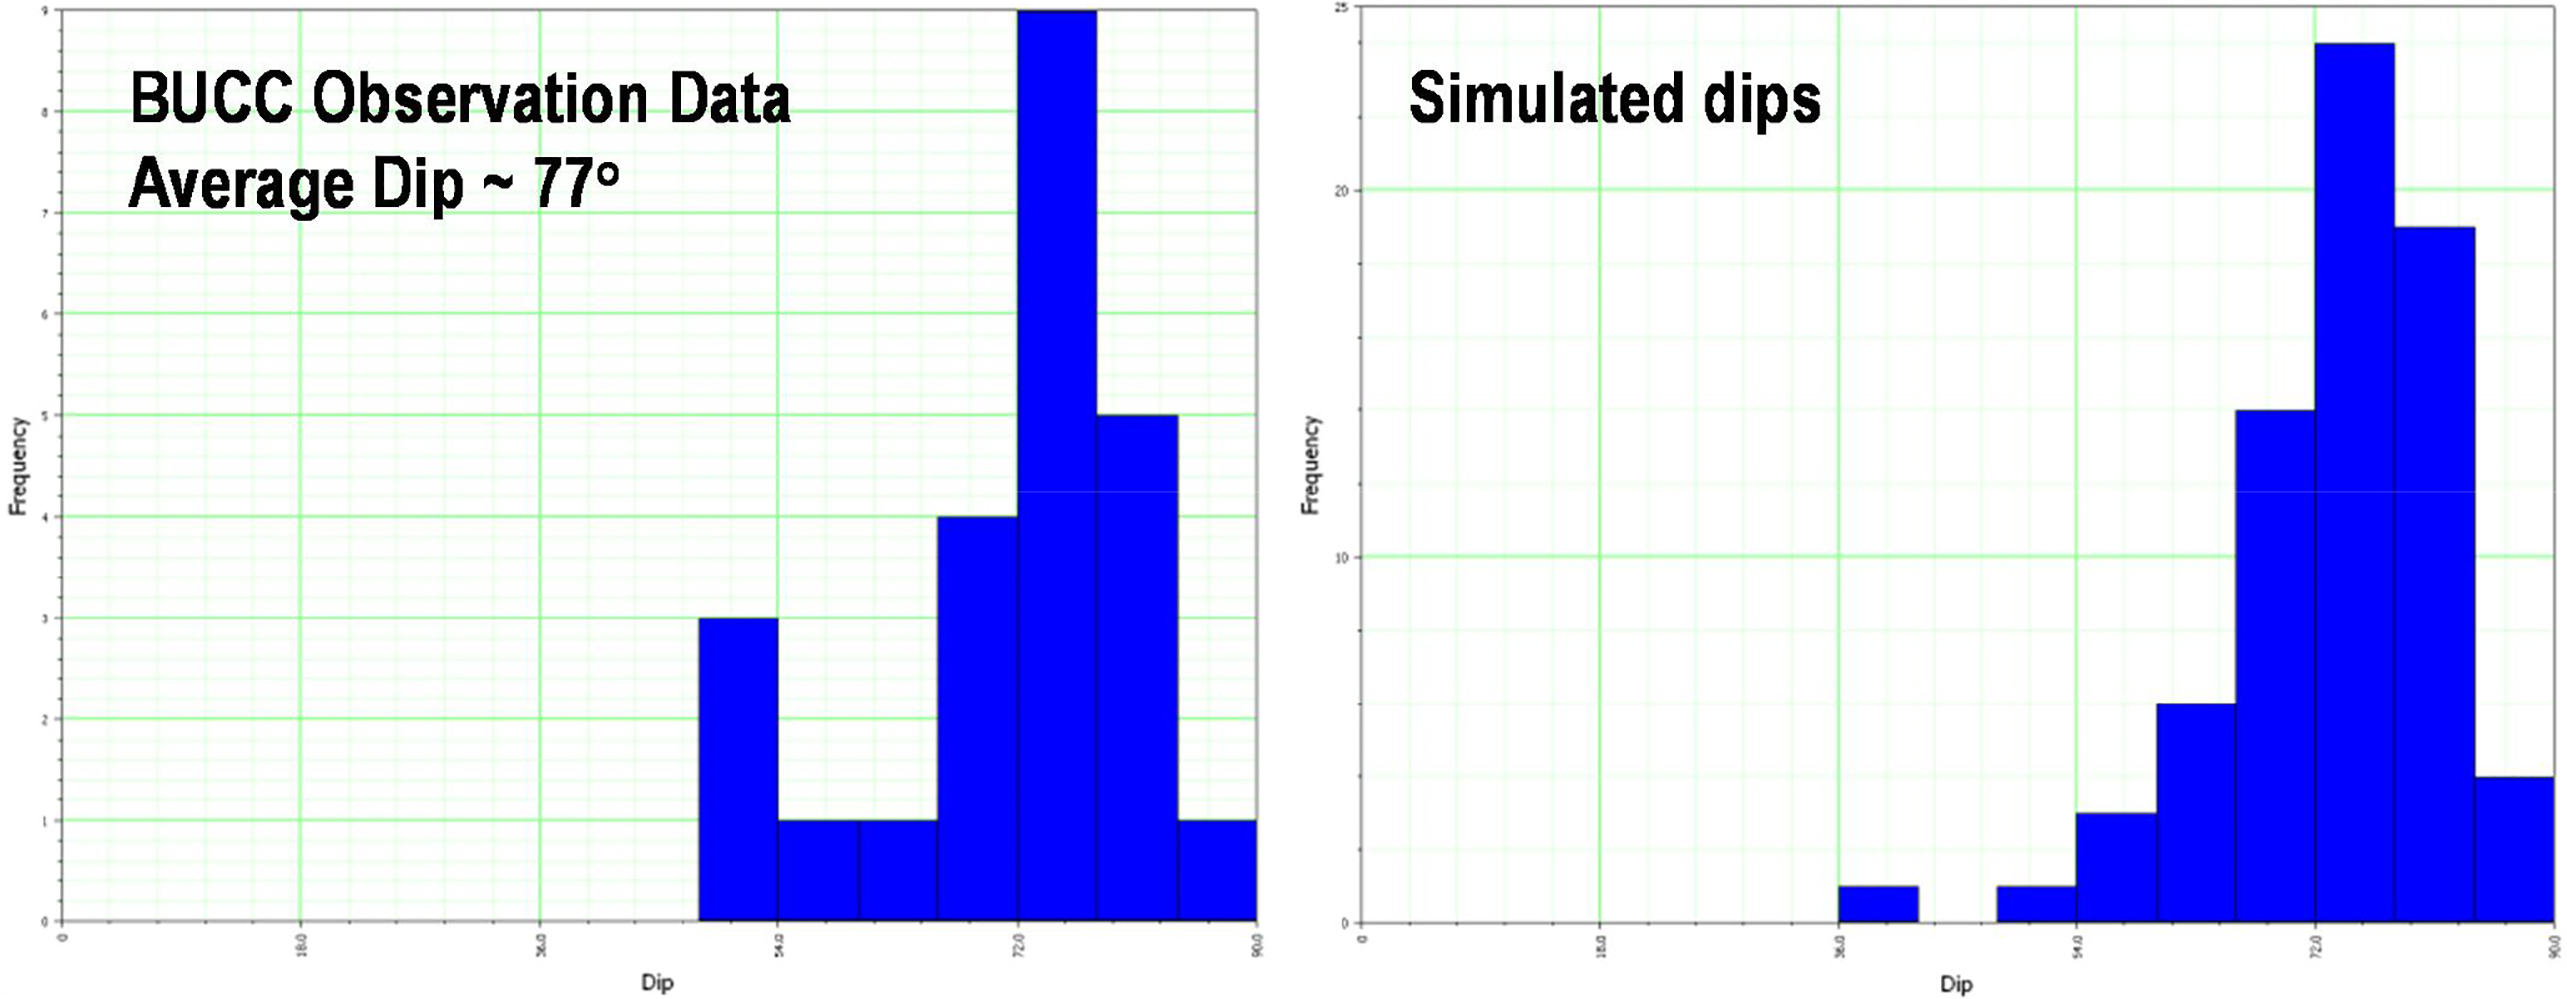
Histograms of observed blasting under confined conditions (BUCC) fracture dip (left) and simulated fracture dips (right)
In order to create these BUCC fracture orientations, a bivariate normal distribution has been used, as this allows the trend and plunge of the fractures to be controlled independently. This results in a normal distribution of dip around the mean value and a uniform distribution of dip direction as shown in Fig. 7.
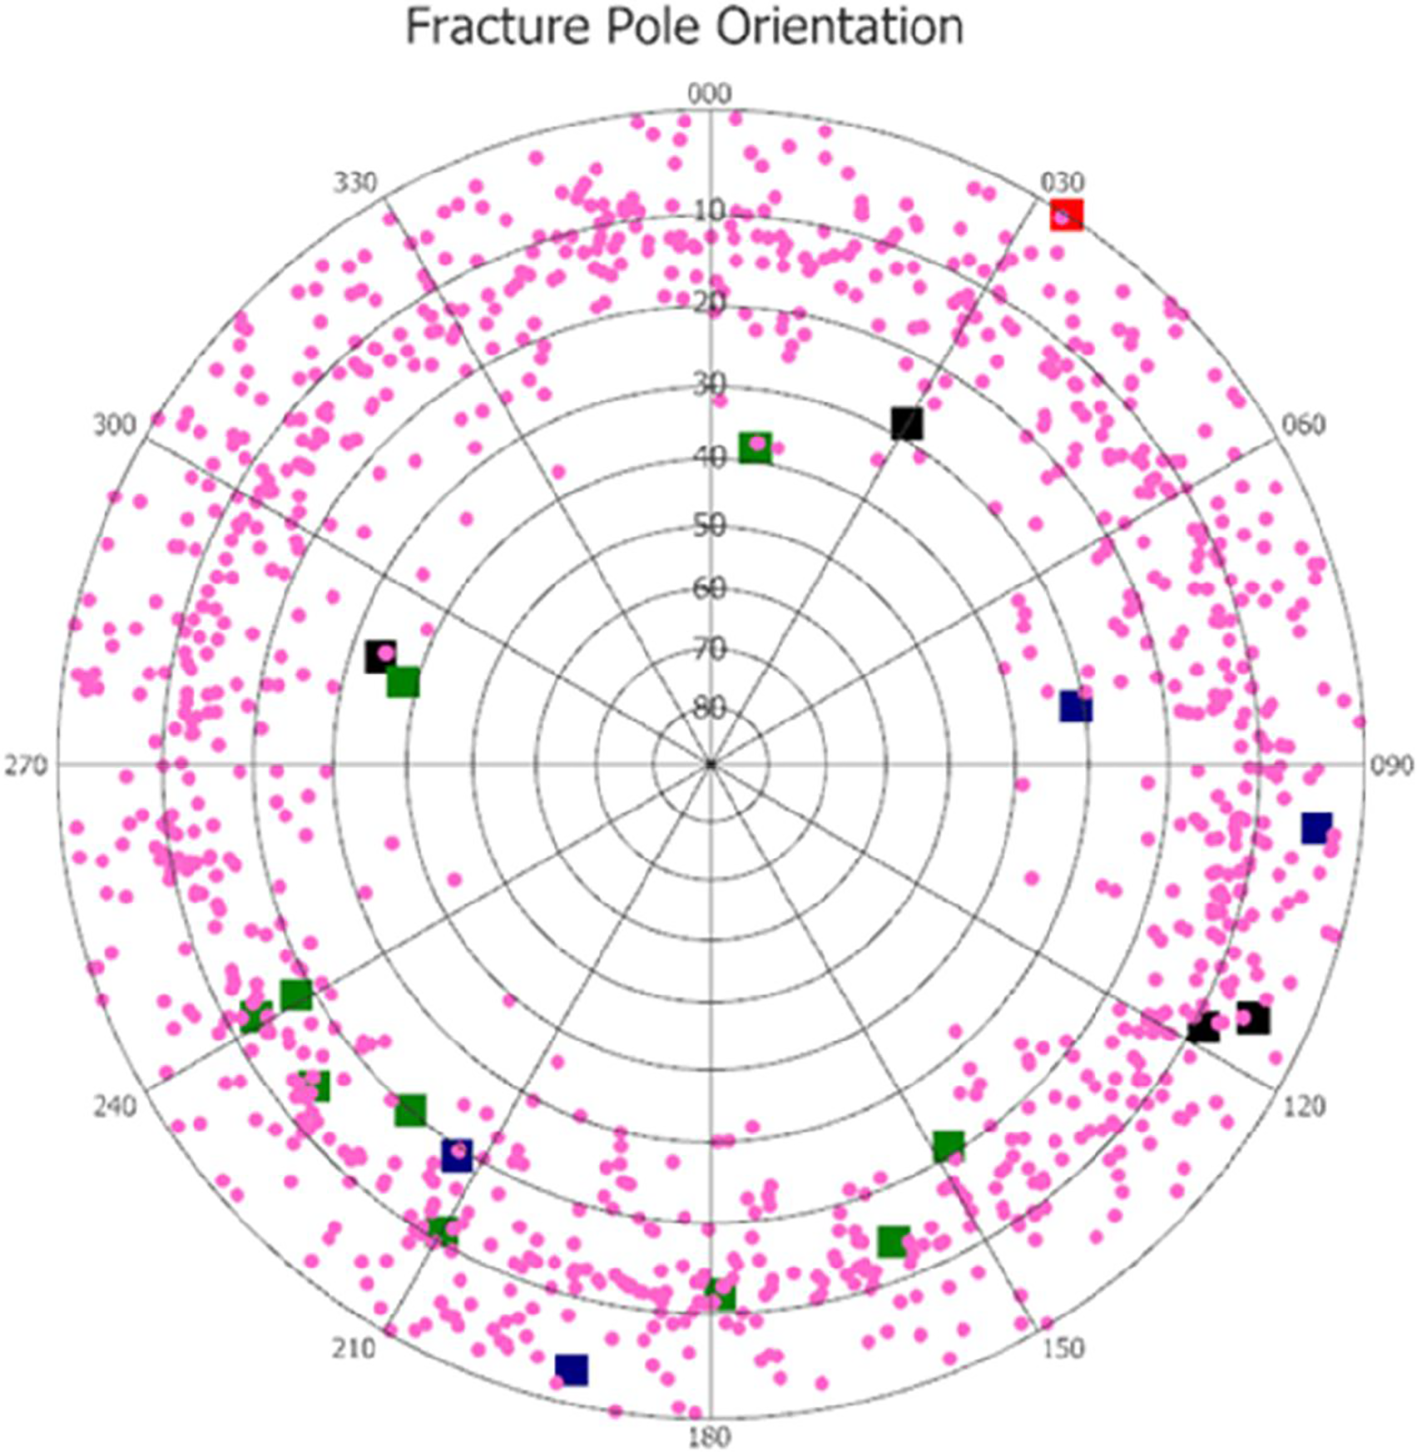
Orientation of actual and simulated blasting under confined conditions (BUCC) fractures. Field observations from four boreholes (large squares) and discrete fracture network (DFN) simulation (small dots)
Constraining BUCC fracture size
Determining the distribution of fracture size (the equivalent radius of a disc) is typically derived from some form of mapping campaign to measure fracture trace lengths and subsequent analysis of these data to derive the fracture size distribution. However as all the induced BUCC fractures remain within the as yet un-mined volume, there is no opportunity to map these structures. Therefore, an indirect approach is needed to constrain this property based on a combination of observations and inferences. Key observations and inferences to constrain fracture size include:
Observations from elsewhere show that blasting induced fracture size distributions are typically considered to be skewed (e.g. power law or negative exponential) and it is believed that dynamic blasting will create similar distributions (e.g. Hudson and Harrison 1997; Matheson 1983); Actual induced fracture intensity data was available from four observation boreholes; It is considered that a pulverised zone of up to a 0.5♣m will be observed around the well, so we are only considering fractures that extend out of this zone, i.e. >0.5♣m; and The furthest distance that blast influence was observed from one blast hole to another borehole was 7♣m and so an upper bound of 8♣m was established.
Given these observations above, DFN modelling was carried out to test different fracture size scenarios and to observe their impact upon the matching of the actual data. The objective was to reproduce the ratio of fractures observed between two of the observation boreholes (SG390 and SG391). Thirty realisations of a number of different size distributions (exponential and power law) were simulated. It is recognised that this method constrains rather than calibrates fracture size measurements, especially given the limited number of data points to use. However as it synthesises both conceptual evidence (distribution type) and actual intensity observations together, it is considered a reasonable approach.
As each realisation generates slightly different results, the model with the distribution of fracture intensity ratio between SG390:SG391 closest to 2.5, was considered the best result. The results of simulations for different size models are shown in Fig. 8. The histograms showing the distribution of the ratio of observed fractures between boreholes for the different models relative to the target ratio is also shown (inset) in Fig. 8. An exponential distribution of fracture size with mean radius of 5♣m was found to have the best fit.
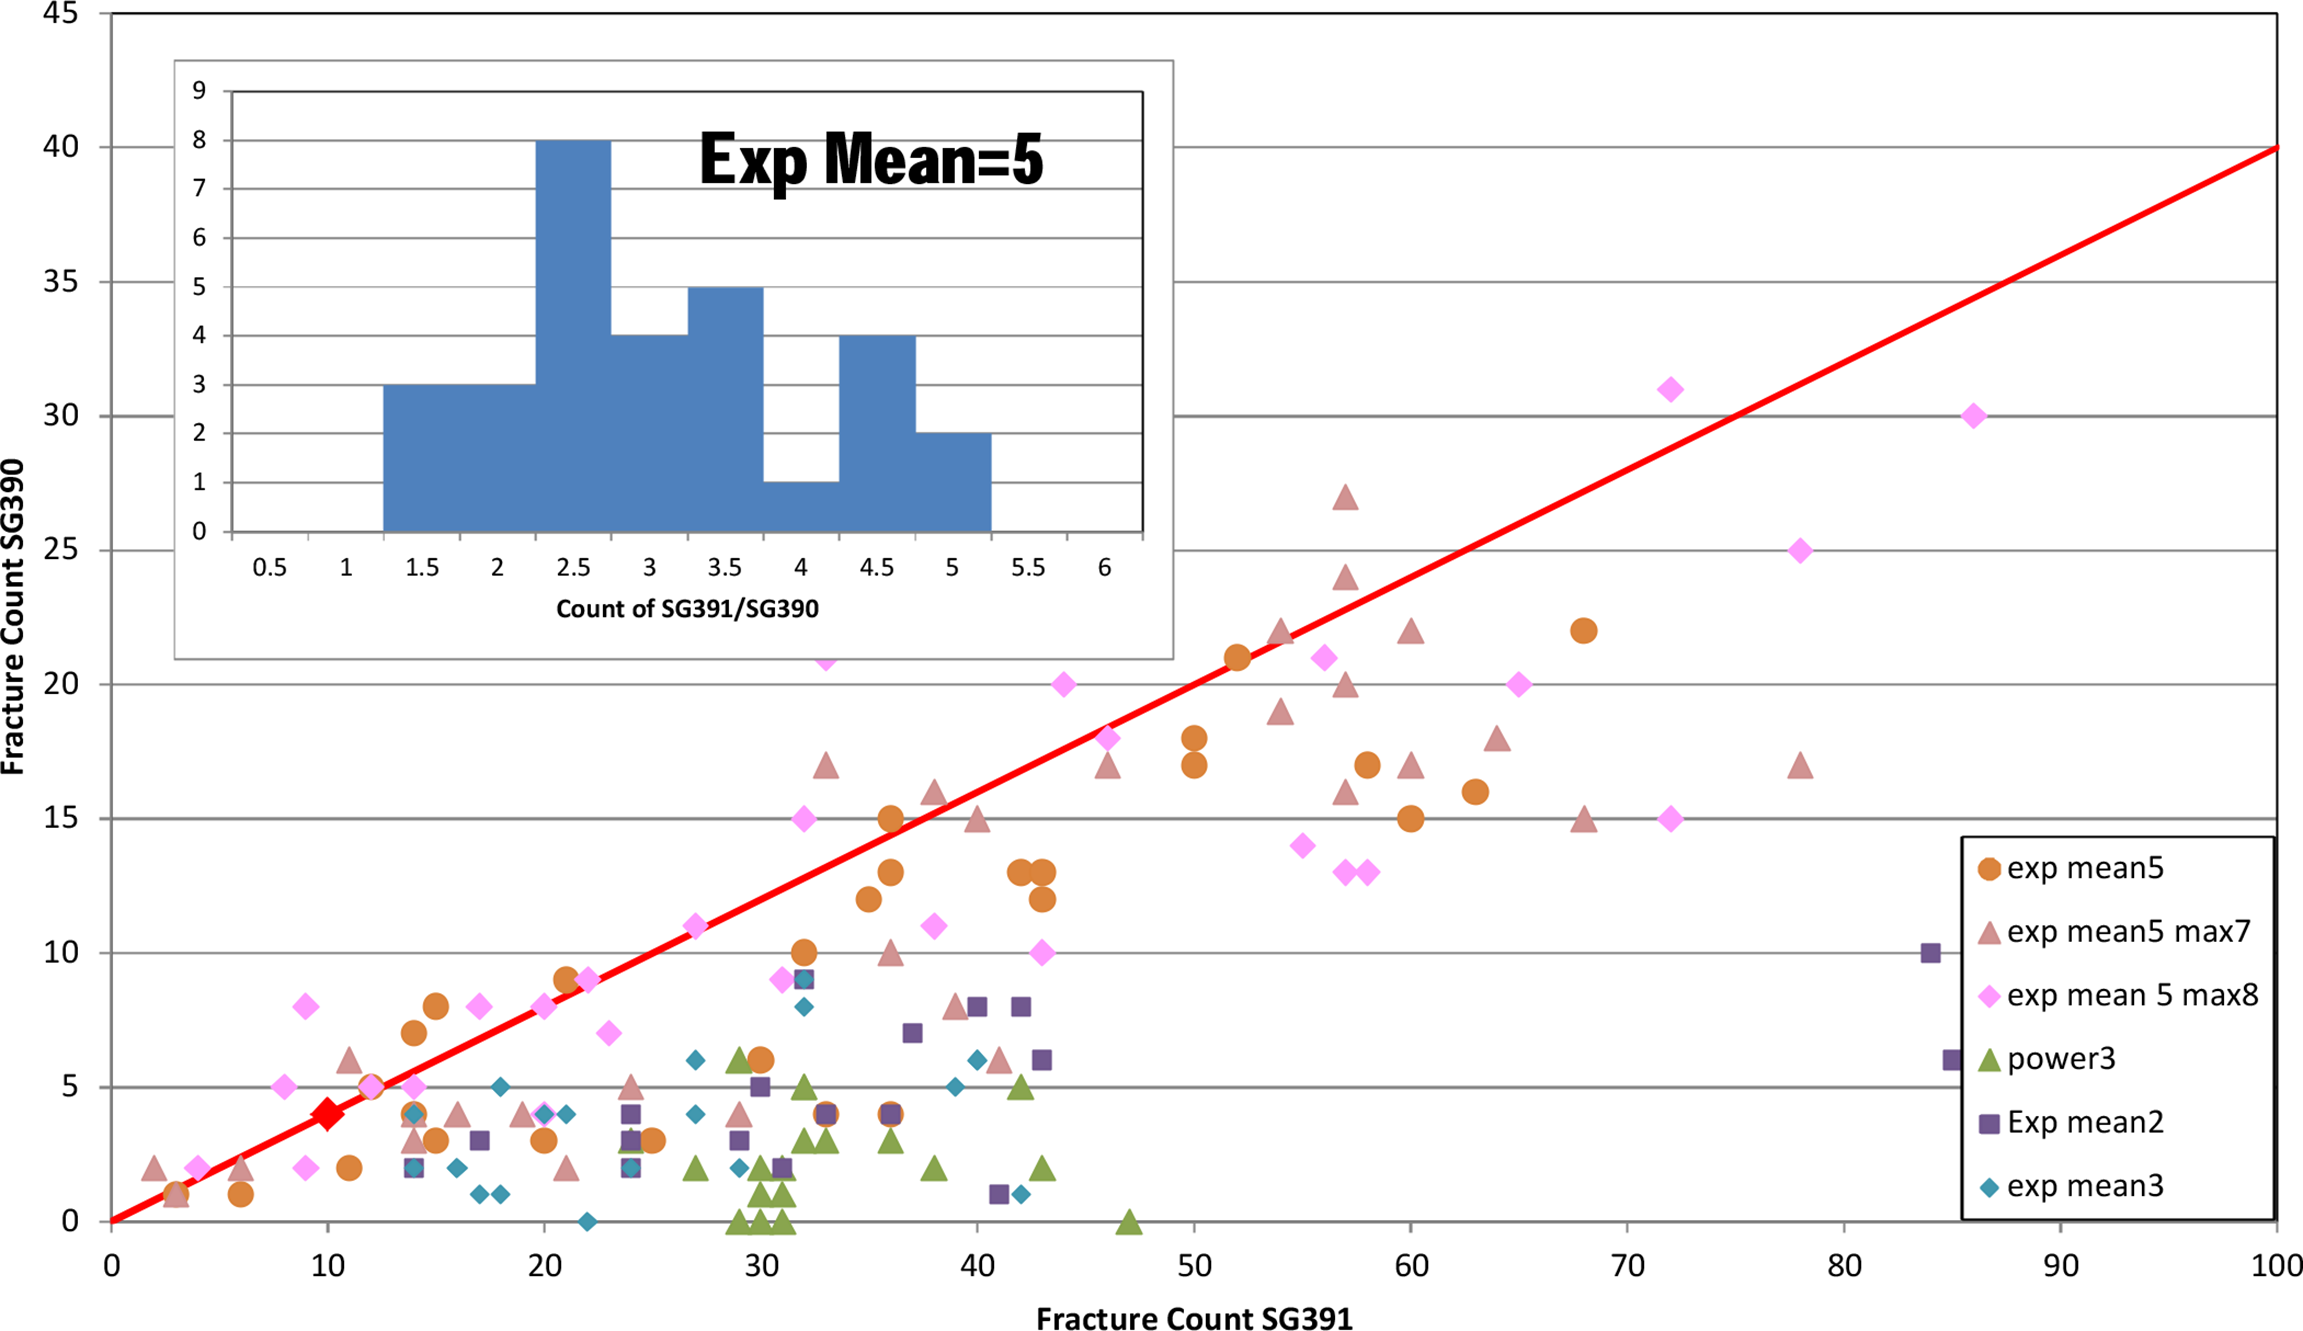
Graph showing the number of fractures intersected by the simulated boreholes SG390 and SG391 with the red line representing the correct ratio of intersections for a number of different fracture size models. The inset histogram shows the distribution of these ratios
Constraining BUCC fracture intensity
Constraining the BUCC Fracture intensity has been achieved in a similar way to how fracture size was estimated by testing at what P10 in the BUCC holes is needed to achieve the observed fracture count in two of the observation boreholes SG391 (fracture count = 10) and SG390 (fracture count = 4). A DFN model was constructed based on the fracture size and orientation properties already determined. The fracture intensity was fixed at the BUCC borehole, with 25 realisations generated and the simulated SG390 and SG391 fracture counts determined for each model. Using a P10 of 0.45♣m− 1 at the BUCC well showed the closet fit to the observed fracture counts, Fig. 9.
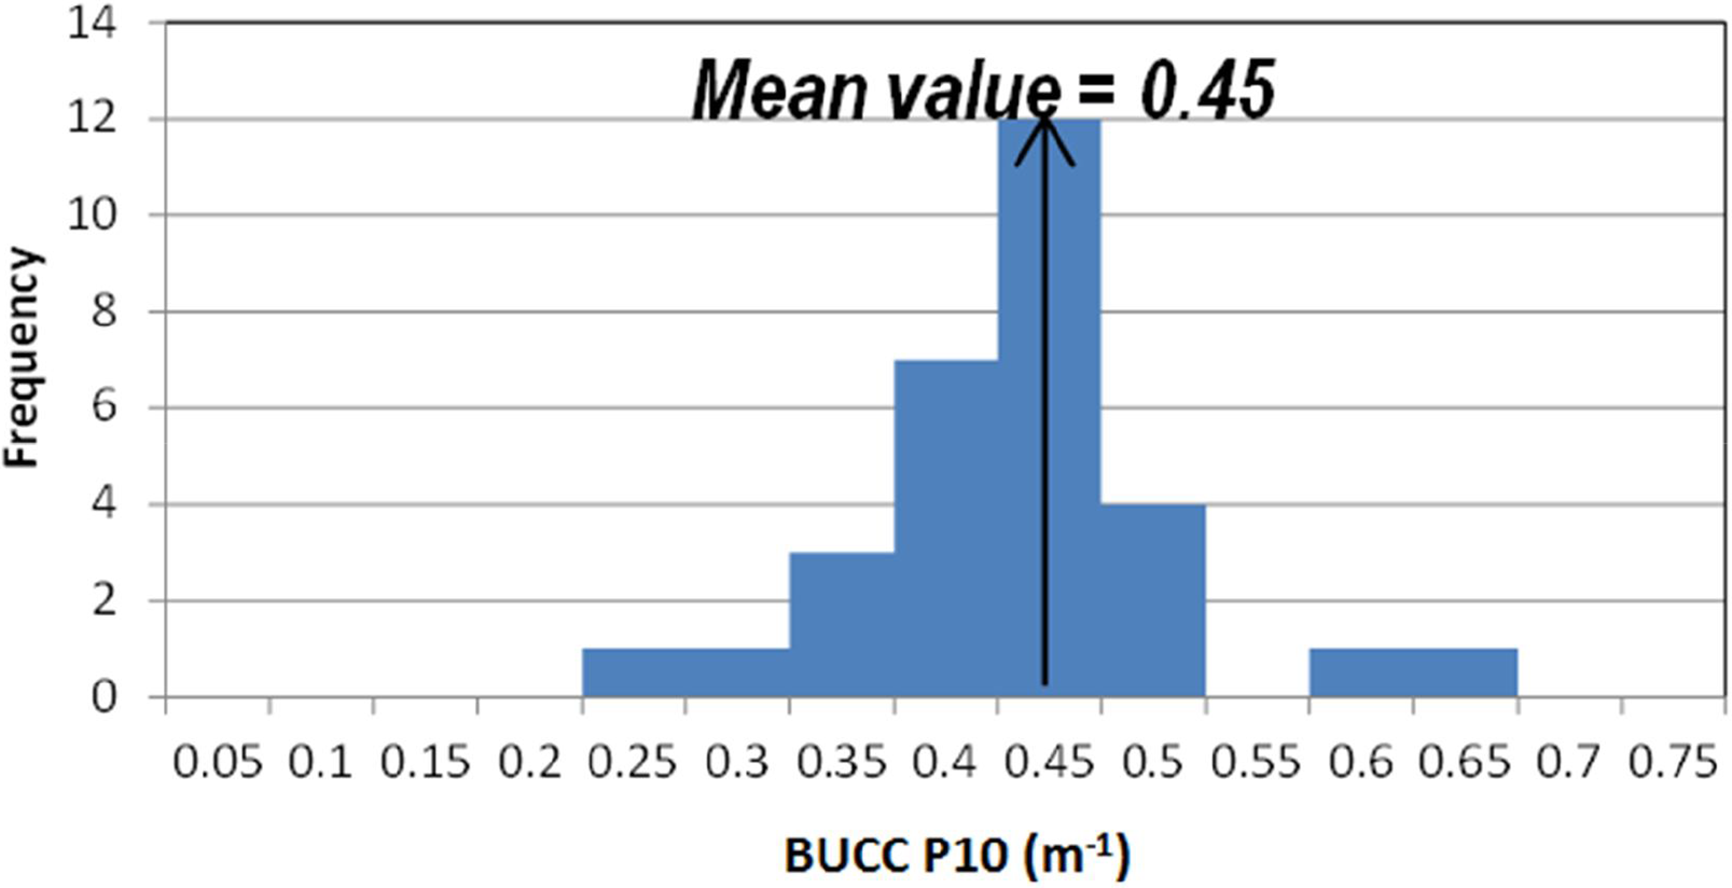
Histogram of the blasting under confined conditions (BUCC) hole P10 required to meet the SG390 and SG391 observed BUCC fracture intensities
Modelling volume and approach
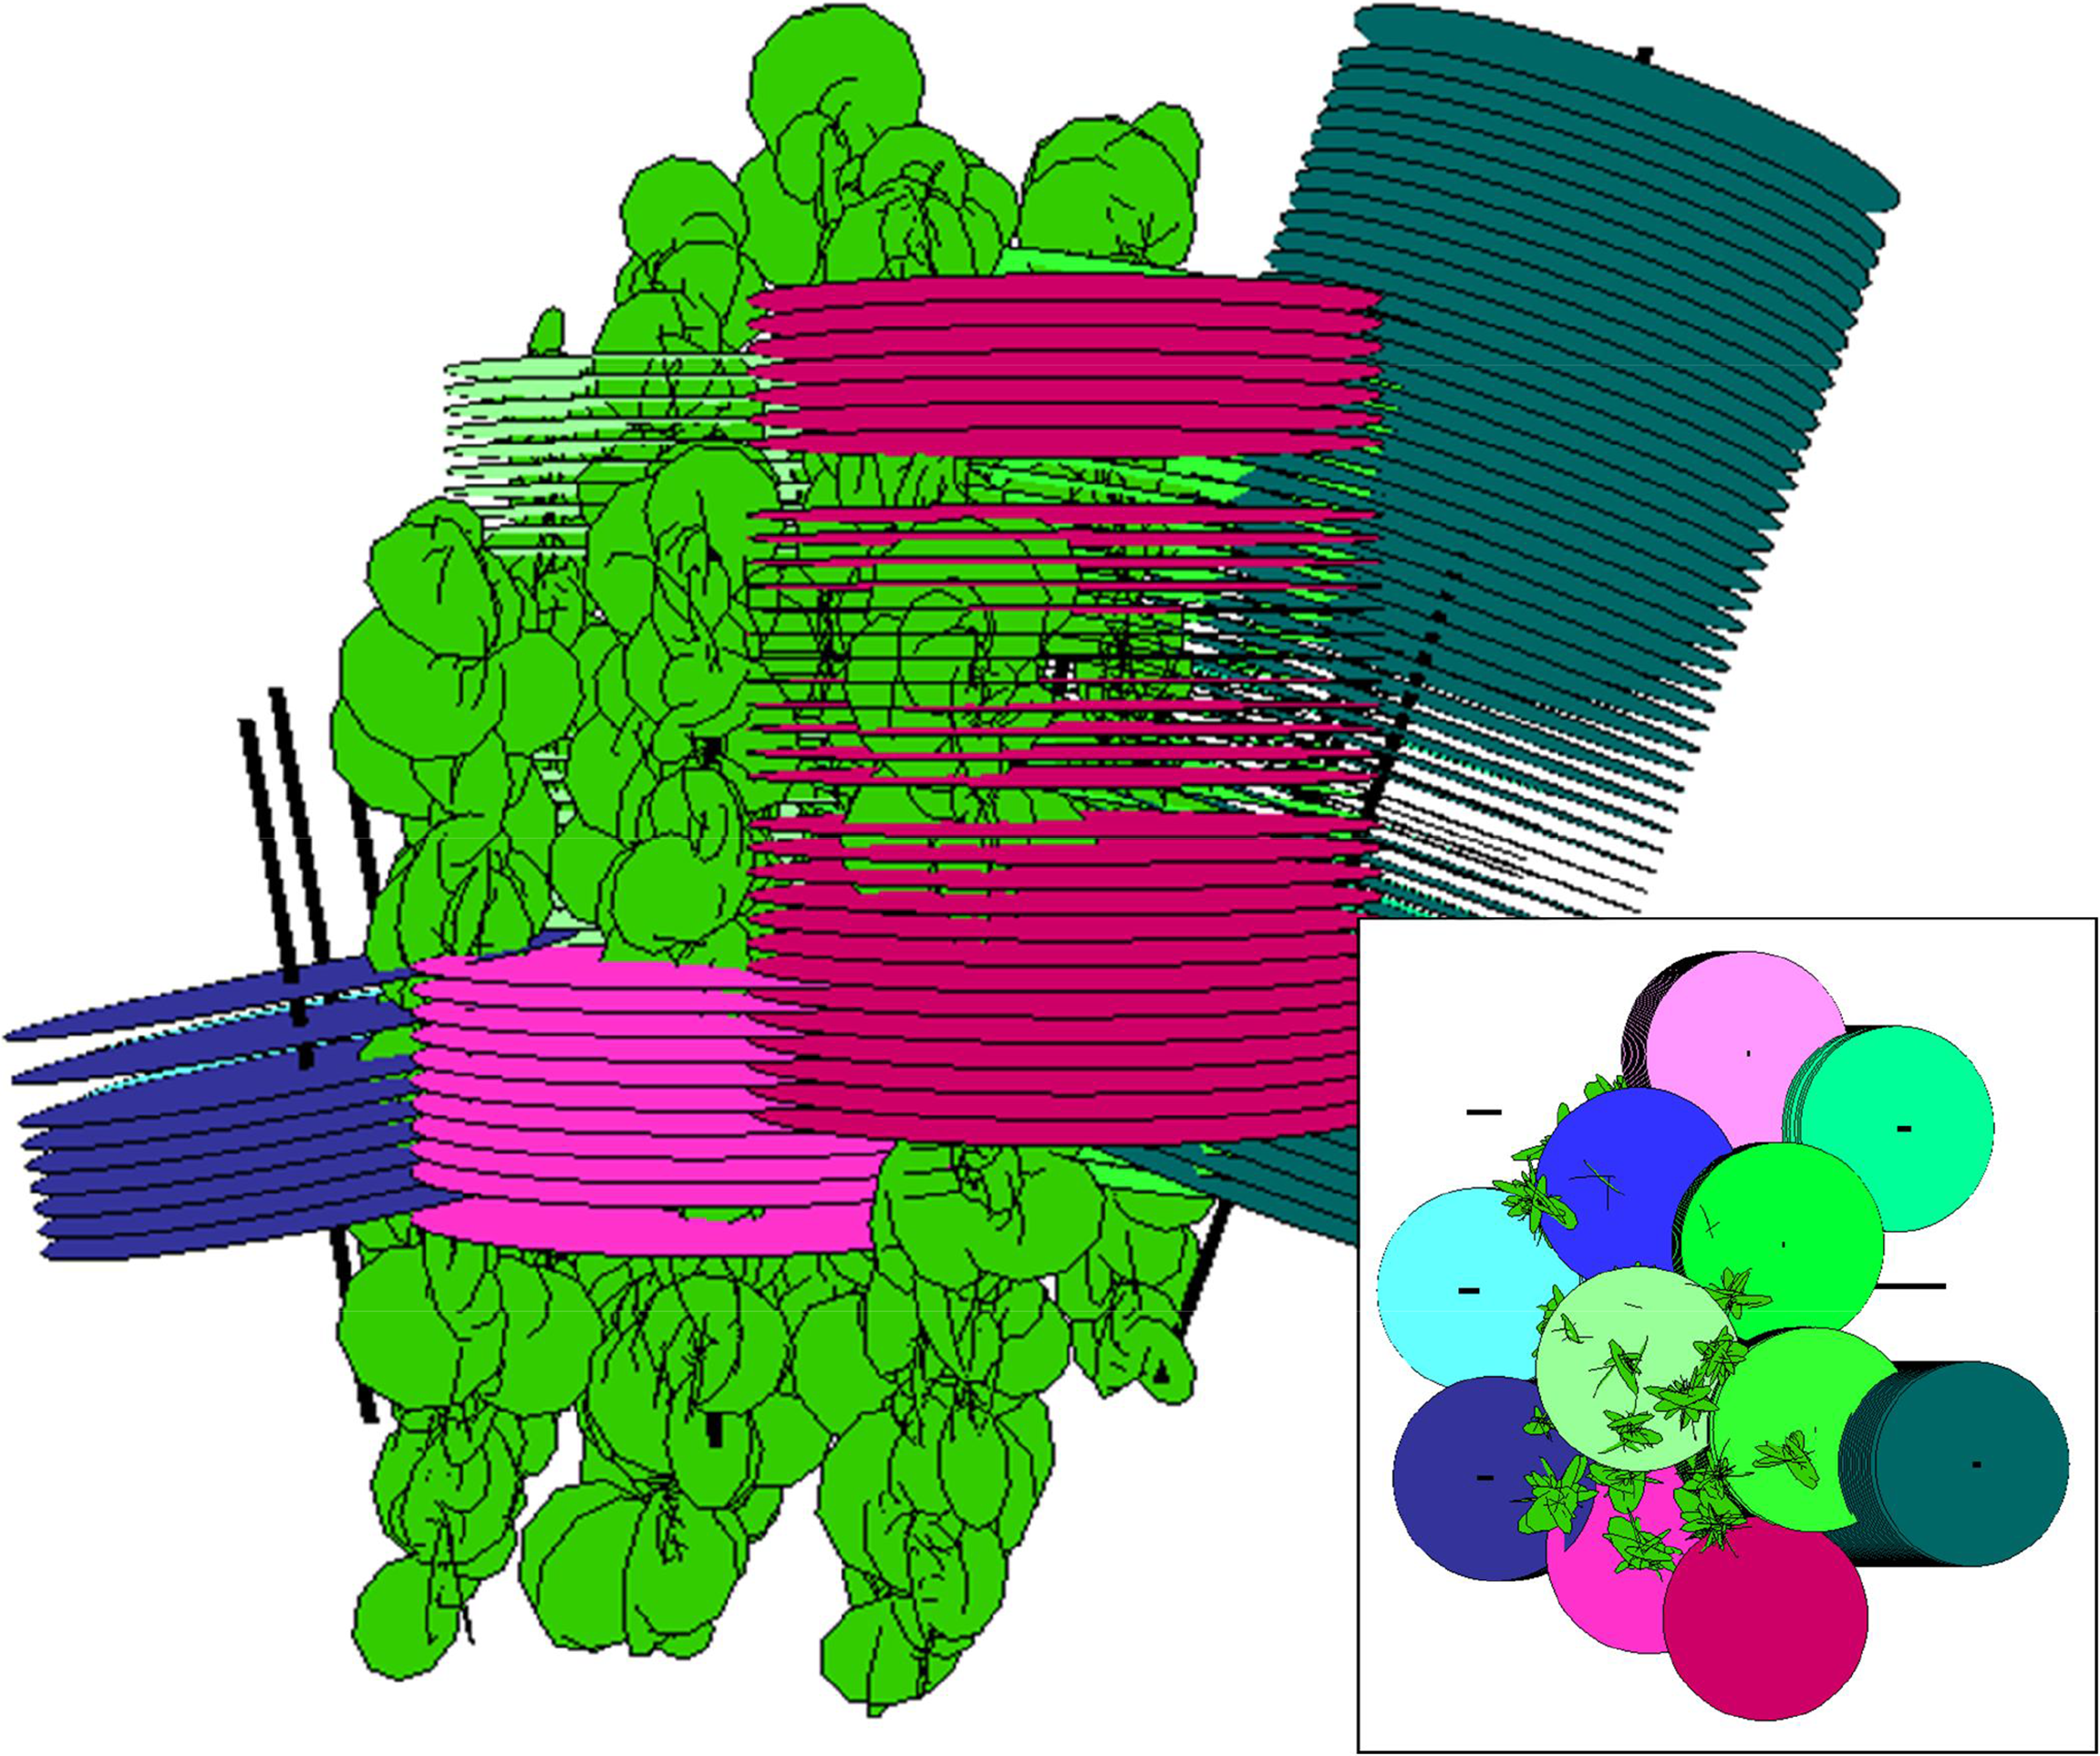
In order to fully model multiple BUCC holes blasting, a geo-cellular approach has been used within a 60 × 100 × 55♣m grid. Views of one realisation of the DFN model of BUCC fractures are shown in Fig. 10.

Discrete fracture network model (one realisation) of the simulated blasting under confined conditions (BUCC) fractures. a view showing fractures initiating from BUCC boreholes and coloured by fracture area; b plan view with fractures coloured by strike with box showing location of modelling grid; and c section through modelling with P32 of one realisation calculated
Stochastic reproduction of BUCC fracture observations away from the boreholes
The last part of the DFN calibration process is to ensure that the decay of fracture intensity with distance from the BUCC holes is reproduced. Data were available primarily from core from boreholes drilled post-BUCC pre-conditioning. These data showed a strong relationship between RQD and the distance from the BUCC detonation location (Fig. 3) Fig. 11 (red diamonds). Obviously, RQD is not a direct fracture intensity measure but rather a proxy measurement. However, it serves to provide a strong indication of the change of overall fracture intensity with distance from the BUCC holes.
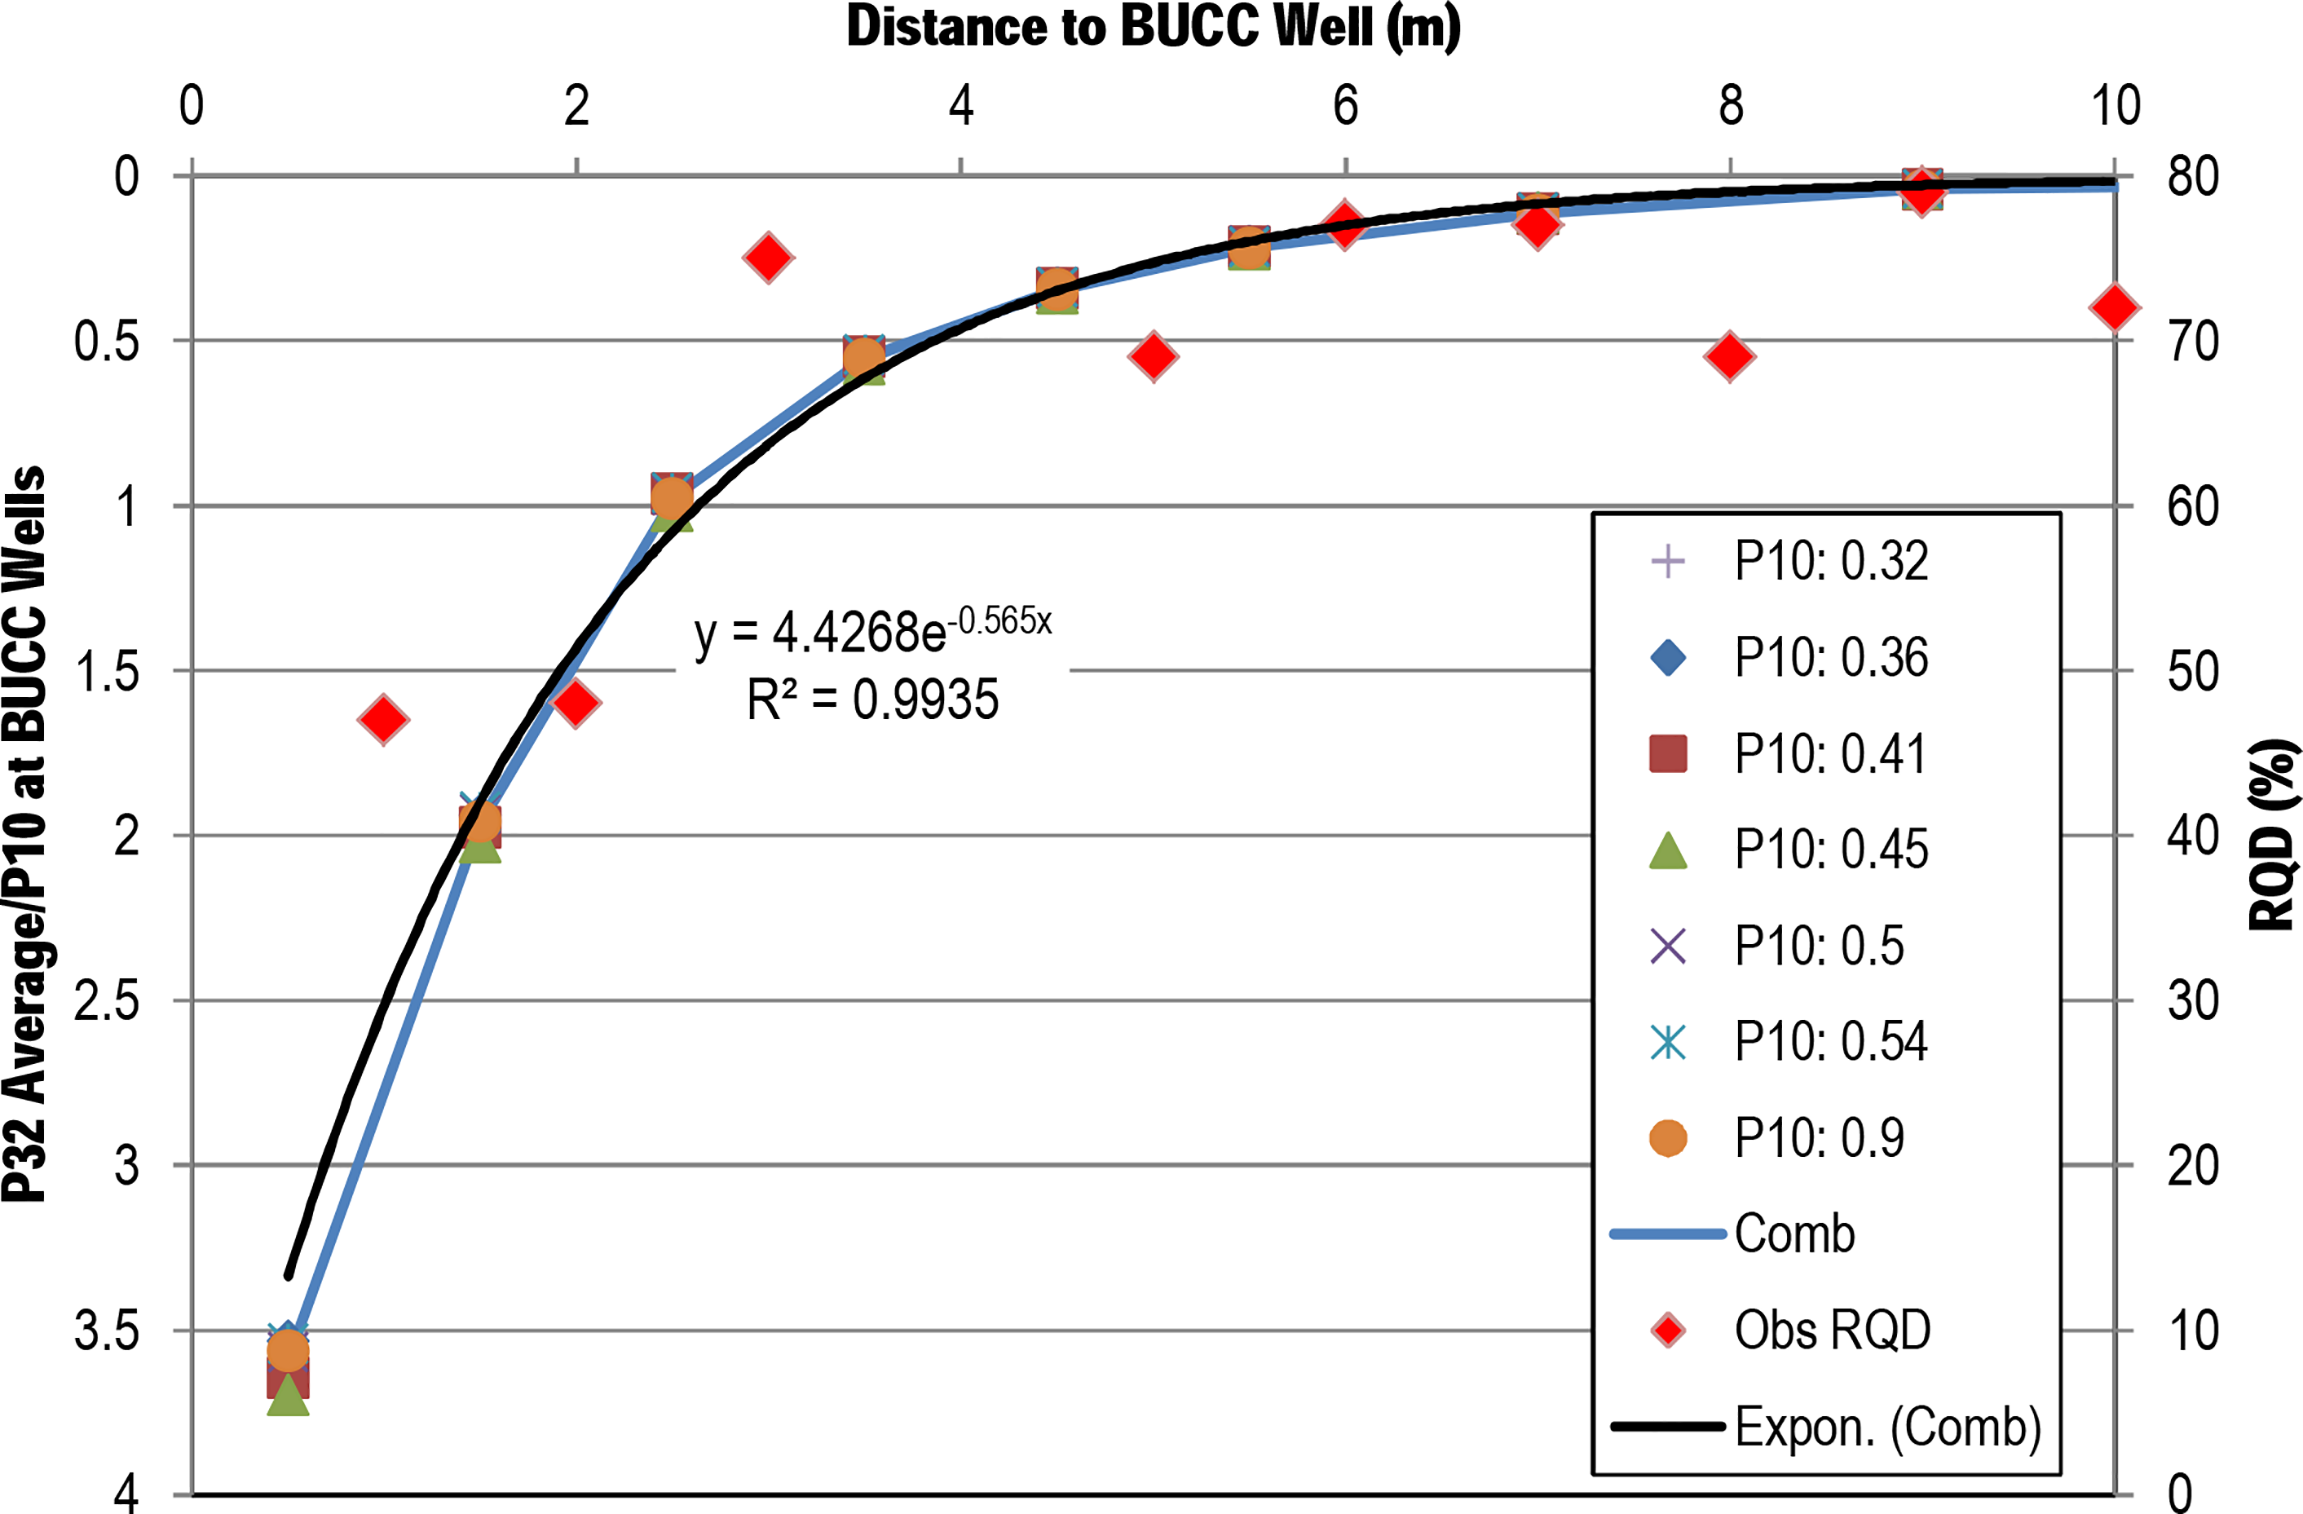
Graph showing the relationship between simulated and actual fracture intensity (P32/P10) and distance from the blasting under confined conditions (BUCC) holes. RQD has been used as a proxy to fracture intensity
In order to quantify the relationship between P32 (fracture area/volume, Dershowitz and Herda 1992) and distance from the BUCC holes in the DFN simulations, the following methodology was used. First five DFN realisations were generated for the derived BUCC hole P10 value (the P10 at the BUCC hole is referred to here as P10BUCC). For each of these realisations, the P32 of BUCC fractures was calculated within the model grid. An additional distance property was also calculated with the cell's distance to the nearest BUCC hole. Taking the average of the five models allows the mean P32 to be plotted against the distance from the BUCC hole. In order to make this a universal solution and independent of the initial P10 intensity at the BUCC boreholes, the derived P32 values are normalised with respect to the P10BUCC. Authors now have a relationship between P32 and distance for any P10 value, which shows an exponential decline in intensity with distance from the blast.
HF fractures
In addition to the BUCC fractures, the HF fractures have also been created within the model. The HF fractures were modelled as discrete fractures based on both the frac design and records of successful ones reported by operations staff. As such, the HFs were modelled as circular discs with a 20♣m radius (φ) and oriented sub horizontally, according to the stresses at the SuaPi mine sector (i.e. perpendicular to σ3).
DFN summary
The DFN model built here has been calibrated or constrained by a range of field data including orientation, absolute and also relative intensities between several boreholes. A summary of the properties used in the DFN model are shown in Table 1. The overall DFN work flow provides a methodology to quantify some of the perceived, yet hard to observe impacts of blast pre-conditioning.
Summary of geometric fracture properties used for blasting under confined conditions (BUCC) fracture generation
Fragmentation performance
Introduction
Evaluating the impact of any form of pre-conditioning has always been difficult because of the challenges of isolating good data from areas without pre-conditioning and comparing it to areas where the only significant difference has been the addition of induced fractures from pre-conditioning. With the creation of a DFN description of the BUCC fracturing and the HF fracturing (Fig. 12), there is now a tool with which the fragmentation performance can be compared. In this respect, a block model of the preconditioning intensity was developed. This represents the intensity of new open fractures formed within the competent rock mass by preconditioning. In order to evaluate the pre-conditioning effectiveness, fragmentation measurements at the production level draw points of the SuaPi mine sector were correlated to the modelled preconditioning intensity.
Discrete fracture network (DFN) model of both the blasting under confined conditions (BUCC) fractures and the horizontal HF fractures. Inset image is a plan view
Modelled fracture intensity
The modelled BUCC & HF fractures can be converted to an equivalent cellular P32 by calculating the fracture area in every grid cell. This is known as upscaling and is carried out within the FracMan code (Dershowitz et al. 1998). In addition to the BUCC and HF fractures, the upscaling calculations have also been carried out for a DFN model of the weak veins that are thought to be directly involved with actual block formation during caving (Brzovic and Villaescusa 2007). Previous analysis showed that these veins had a mean P32 of approximately 3.1♣m− 1 (Brzovic and Herrera 2011). The equivalent P32 property has been calculated for the weak veins only along with different pre-conditioning scenarios. The distributions of these data sets are shown in Fig. 13.
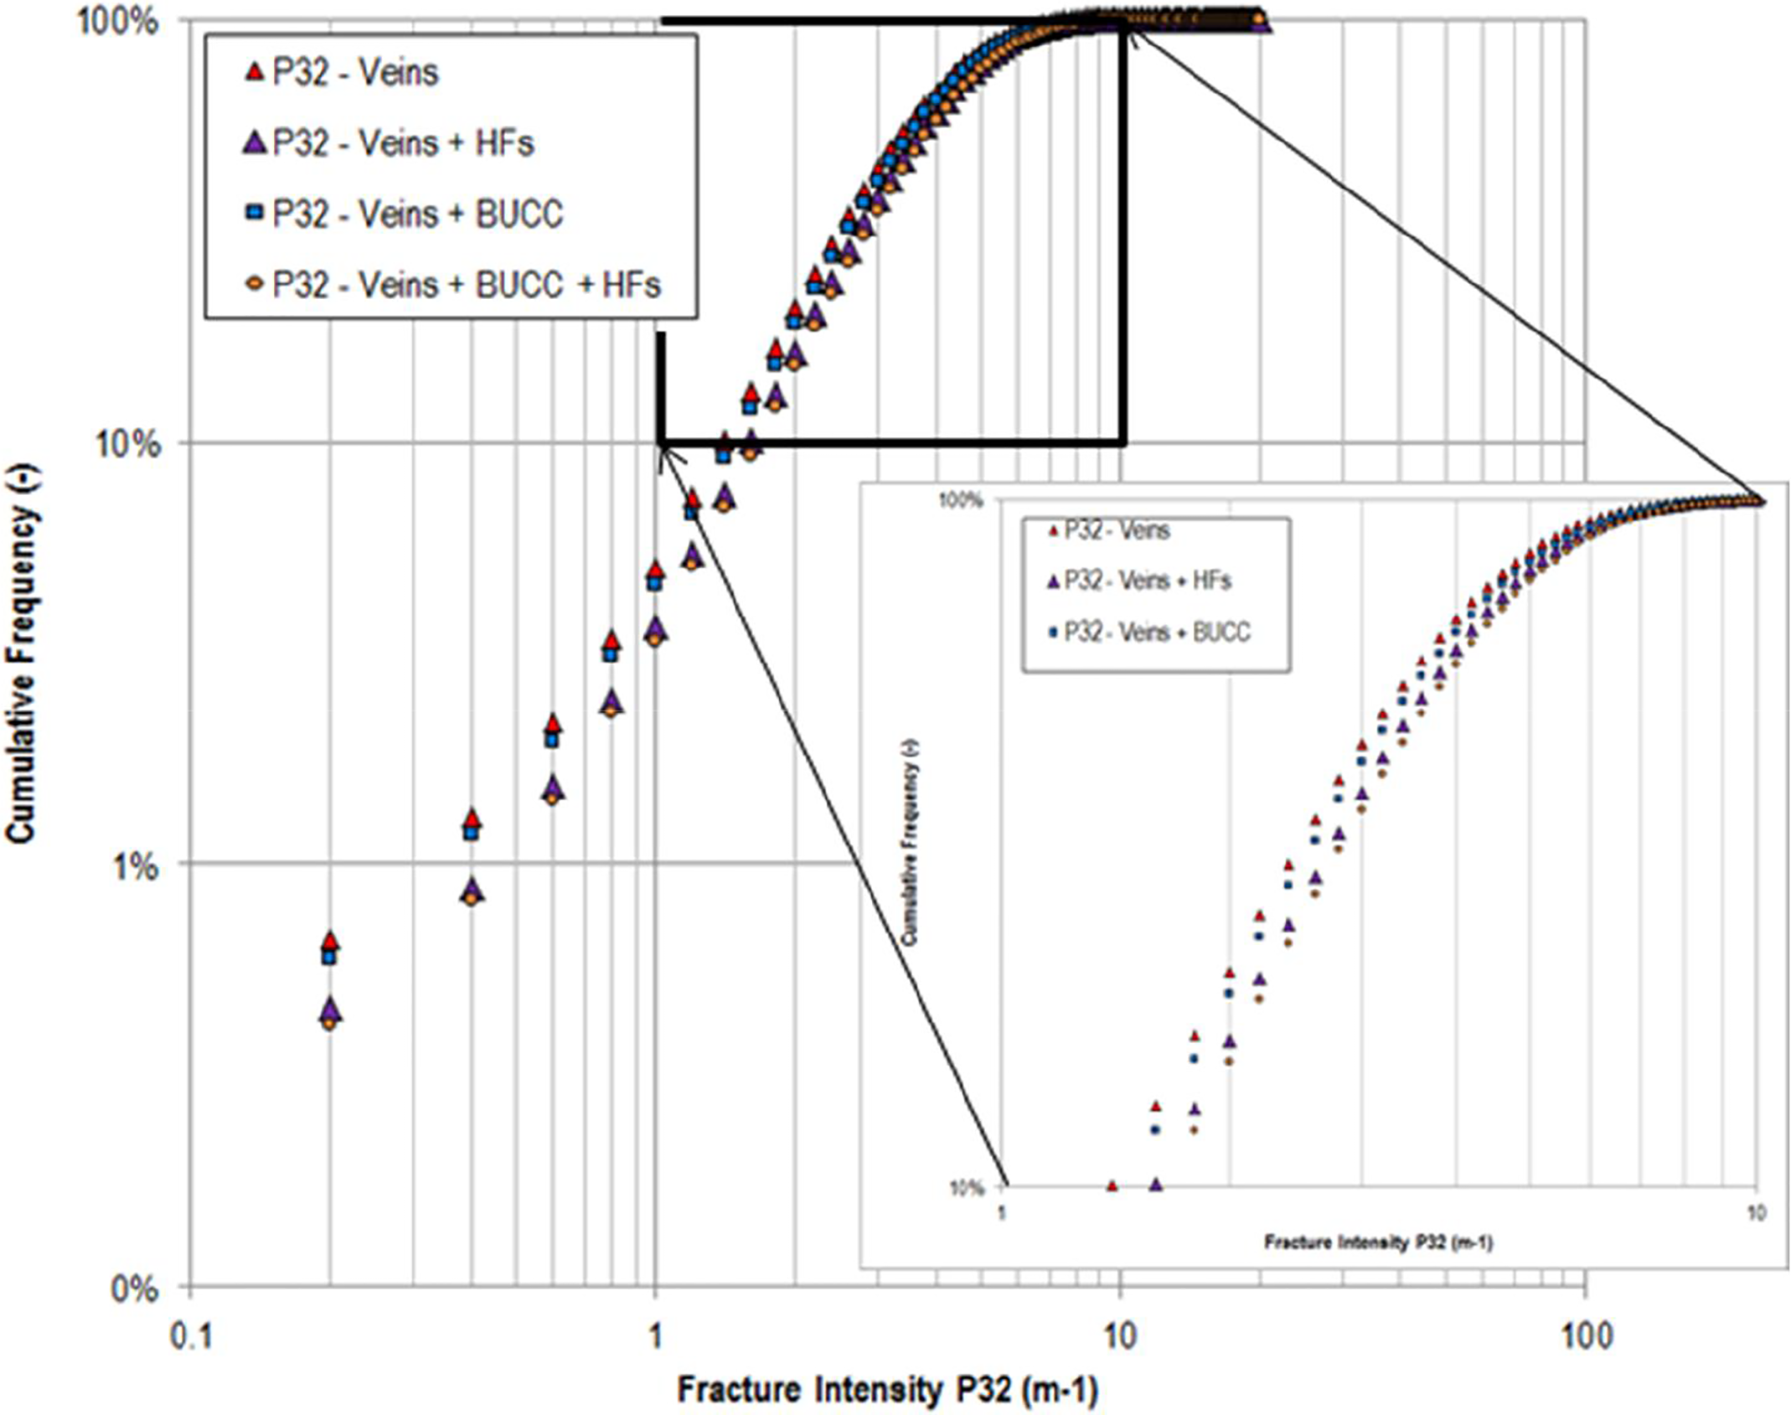
Distribution of calculated cellular P32 for veins only and pre-conditioning scenarios
What can be seen from Fig. 13 is that the relative shift of the preconditioned model P32 distribution to the right towards higher P32 values is relatively limited. The inset within Fig. 13 shows in more detail that the HF pre-conditioning makes a discernibly greater impact than the BUCC approach. This is consistent with the results reported in Brzovic et al. (2014a), which calculated the mean P32 for a range of pre-conditioning strategies, Table 2.
P32 results for the Dacite with different pre-conditioning configurations, after Brzovic et al. (2014a)
Veins refers to the primary fragmentation within the Dacite rock mass.
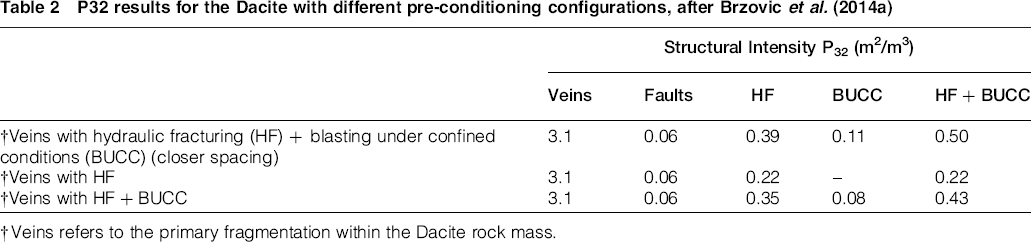
Example images of the upscaled grids showing P32 intensity for the base case of veins only, BUCC fractures and HF fractures only, veins and HFs and BUCC, HFs and BUCC fractures, Fig. 14. To help understand these images, some filtering and slicing of the properties has been carried out. For example, for both the BUCC fractures only and HF fractures only properties, all cells with a P32>0 are displayed. This shows the proportion of the total volume stimulated is relatively small. Additionally comparing the P32 of veins plus pre-conditioning versus the veins only property, it is difficult to see the difference. However, it is important to note, that soft veins containing weak mineral have considerable strength (cohesion, friction angle and tensile strength) in comparison with BUCC and HF fractures that are open, having no cohesion, nor tensile strength (De Los Santos and Brzovic 2013).
Calculated P32 property distribution in grid (60 × 100 × 55♣m) for veins only, Hydraulic fracturings (HFs) only, blasting under confined conditions (BUCC) fractures only, veins+BUCC fractures and veins+BUCC+HF fracture. The colour scale is P32 (m− 1). The top right image shows the DFN model of BUCC and HFs
A key difference between HF and BUCC preconditioning is the spacing of the boreholes. As HFs extend much further than BUCC-induced cracks, the spacing of those holes are larger. Hydraulic fracturing holes have a median spacing of approximately 20♣m and BUCC holes are approximately half that distance at around 11♣m. Of course, this is highly variable as a result of the specific configuration of the holes, which is quite variable locally.
Fragmentation impact
To evaluate the impact of the differing pre-conditioning strategies on rock mass fragmentation, 3D blocks within a representative volume of the pre-conditioned area have been mapped in FracMan. The methodology used is an implicit block mapping and is optimised to provide an initial estimate of the natural fragmentation of the rock mass (Rogers, Elmo, Webb and Catalan 2010). The volume analysed comprised a 10 × 10 × 10♣m cube of rock mass and was centred on a BUCC blast hole or HF borehole. It should be reiterated that obviously no attempt has been made to capture the process of rock pulverisation that occurs close to the charge hole in the BUCC situation nor to consider the role of attritional processes such as autogeneous grinding. The percentage of fines will therefore be under represented in any analysis using the DFN models. However it is the impact of the BUCC or HF approach on larger blocks and the overall rock mass performance that is of most relevance.
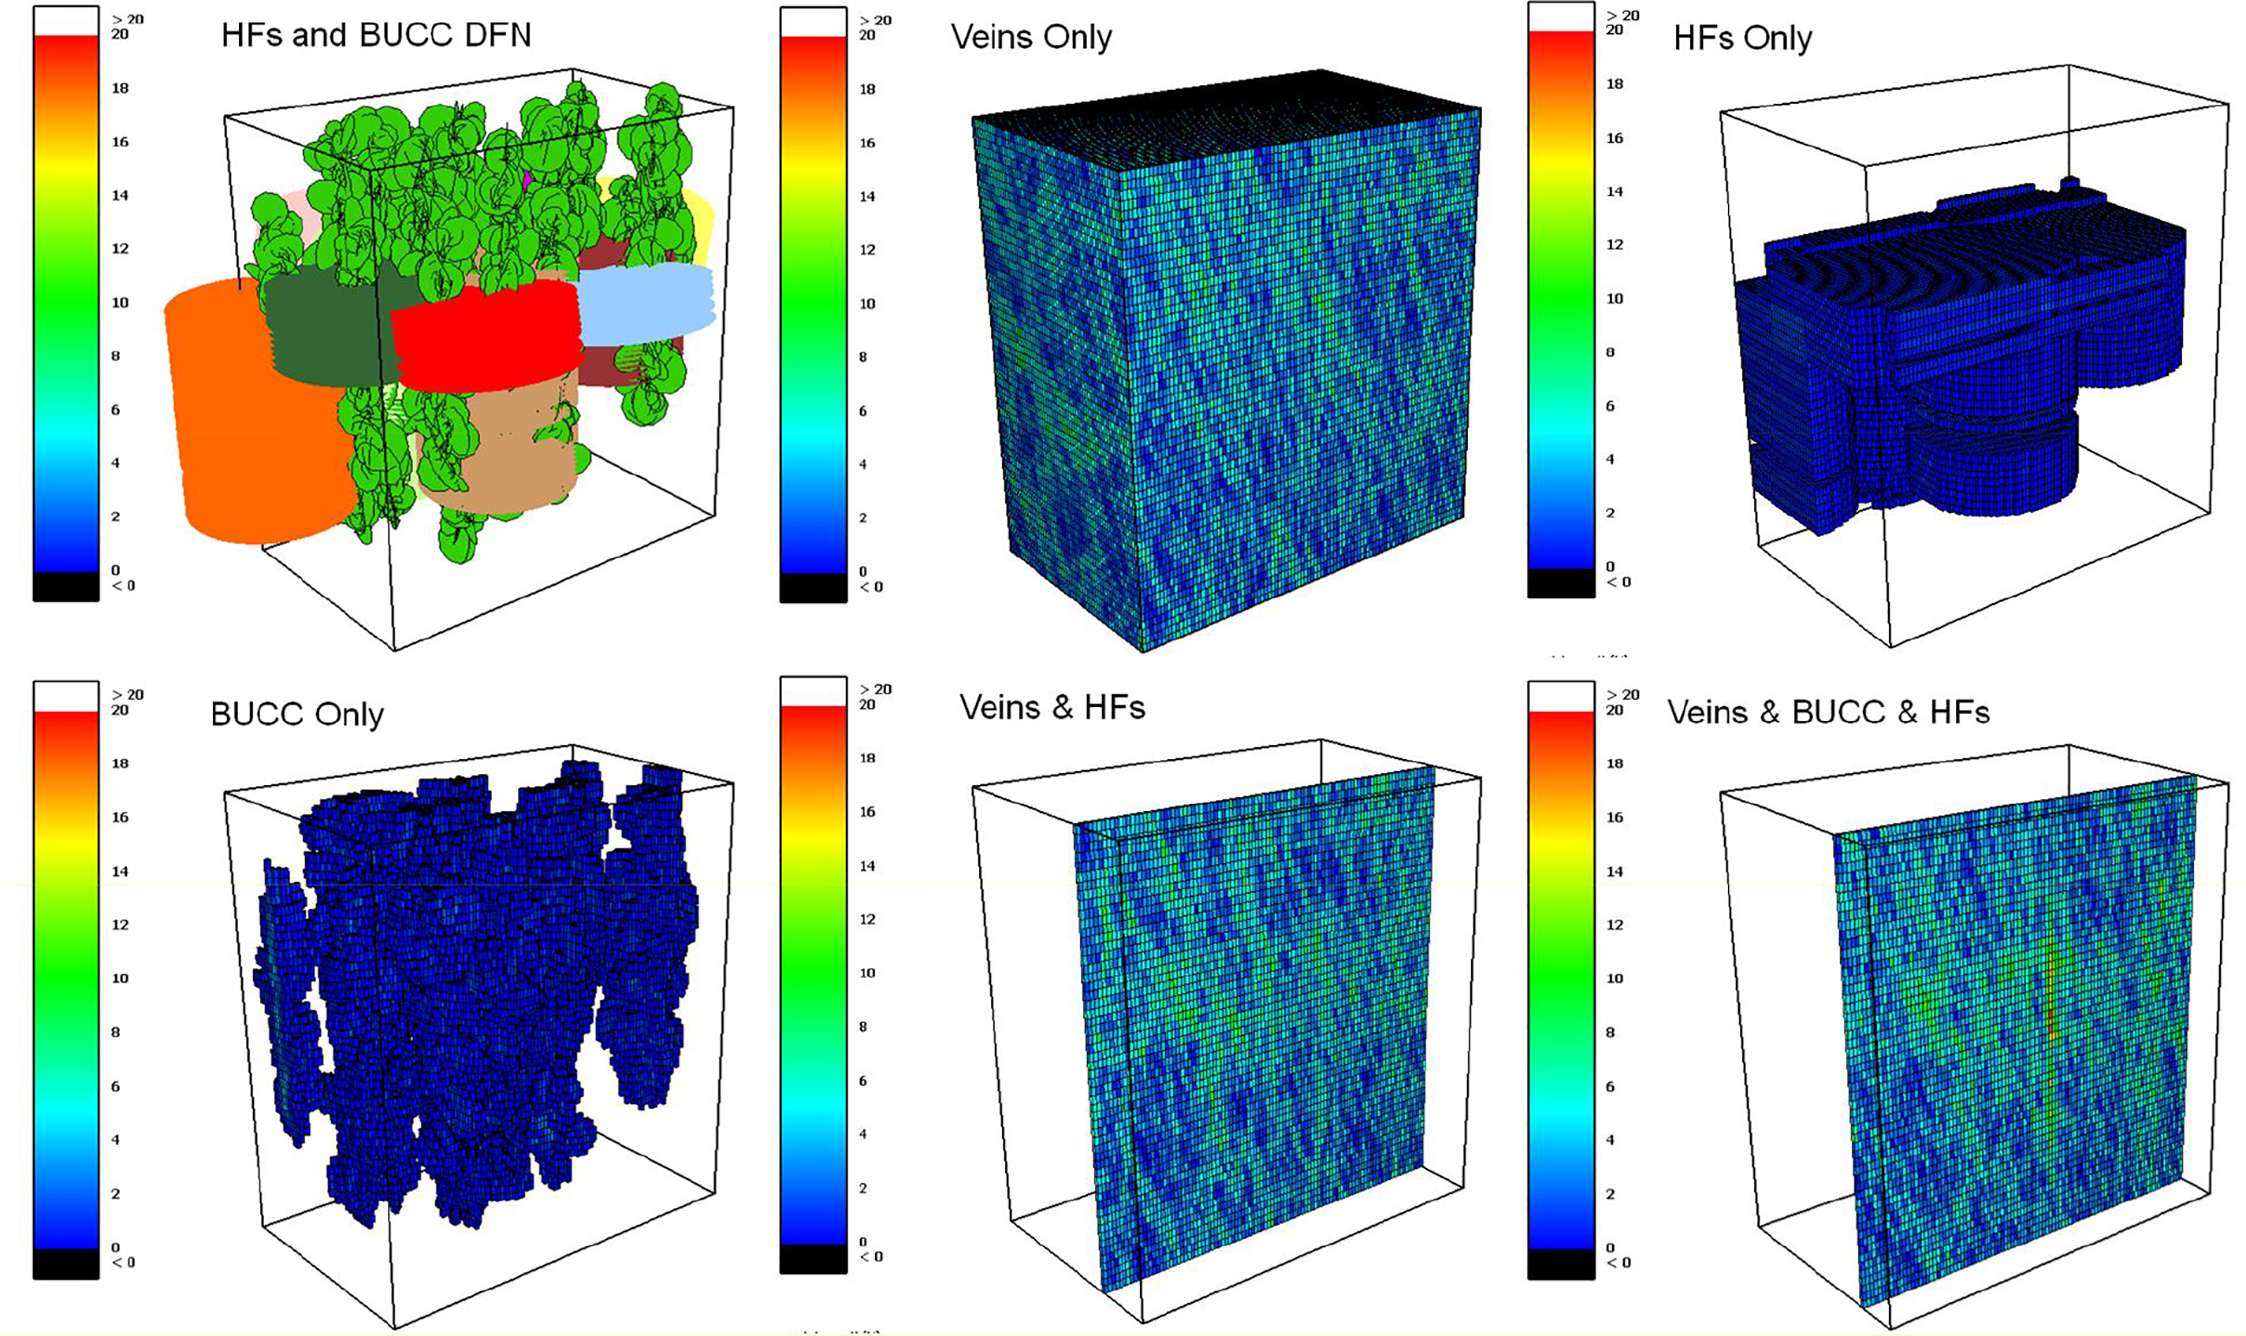
A number of models have been tested: a DFN comprising weaker veins with a P32 of 3.1♣m− 1 (considered to represent the main veins responsible for the breakage of the strong intact rock mass into blocks at the draw points), veins and BUCC, veins and HFs, and finally veins and BUCC and HFs. The DFN models and resulting fragmentation models are shown in Fig. 15 with the fragmentation curves for the models shown in Fig. 16.
Discrete fracture network (DFN) models and fragmentation results for veins only (top) and veins plus blasting under confined conditions (BUCC) plus HF fracture models (bottom). Fragmentation models coloured by block volume showing the significant change in fragmentation as a result of the pre-conditioning fractures
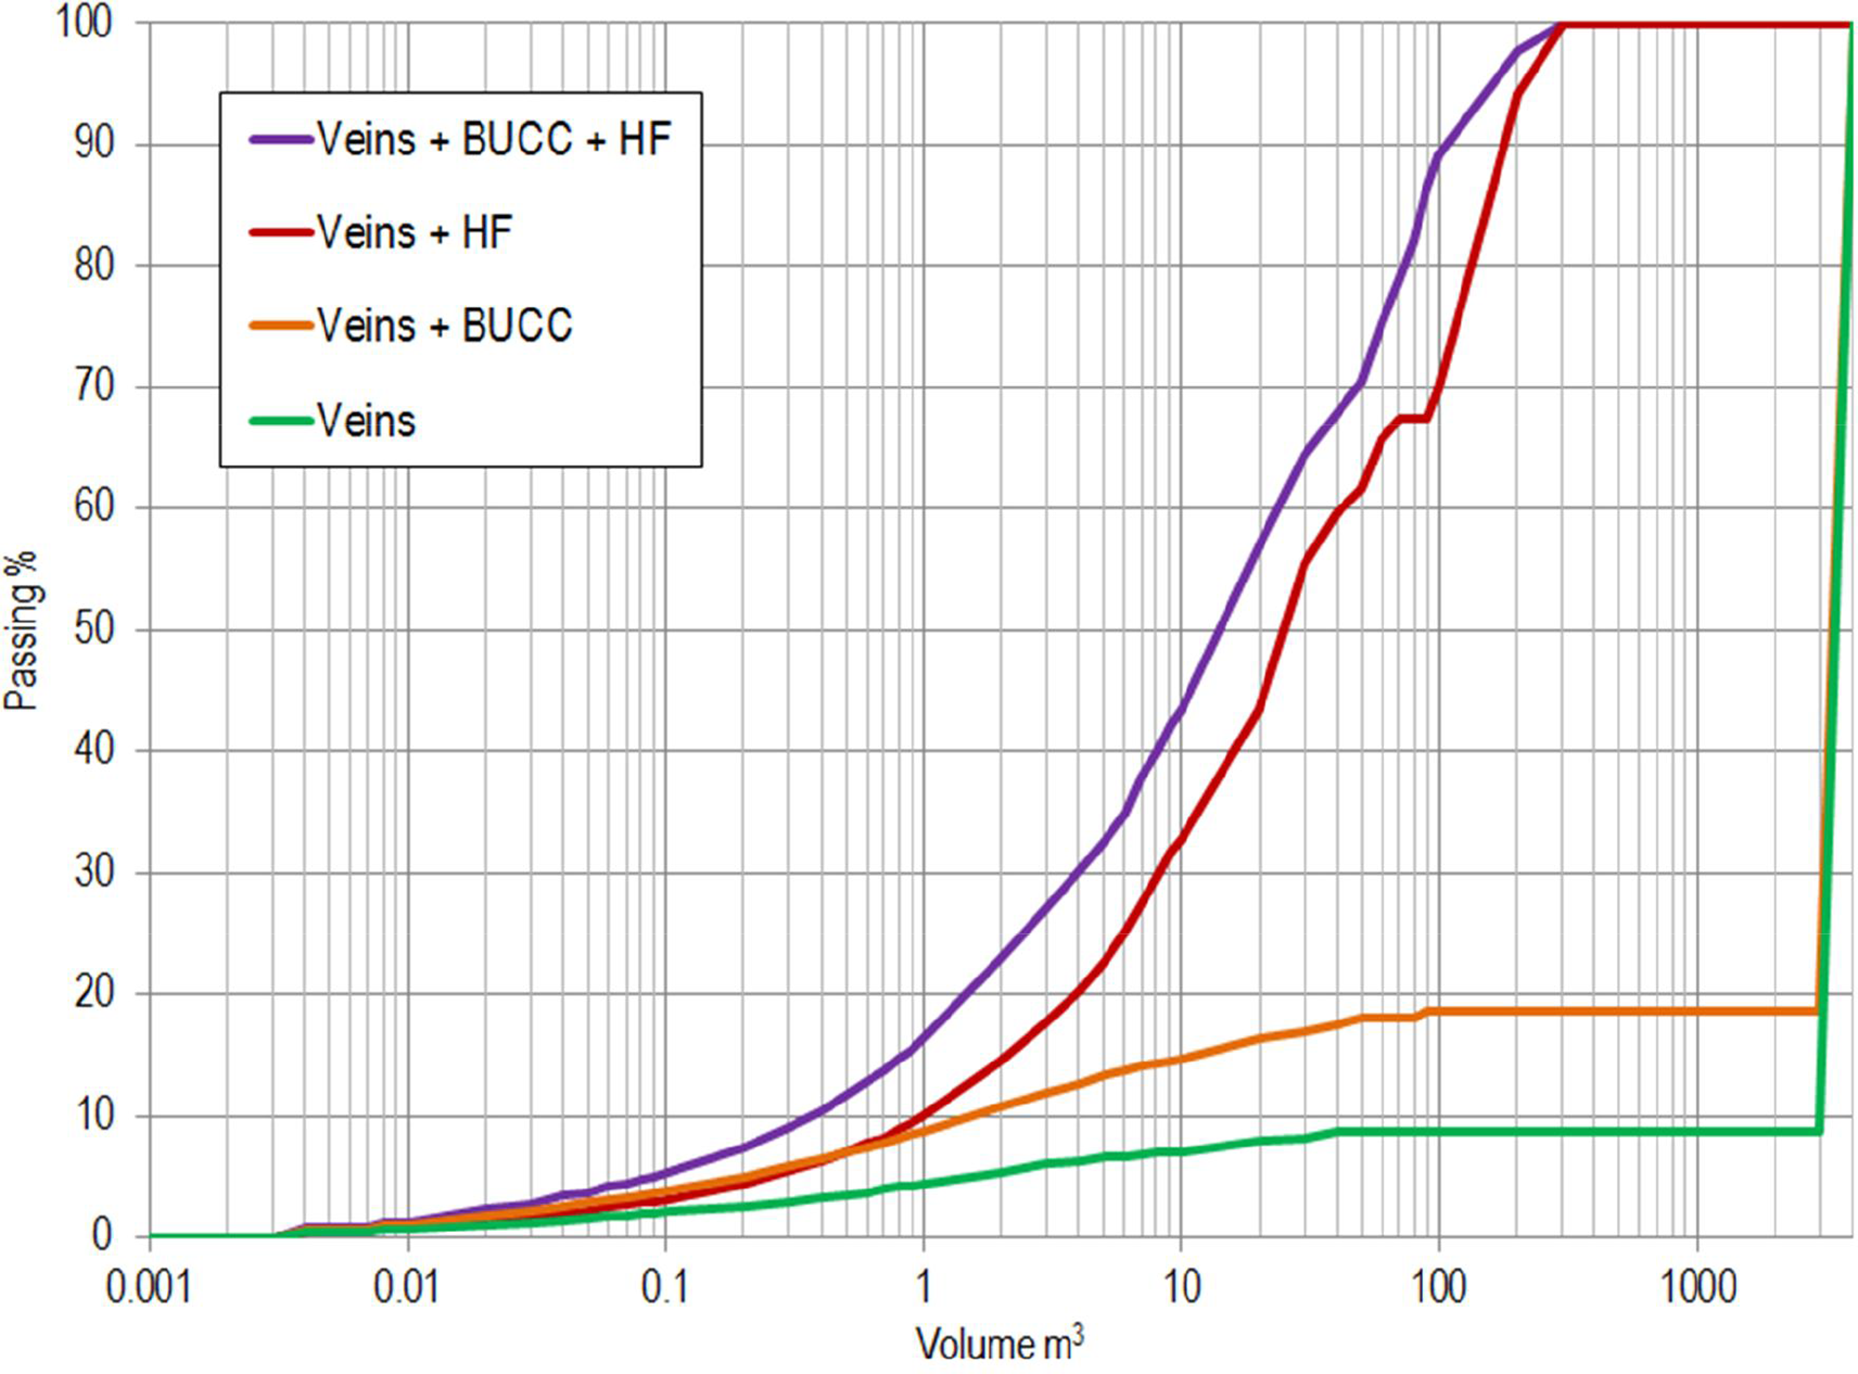
Fragmentation curves for discrete fracture network (DFN) simulations of the base case veins model plus differing pre-conditioning strategies
The fragmentation curves suggest that for the veins only model, the rock mass is typically massive with few blocks actually formed, primarily as a result of the limited length of the vein network. The addition of BUCC fractures increases the fragmentation slightly but it is only the HF fractures where we see a significant change in the rock mass fragmentation. In particular, the reduction in mean block size as a result of the application of both pre-conditioning approaches is notable, as a result of both the sub-vertical BUCC fractures and the sub horizontal HF fractures slicing through many of the larger blocks, see Fig. 15, top right.
The modelled reduction in mean block size is seen to be marginal for BUCC-based pre-conditioning, while being slightly more discernible for HF pre-conditioning. As shown in Fig. 16, the total volume impacted by the BUCC pre-conditioning is relatively small so the overall reduction of rock block volume will be significantly lower than that observed above because of the proportion of unaffected rock on the fragmentation observed at the draw points.
Observed fragmentation response to preconditioning
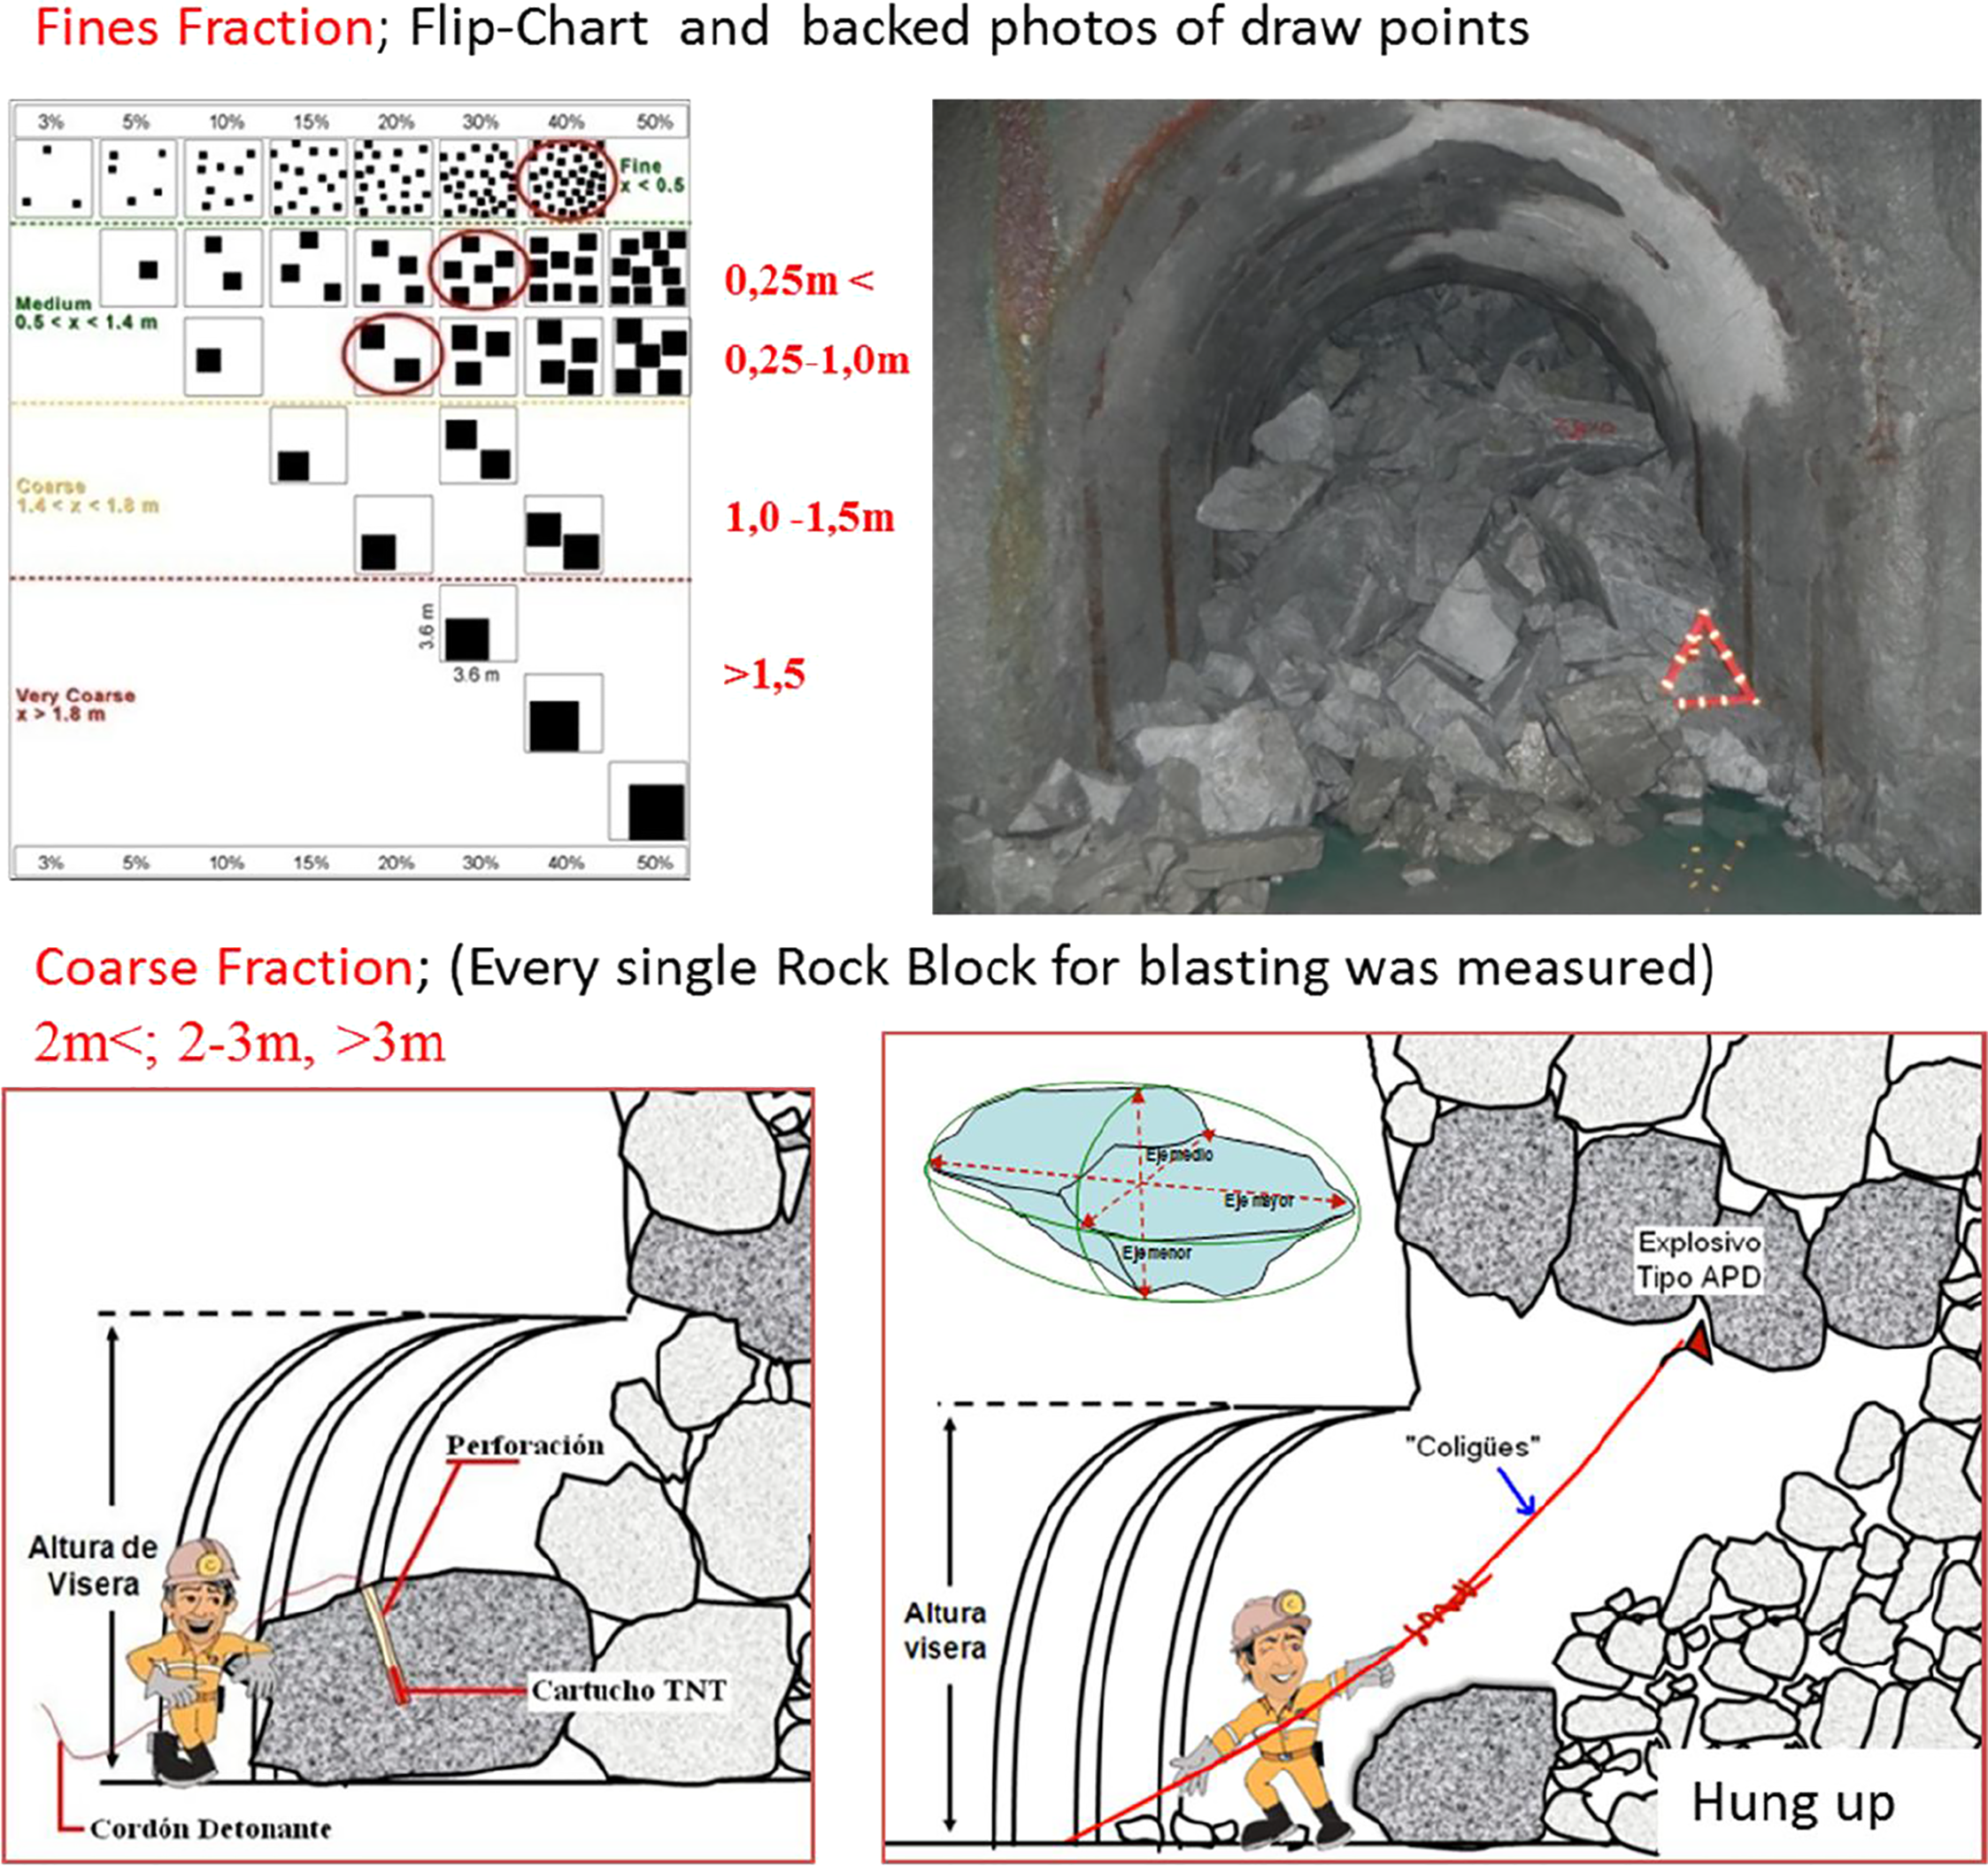
Fragmentation measurements were collected continuously from October 2010 considering two main portions of the block size distributions, namely: (a) the finer fraction that represent the muck material at the draw point, and (b) the coarser fraction that represent all larger blocks requiring secondary blasting for material handing or as a result of draw point hang ups. The methodology to collect fragmentation information and undertake data analysis is a follow:
The size distribution of the fine fraction are measured by visual inspection of the draw points in four size ranges; [ < 0.25♣m], [0.25–1.0♣m], [1.0–1.5♣m] and [1.5♣m>]. A comparative “flip chart” is used to help to estimate the percentages of each size range (Fig. 17). The coarse fraction represents all rock blocks identified during secondary blasting, either those that form hang ups in the draw bell or the large rock blocks on the production level floor that are too large for the LHD (load haul dump) trucks to carry out. The coarse fraction is counted in ranges of; [1.0–2.0♣m], [2.0–3.0♣m] and [>3.0♣m]. Each single rock block is characterised by its size dimensions (three mayor axis). With the rock block size data, the shape factor “f” (Gy 1967) is calculated. “f” is a dimensionless “particle shape parameter”, which varies between 0 and 1. The shape factor is obtained by the multiplication of the ratio of rock block major axes divided by the largest axis recorded. This parameter is necessary to convert the two dimensional observations of a rock block (e.g. in a draw point hang up) in to a three-dimensional volume and tonnage. It is important to note that all large rock blocks over the production level floor that the LHD cannot carry were fully characterised, with a statistical analysis being undertaken to estimate the fine and coarse fraction tonnage. Both size data are combined and correlated to the database of the mine production, which allows the mine to correlate each draw point with a range of data including date, shift, column height, extraction tonnages. Data analysis is undertaken for a certain number of draw points that have similar geological conditions and have received similar rock mass preconditioning. Scheme of fragmentation measurement methodology. The flip-chart (top left). Rock block in a draw point (top right). Rock block for secondary blasting (bottom left) and a hung up (bottom right). Rock block measurement for shape factor (middle)
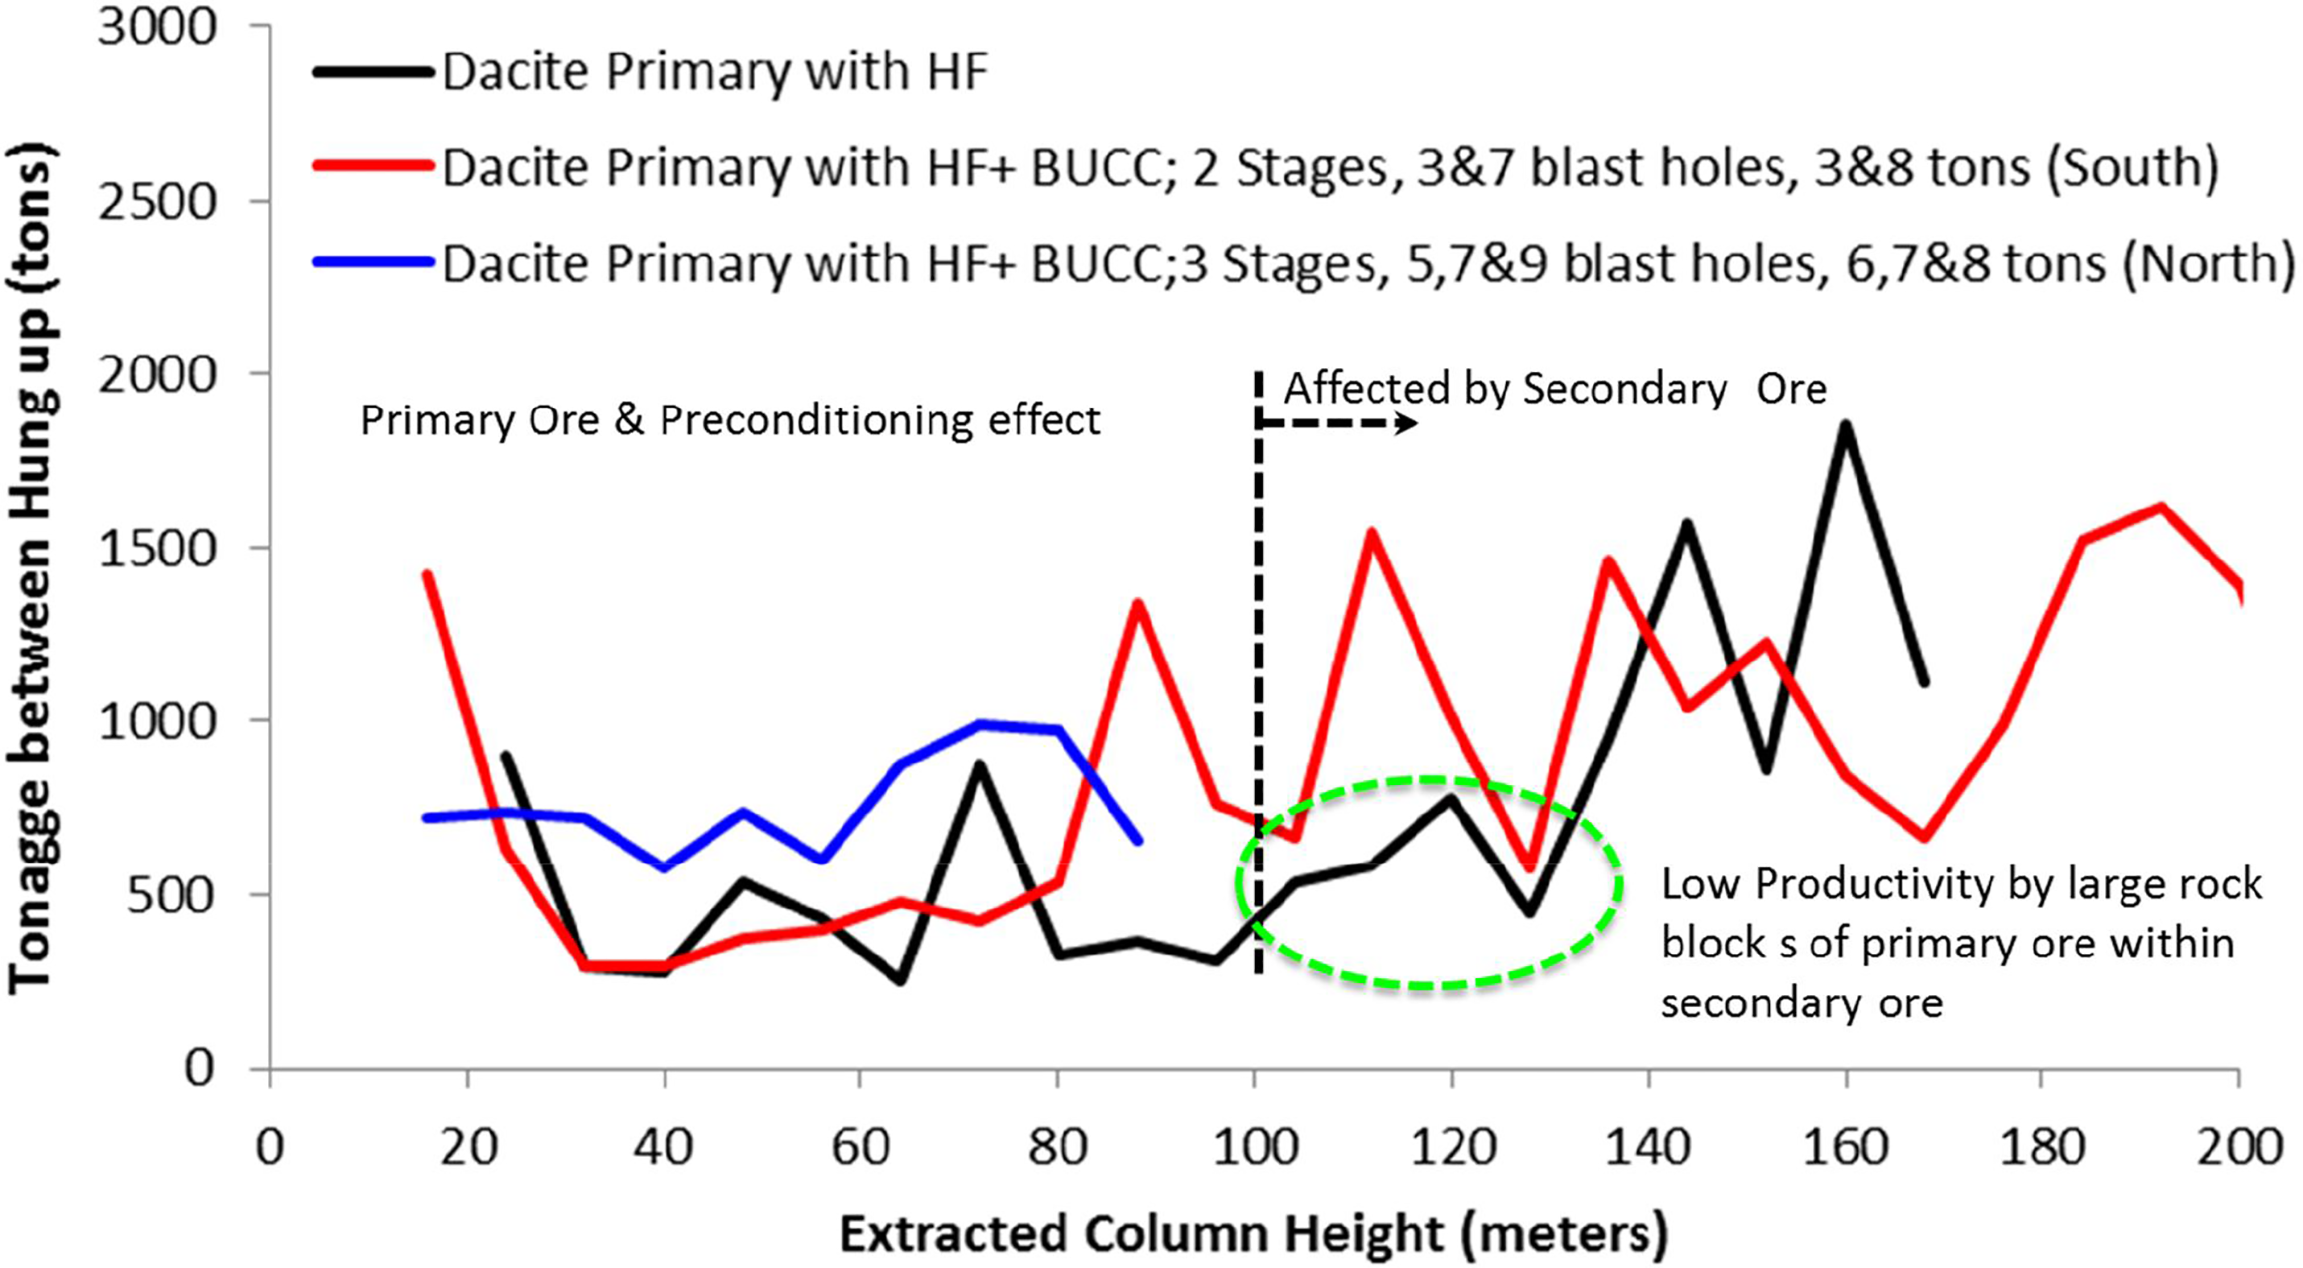
Hang up frequency observed of the three studied sub sectors through the extracted column height. Above 100♣m of the column height, the secondary ore influence appears in drawpoints. It is also indicated blasting under confined conditions (BUCC) blast sequence (stages, blast holes and tons of explosive used) to each BUCC sub mine sector
During the fragmentation measurement campaign, special attention was made to the identification of large rock blocks resulting in hang ups, especially those which took more than one shift to bring down from the draw bell. These large rock blocks were characterised as having their longest axes greater than 6♣m long. More than 40 cases were reported during the study, with some of these blocks taking more than 12 shifts to clear the draw bell. In some cases, the longest axis of the blocks was measured up to 14♣m long (known as “extreme cases”). In Fig. 19, the extreme cases of large blocks are shown over a map of the preconditioning intensity 30♣m above undercut level. In 80% of the cases, these large blocks were located where only HF was implemented, and in 50% of them, extreme cases were located where there the preconditioning intensity (P32) was < 0.24♣m2♣m− 3 of HF+BUCC fractures.
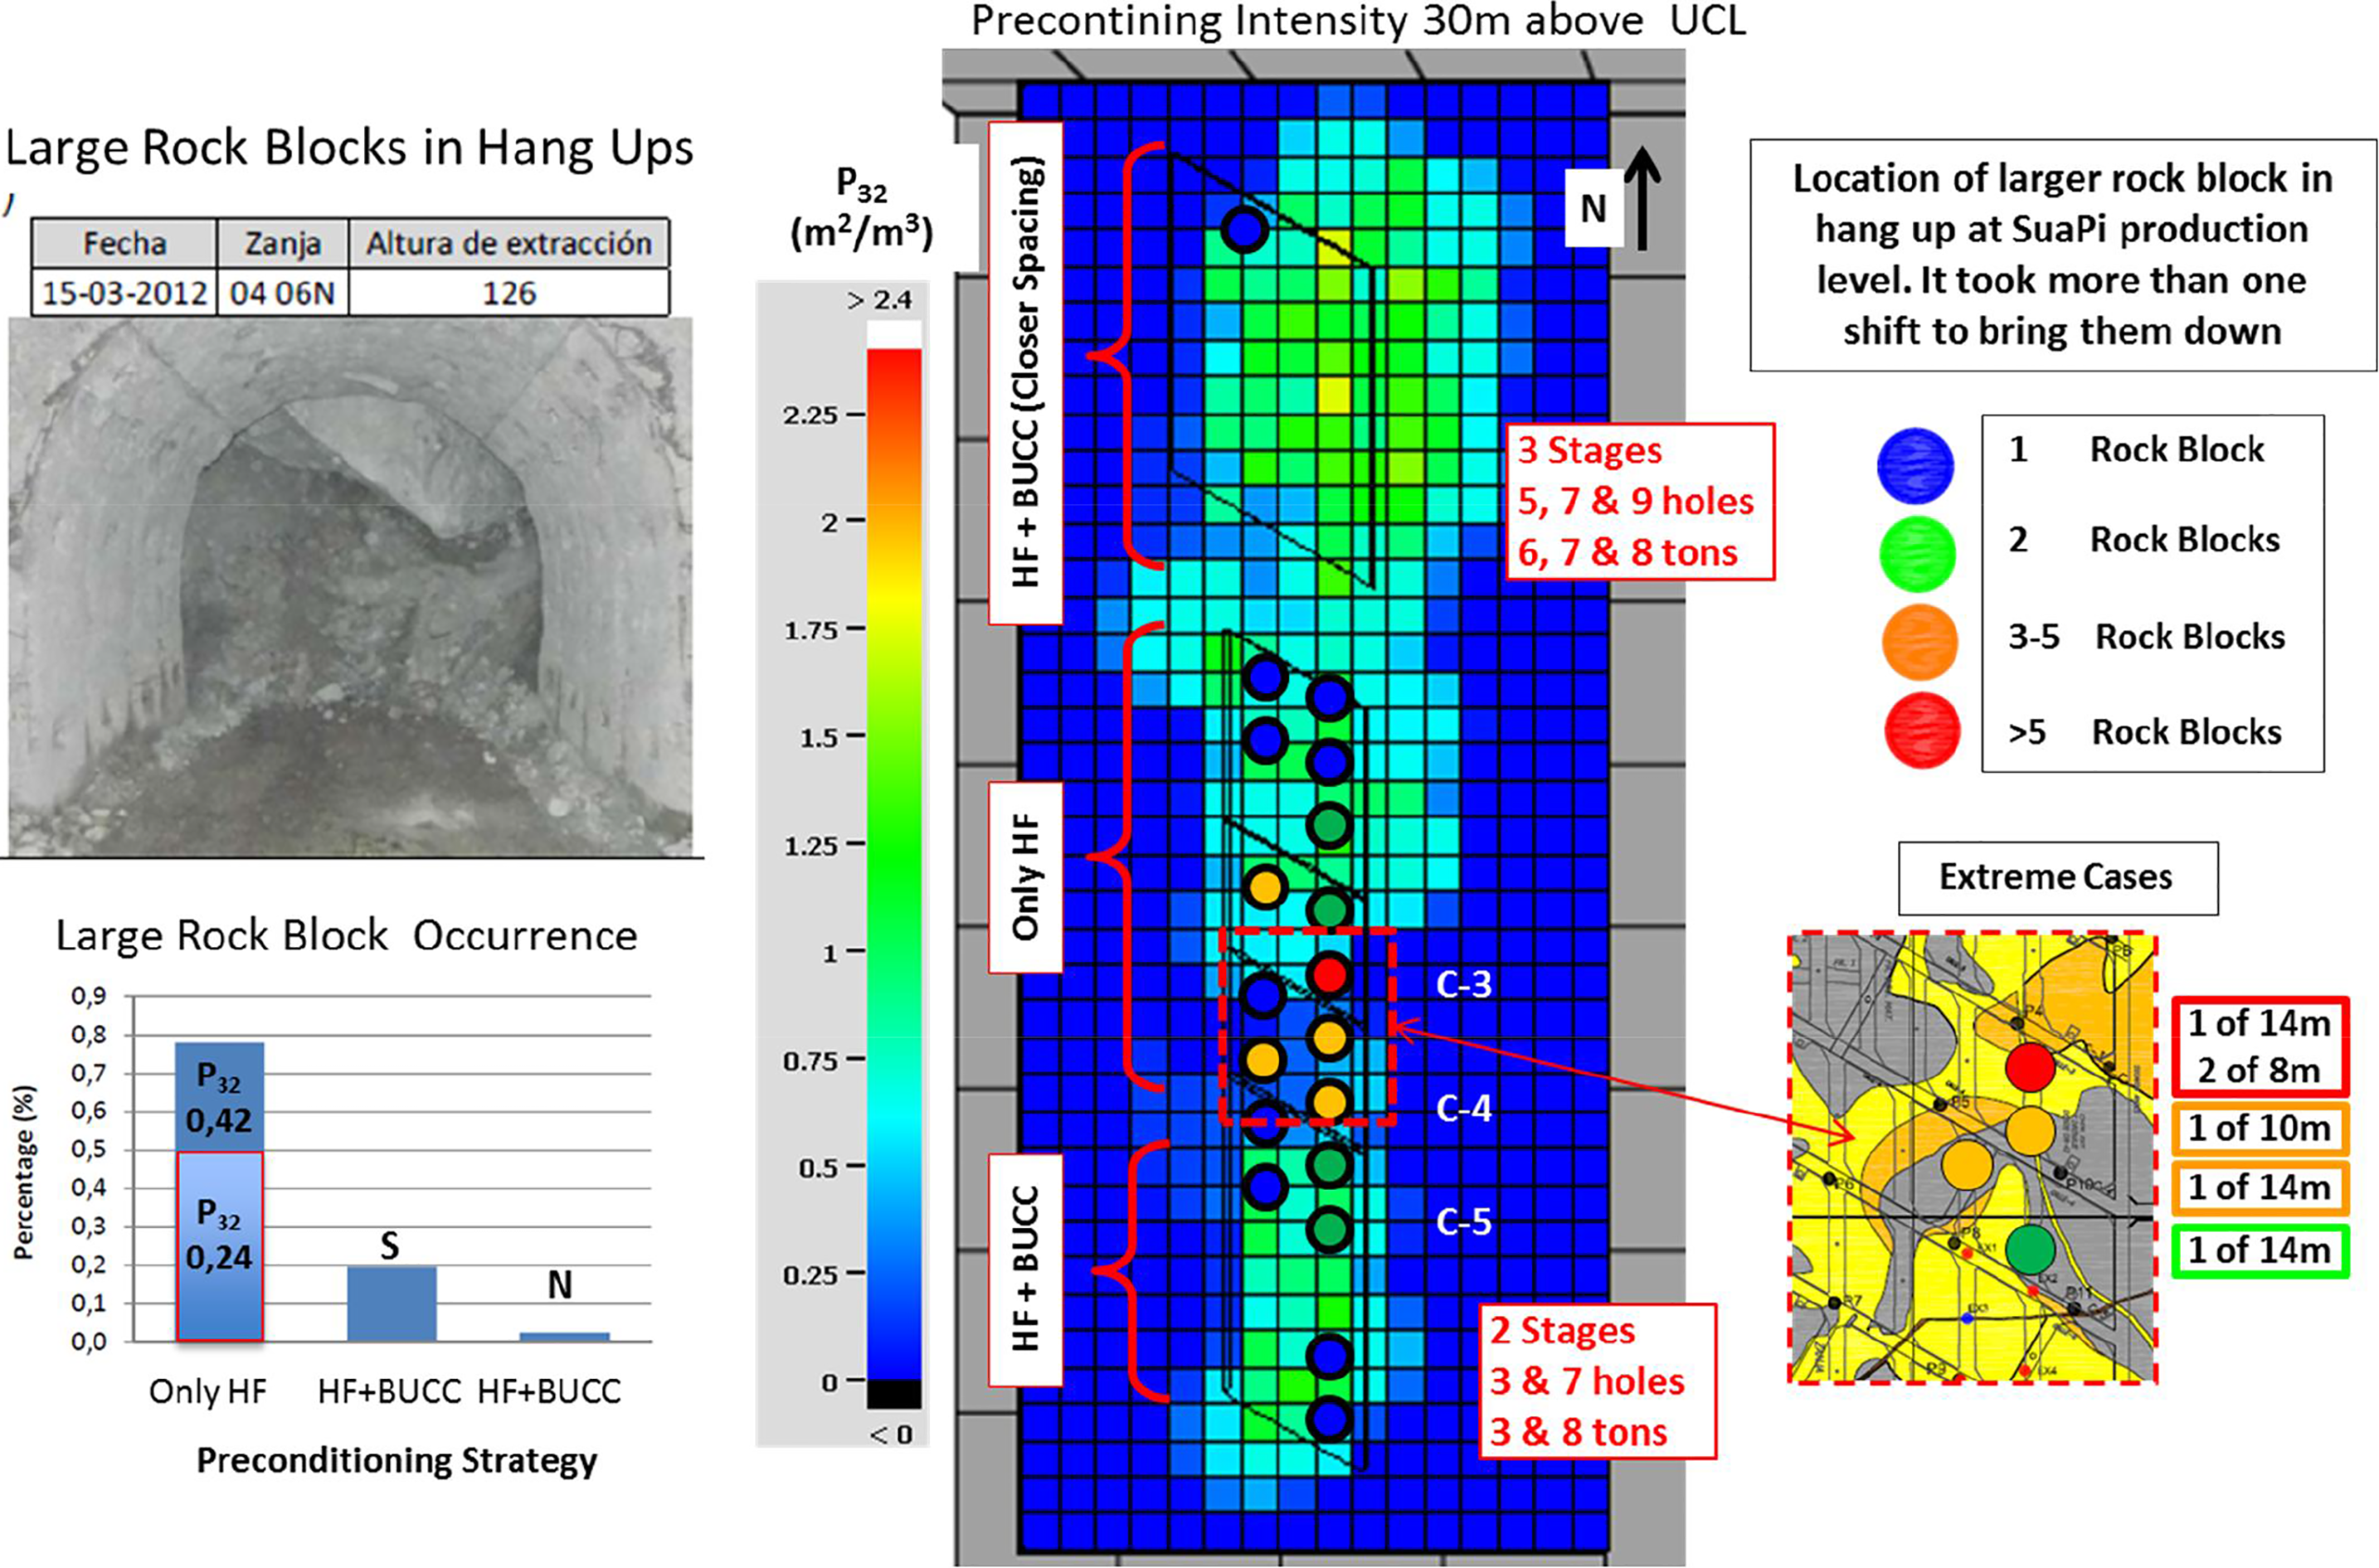
Plan view of SuaPi mine sector showing local preconditioning intensity and large rock block occurrence in hang up at the production level draw points (center). It is also shows detailed location and information of the hang ups with extreme case blocks (right). The occurrence of large rock blocks for each preconditioning strategy and precondition intensity can be seen at the left. Top left, example of a large rock block in hang up
Summary
In order to validate the effect of rock mass pre-conditioning, fragmentation measurements were undertaken at the Sur Andes Pipa mine sector within the El Teniente mine. As described previously, two different pre-conditioning techniques were implemented over the strong and massive Dacite rock mass. The main conclusions of the work were:
Both rock mass pre-conditioning techniques resulted in the generation of new open fractures within the virtually fracture free Dacite. HF fractures tend to have a sub-horizontal orientation (opening in the direction of (σ3) and BUCC fractures tend to have sub-vertical orientation. The relative contribution of the different pre-conditioning techniques was quantified by calculating their P32, the area of fracturing (m2) per volume unit (m3). Rock mass fracturing by HF resulted in a four times greater increase in fracture intensity than BUCC fracturing. However the combination of both the sub vertical BUCC fractures and the sub horizontal HF fractures, do make the largest impact in terms of fragmentation performace at the production level draw points. The operational response to pre-conditioning is well documented in Brzovic et al. (2014a). A considerable reduction (50%) of hang up frequency was observed in close proximity to the BUCC blast holes, but this was not seen with HF+BUCC or with only HF. Mapping of the location of large and extreme rock blocks observed in hang ups appeared to correlate with areas of low intensity (P32) of pre-conditioning, confirming the strong relationship between pre-conditioning intensity and fragmentation performance.
Acknowledgement
The authors acknowledge the El Teniente Division of Codelco-Chile for their permission to publish the data and for supporting this work. This study was funded by the Dacite Project and by API T10E202 both of Codelco-Chile. This paper was originally presented at the 1st International Conference on Discrete Fracture Engineering (DFNE 2014) (19–22 October 2014, Vancouver, BC, Canada) and has subsequently been revised and extended before consideration by Mining Technology.