
Abstract
Pre-split techniques are routinely used to minimise rock mass damage from production blasting. Design parameters rely on site-specific guidelines and in order to improve designs, it is important to be able to measure its performance. One criterion is related to the pre-split ability to adequately filter blast-induced stresses and explosion gases. This paper presents the results of a monitoring program implemented to evaluate the performance of pre-split practices. Triaxial accelerometers and pressure sensors were installed behind pre-split lines and a site-specific criterion was established to determine whether or not filtering effects were occurring. The recorded maximum peak particle velocity (PPV) vector sum behind pre-splits in all blasts monitored was below the threshold of damage of intact rock and rock mass discontinuities. With regards to the recorded gas pressure, measurements from production blasts showed fluctuations of low pressure levels, indicating that pre-split parameters were effectively filtering-induced stresses and gases.
Synopsis
Pre-split techniques are routinely used in surface mining operations to minimise rock mass damage from production blasting; and to help achieve bench, berm and inter-ramp design specifications. Pre-split design parameters rely largely on rules of thumb and/or site-specific guidelines. In order to continually improve designs at different stages of extraction; and across different geotechnical domains, it is important to be able to measure the performance of this artificially generated ‘fracture plane’. One criterion that can be used to verify the performance of a pre-split is related to its ability to adequately filter blast-induced stresses and explosion gases from both buffer and production rows. This paper presents the results of a monitoring program implemented to evaluate the performance of improved pre-split practices. Fit for purpose triaxial accelerometers and pressure sensors were installed behind several pre-split lines and a site-specific criterion was established to determine whether or not filtering effects were occurring. This paper describes the monitoring approach, instrumentation set up and overall results. The recorded maximum peak particle velocity (PPV) vector sum behind pre-splits in all blasts monitored was below the threshold of damage of intact rock and rock mass discontinuities. Differences in peak particle velocities between stations of the same blast were attributed to changes in the degree of confinement as the detonation front moved across the blast pattern. With regards to the recorded gas pressure data, measurements from production blasts showed fluctuations of low pressure levels in all cases. From the analysis of monitored data, pre-split design parameters implemented in the domains monitored at Centinela Sulphide mine were effective at filtering blast-induced stresses and gases. It was recommended that parameters be maintained and quality of implementation controlled. Future work is focusing on further developing and streamlining monitoring techniques with the use of wireless technology and advances in portable data acquisition systems.
Introduction
High intensity blasting has become common industry practice since the introduction and demonstrated benefits of Mine to Mill and excavation productivity improvement strategies (Scott, Kanchibotla and Morrell 1999; Kojovic, Kanchibotla, Poetschka and Chapman 1998, Kanchibotla, Morell, Valery and Loughlin 1998; Onederra, Brunton, Battista and Grace 2004). Powder factors or kilograms of explosives per unit volume of rock blasted have more than doubled in recent years. This has in many ways increased the potential for damage to the rock surrounding the blasted zones, particularly when wall control design parameters have not been adequately validated and implementation practices are poor. In situations where the surrounding rock represents the final pit walls, blast damage may adversely impact on subsequent wall stability. As reported by Sullivan (2006), when the formation of stable pit walls is compromised, so too is the safety of staff and the economics of the operation; it is therefore imperative that all geotechnical requirements are met.
There are a number of techniques currently applied to minimise blast damage and achieve geotechnical design requirements in open pit mines. These include trim blasting, cushion blasting, pre-split or mid-split blasting, post-split blasting and line drilling (Read and Stacey 2009). Each technique has specific advantages and disadvantages that limit their use to specific rock conditions and or design requirements. It is, however, well documented that pre-splits are the most commonly used wall control technique in modern mining operations and is second to line drilling in its effectiveness to achieve geotechnical design (Hustrulid 1999).
Pre-split blasting involves drilling a row of closely spaced holes along the designed dig limit. These holes are generally loaded with decoupled charges to split the gap between holes in tension without causing compressional damage to the final wall. It is widely agreed that the objective of any pre-split blast is to create an artificial plane or discontinuity, which will function as a barrier to both vibration and gas penetration, thus affording a degree of protection to the rock mass behind the pre-split line. In most cases, the design process of pre-splits only relies on rules of thumb and requires on-site adjustments and improvements based on measurable indicators.
This particular work focused on the direct measurement of the in situ performance of pre-split practices implemented at the Centinela Sulphide Mine (formerly known as Esperanza Mine), which is an open pit sulphide deposit located at the Northern Chile. The project involved a targeted on-site monitoring campaign utilising the latest instrumentation and measurement techniques available. One of the objectives of this campaign was to measure peak particle acceleration, velocity and gas pressures behind pre-split lines with the view to evaluate its effectiveness as a filtering medium to both stress-induced and gas penetration damage mechanisms. The work presented here complements a comprehensive geotechnical and blast performance evaluation program discussed by Catalan and Onederra (2015).
Production and wall control blasting practices
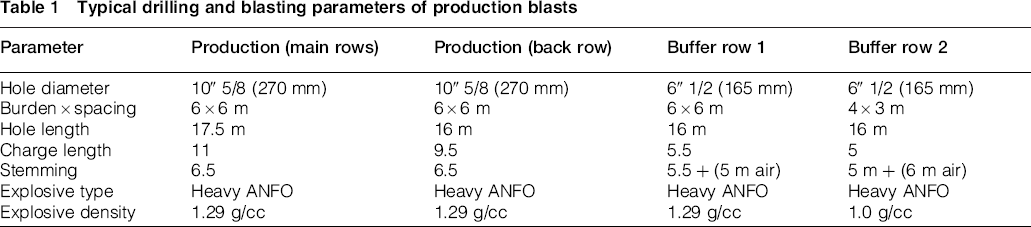
Production blasting practices at Centinela Sulphide Mine consist of drilling both back and main production rows with 270 mm diameter blastholes. Buffer rows are drilled with 165 mm diameter blastholes and form part of a single production shot. Design parameters are summarised in Table 1, after Catalan and Onederra (2015). Wall control practices involve both pre-split and buffer blasting techniques. Pre-splits are drilled with 165 m diameter blastholes spaced at a distance of 2.0 m. They are fired ahead of the combined production and buffer blasts as shown in Fig. 1. Pre-splits were decoupled and charged with a 12 m length, 38 mm cartridge emulsion called ENALINE. This product produced by ENAEX Chile S.A. is a cartridge emulsion of continuous lengths specifically designed for pre-split applications. Inside the ENALINE sleeve, a detonating cord of 10 g m− 1 is embedded, which enhances lateral and simultaneous detonation. It should be noted that pre-split blastholes were generally left unstemmed.
Typical drilling and blasting parameters of production blasts
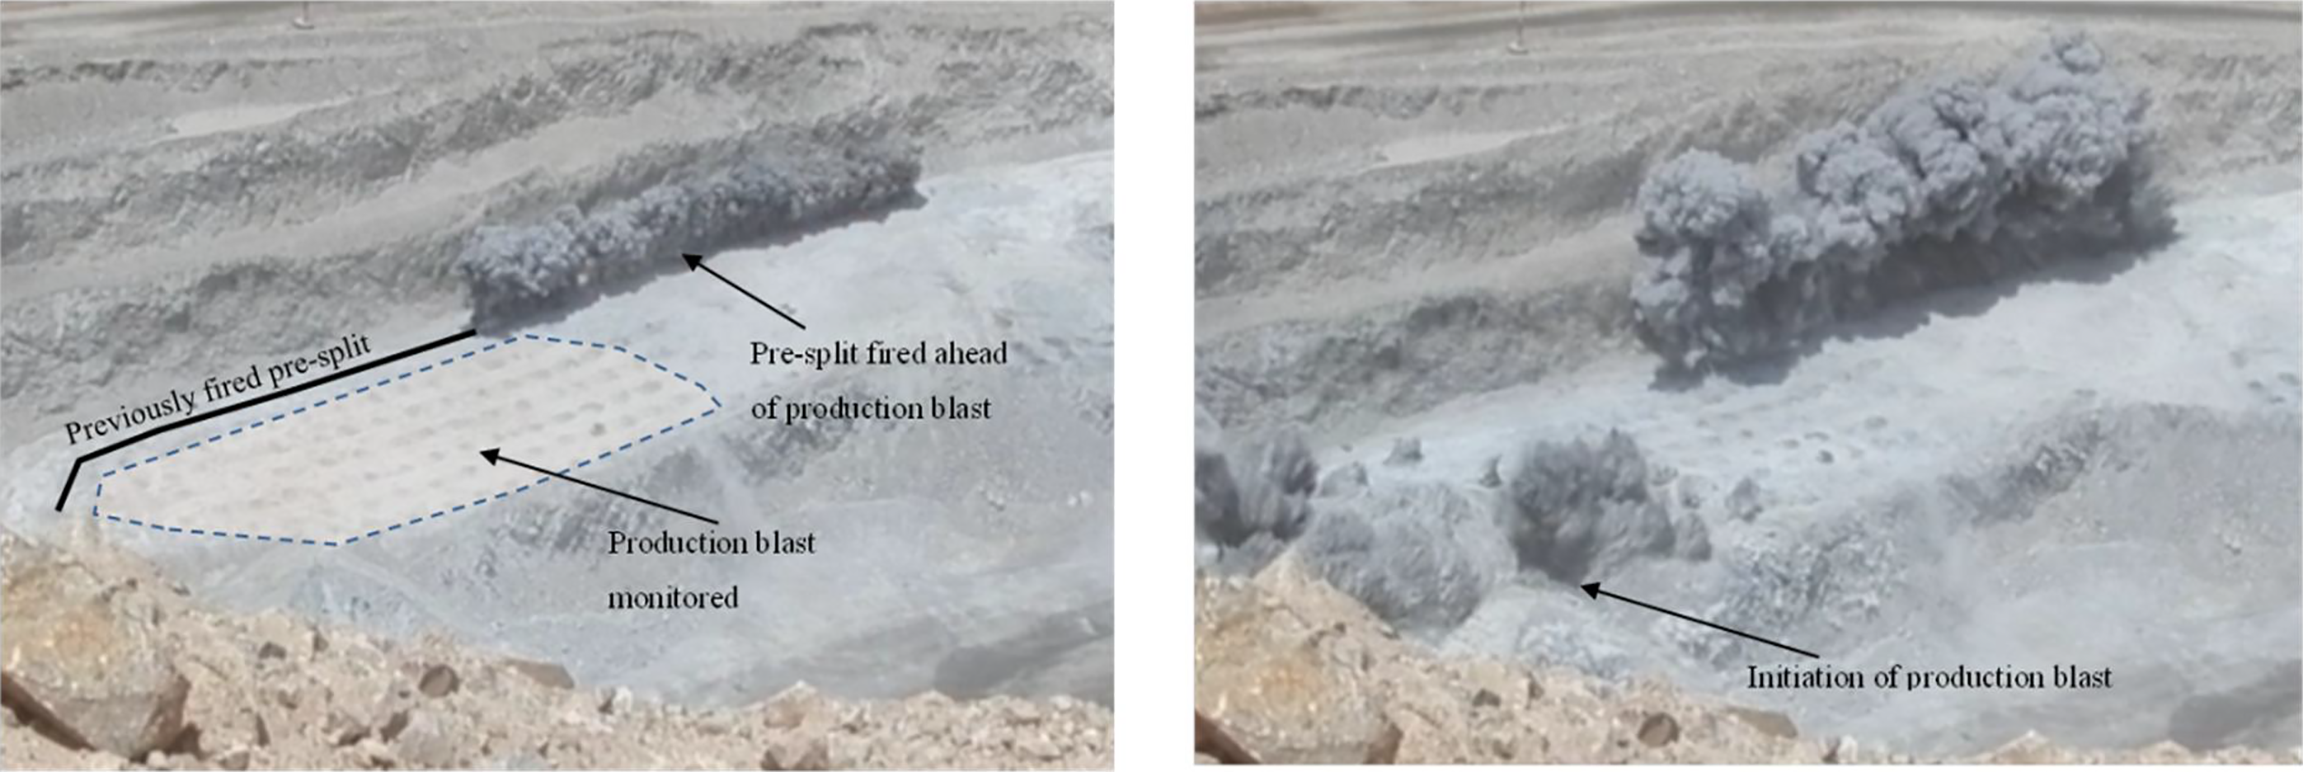
Typical blasting sequence with pre-split fired ahead of production blast being monitored [i.e. blast F02B2008_10B_11 after Catalan and Onederra (2015)]
Monitoring program and instrumentation set up
The blast monitoring program consisted of two campaigns in two distinct areas of the Centinela Sulphide pit. A total of six production and buffer blasts were monitored by 12 monitoring stations, two at each blast. Monitoring stations for each zone were selected based on access and berm conditions and were approximately 3 m behind the pre-split line. The distance between stations was a function of the size of the blast and was approximately 30 m apart. Figure 2 gives a broad view of the position of monitoring stations with respect to one of the blasts monitored. An example of the actual location of stations with respect to a typical production blast is shown in Fig. 3. Details of the instrumentation set up and a depiction of the installation process are given in Figs. 4 and 5, respectively.
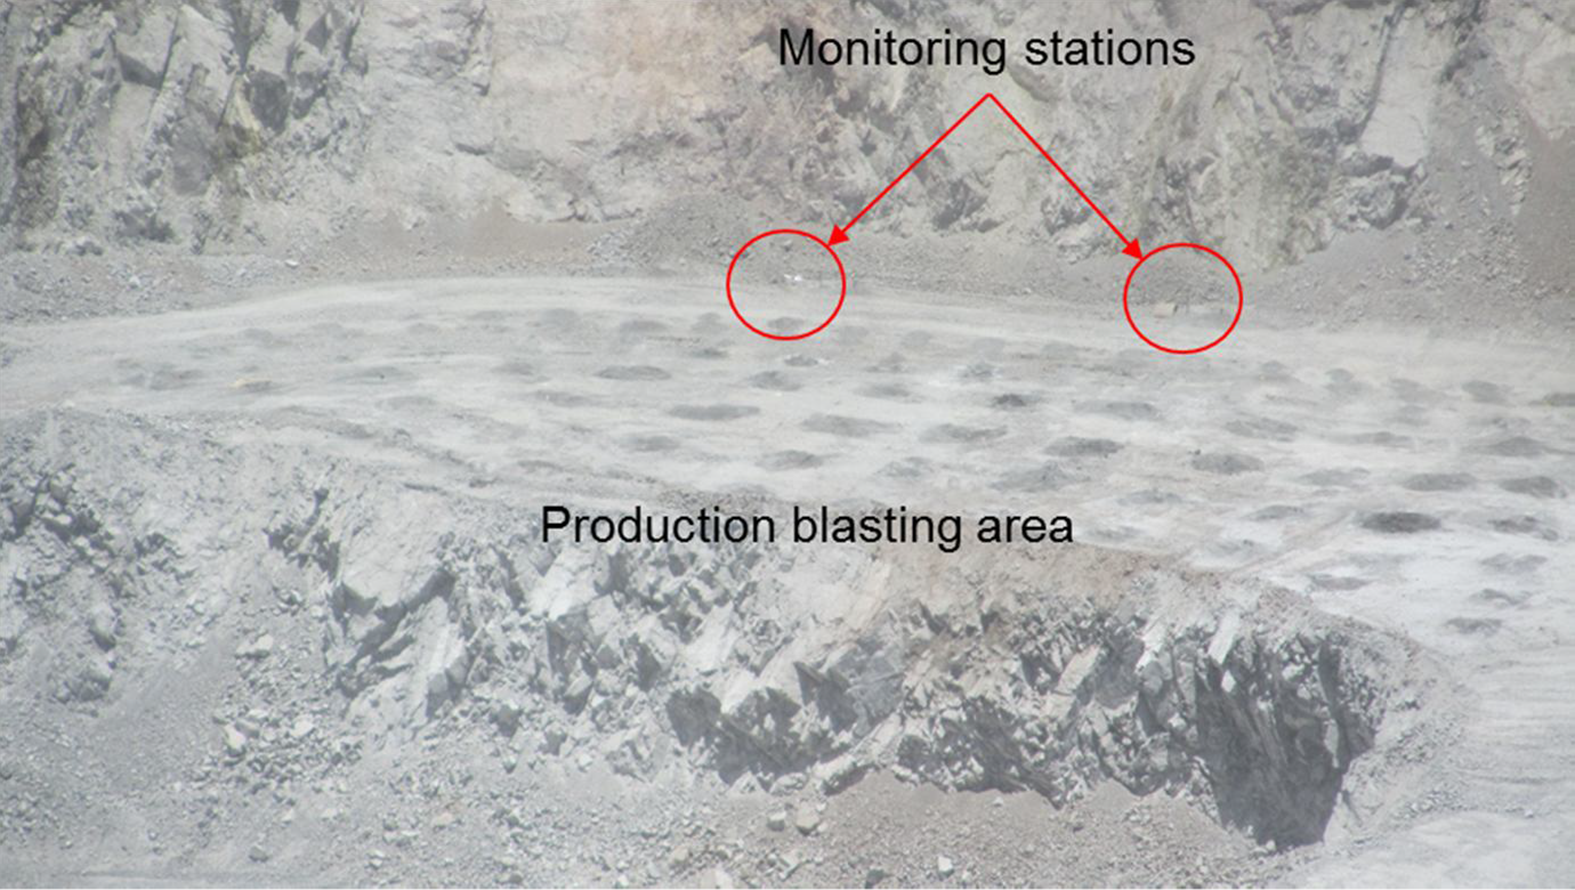
Monitoring stations with respect to one of the monitored blasts
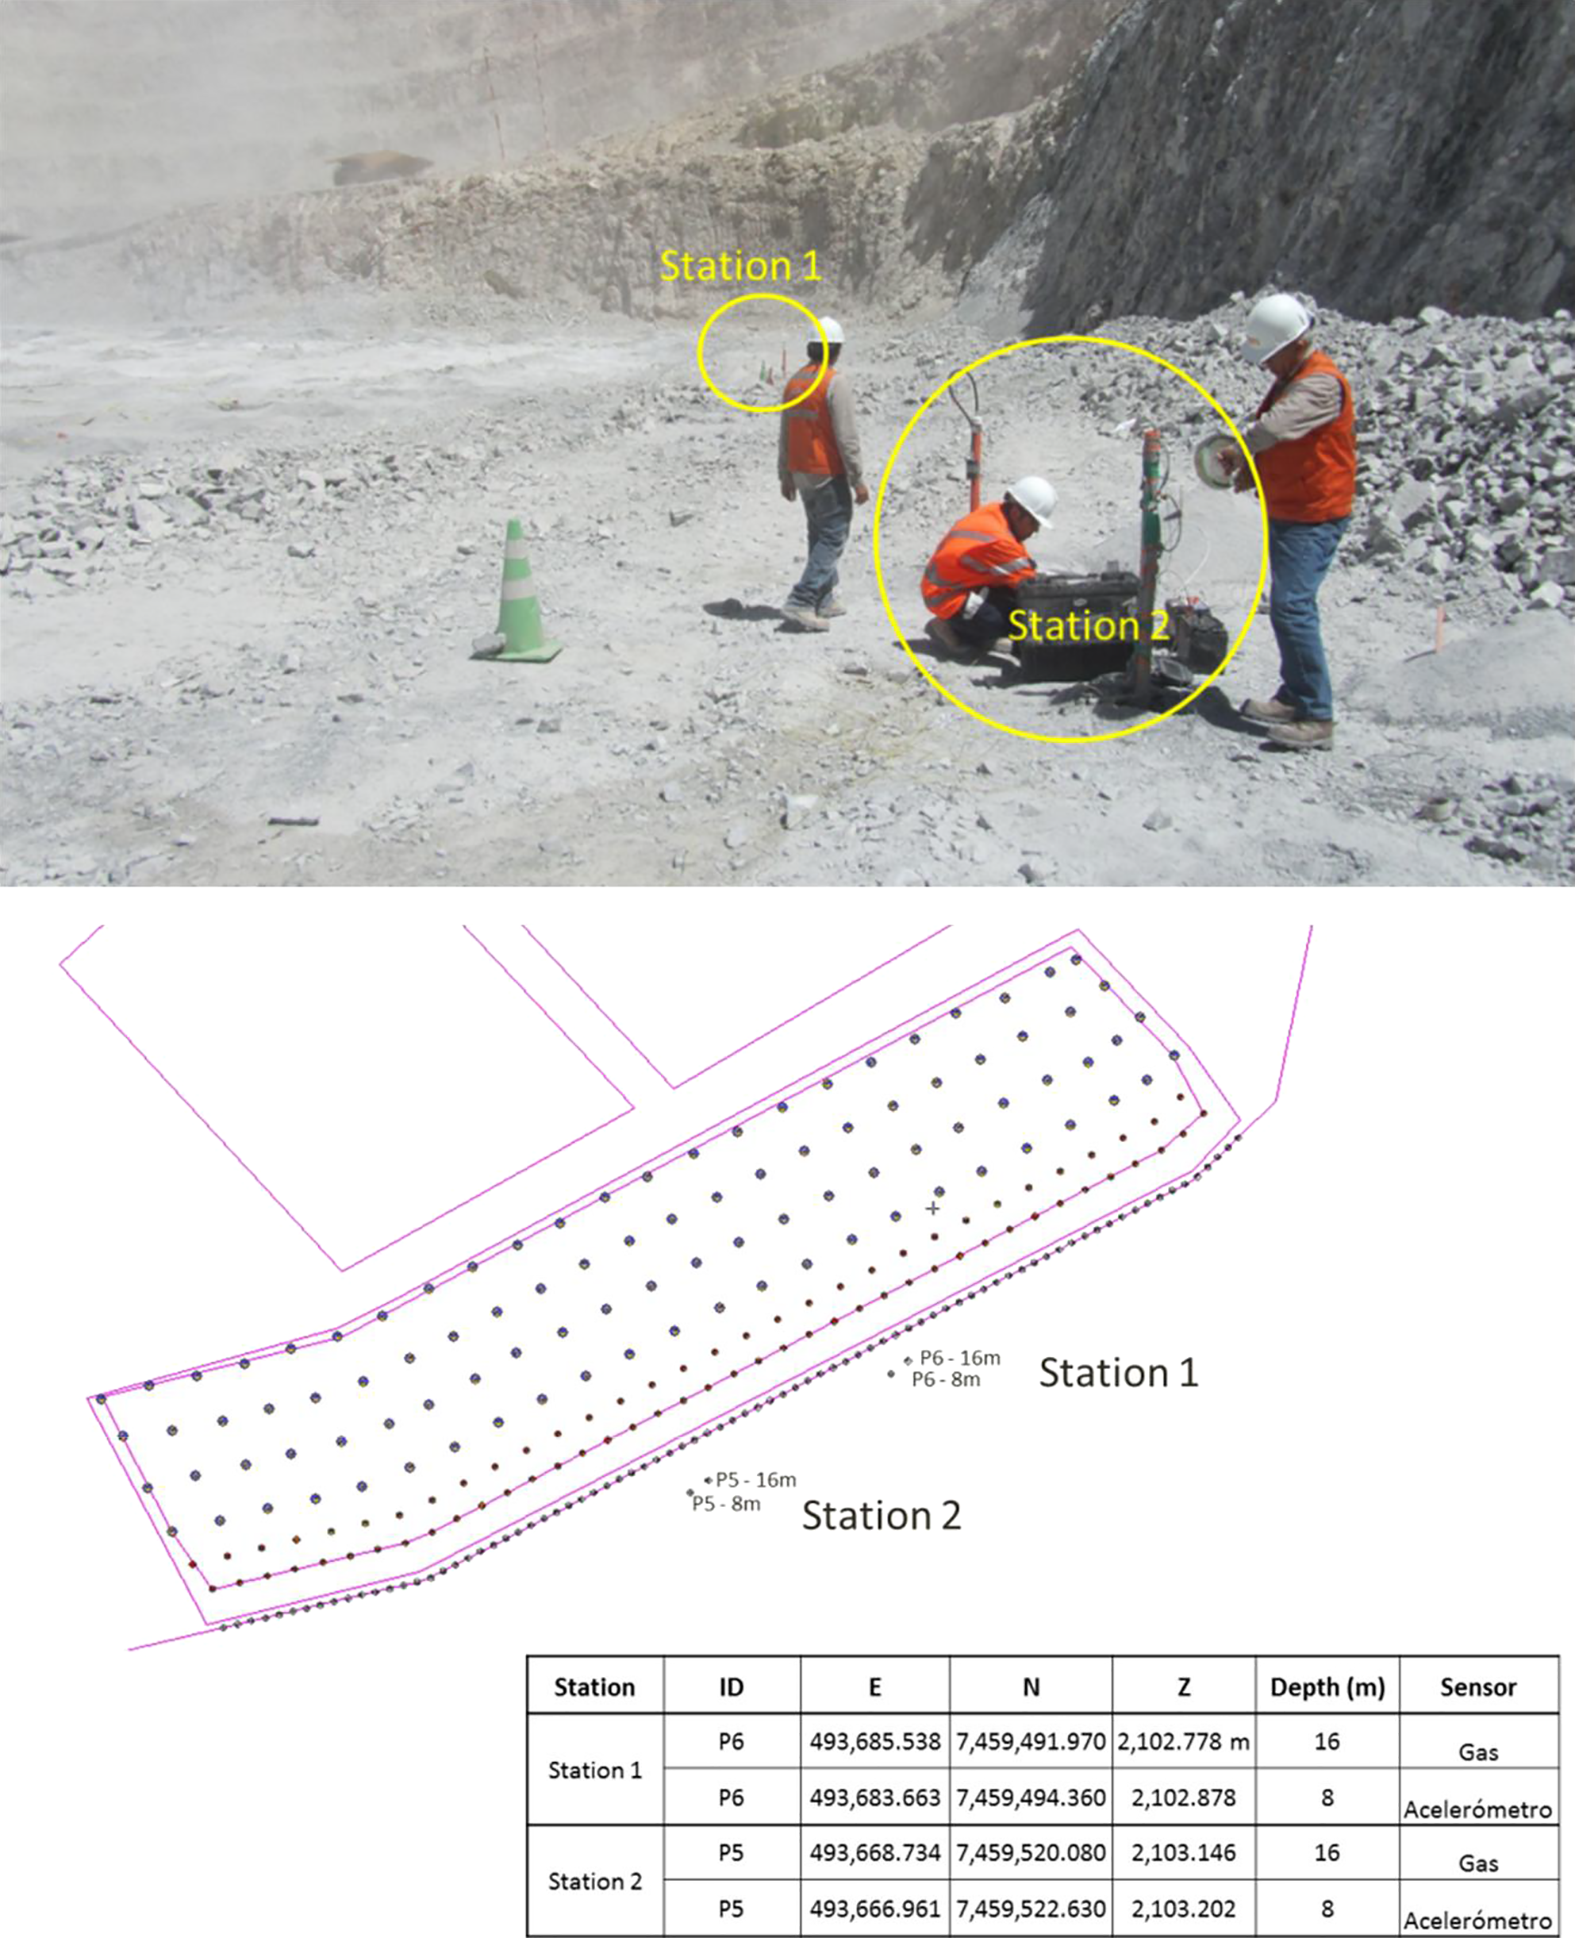
Example location of triaxial accelerometers and pressure sensors for one of the production blasts monitored (i.e. blast T_F03B2088_312)
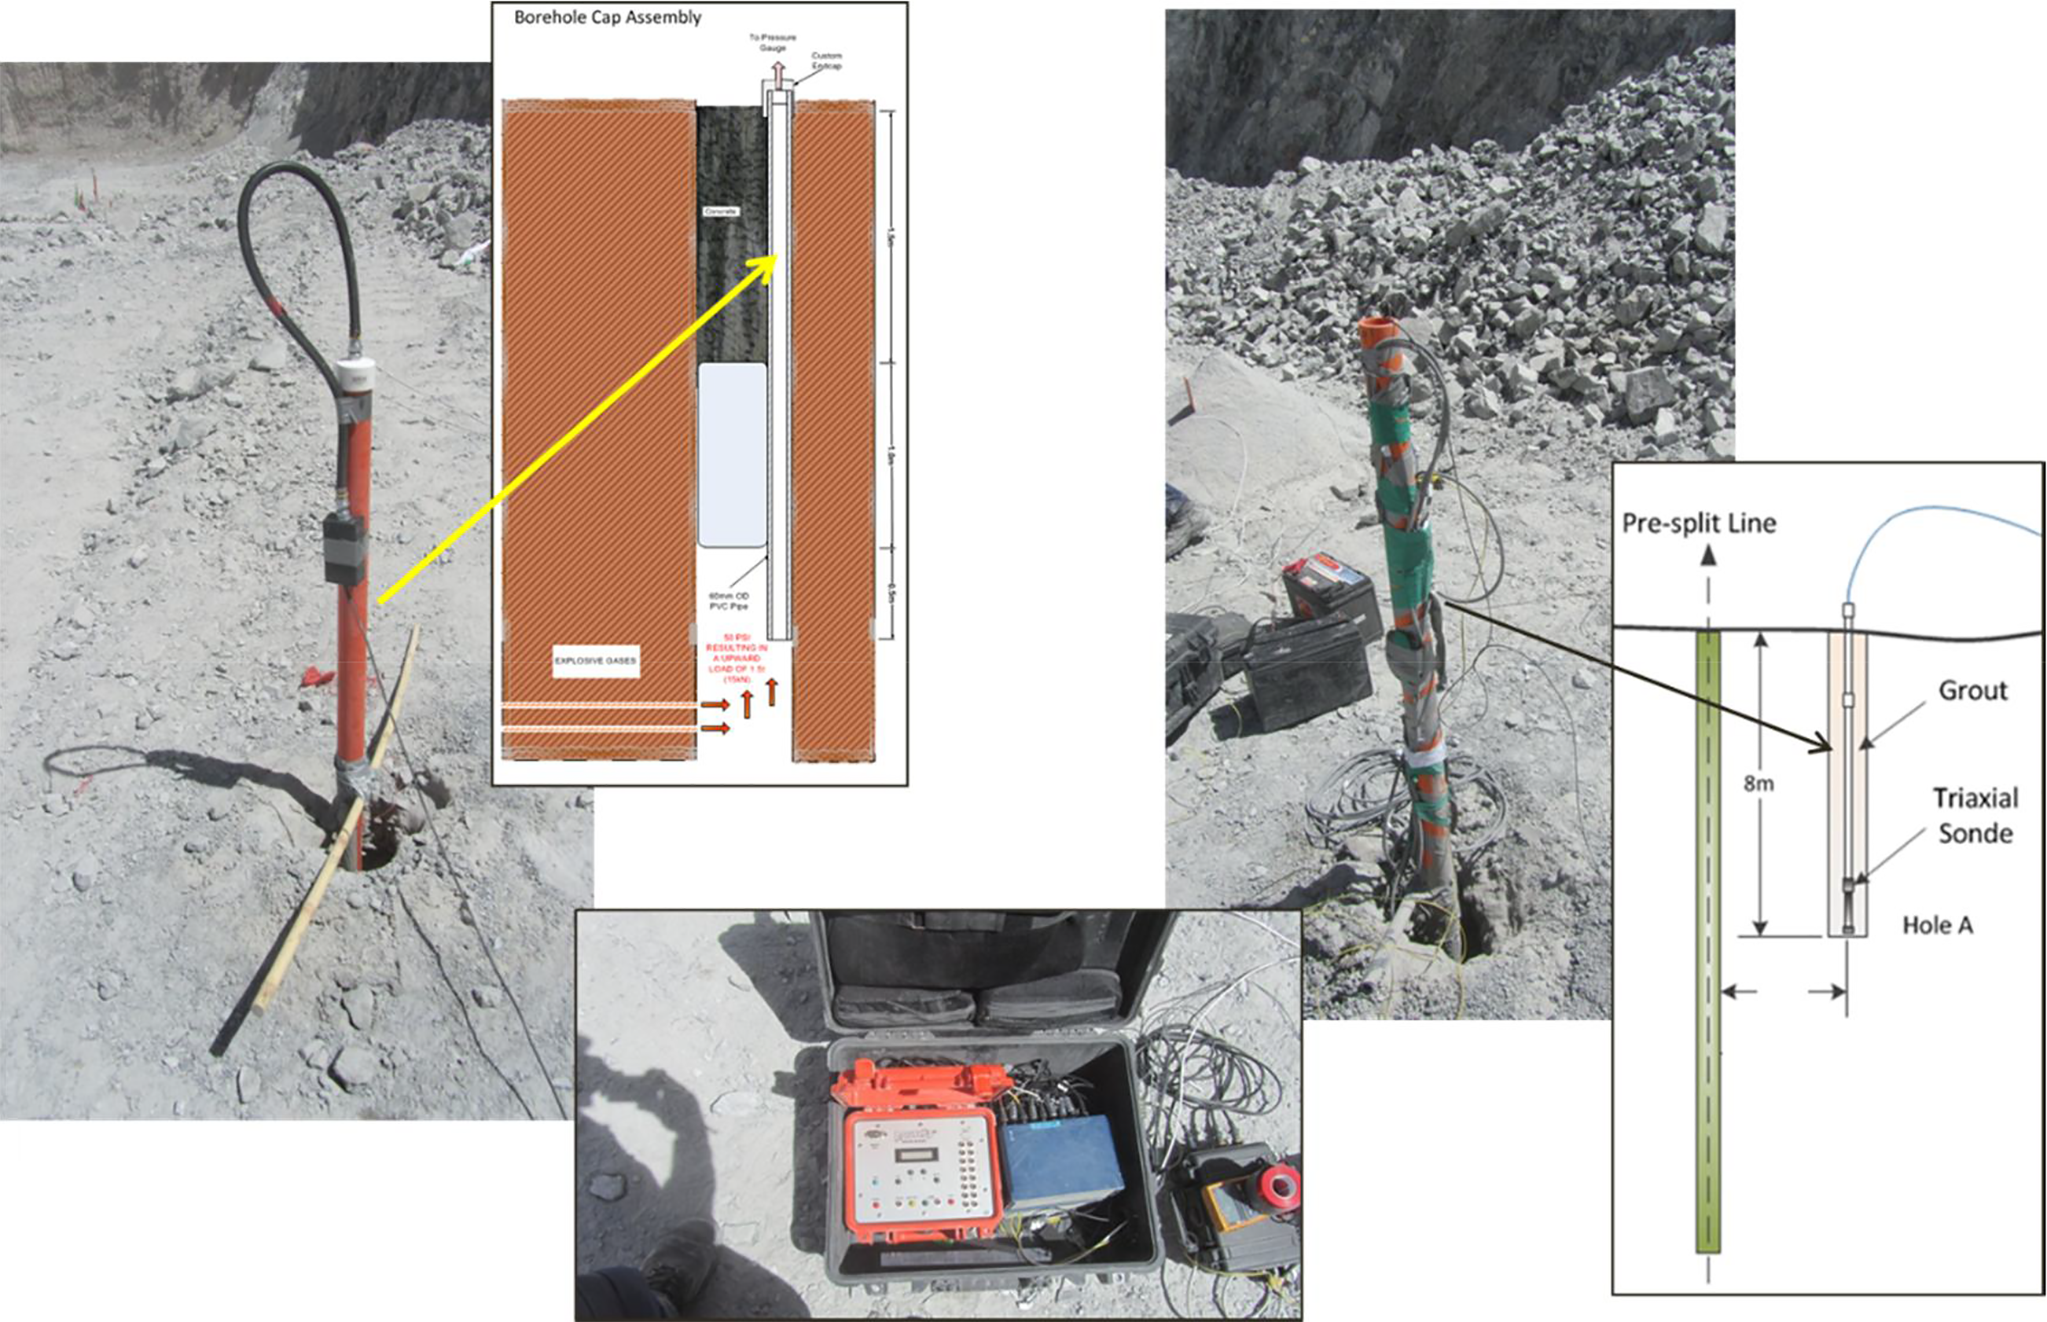
Instrumentation set up at each monitoring station
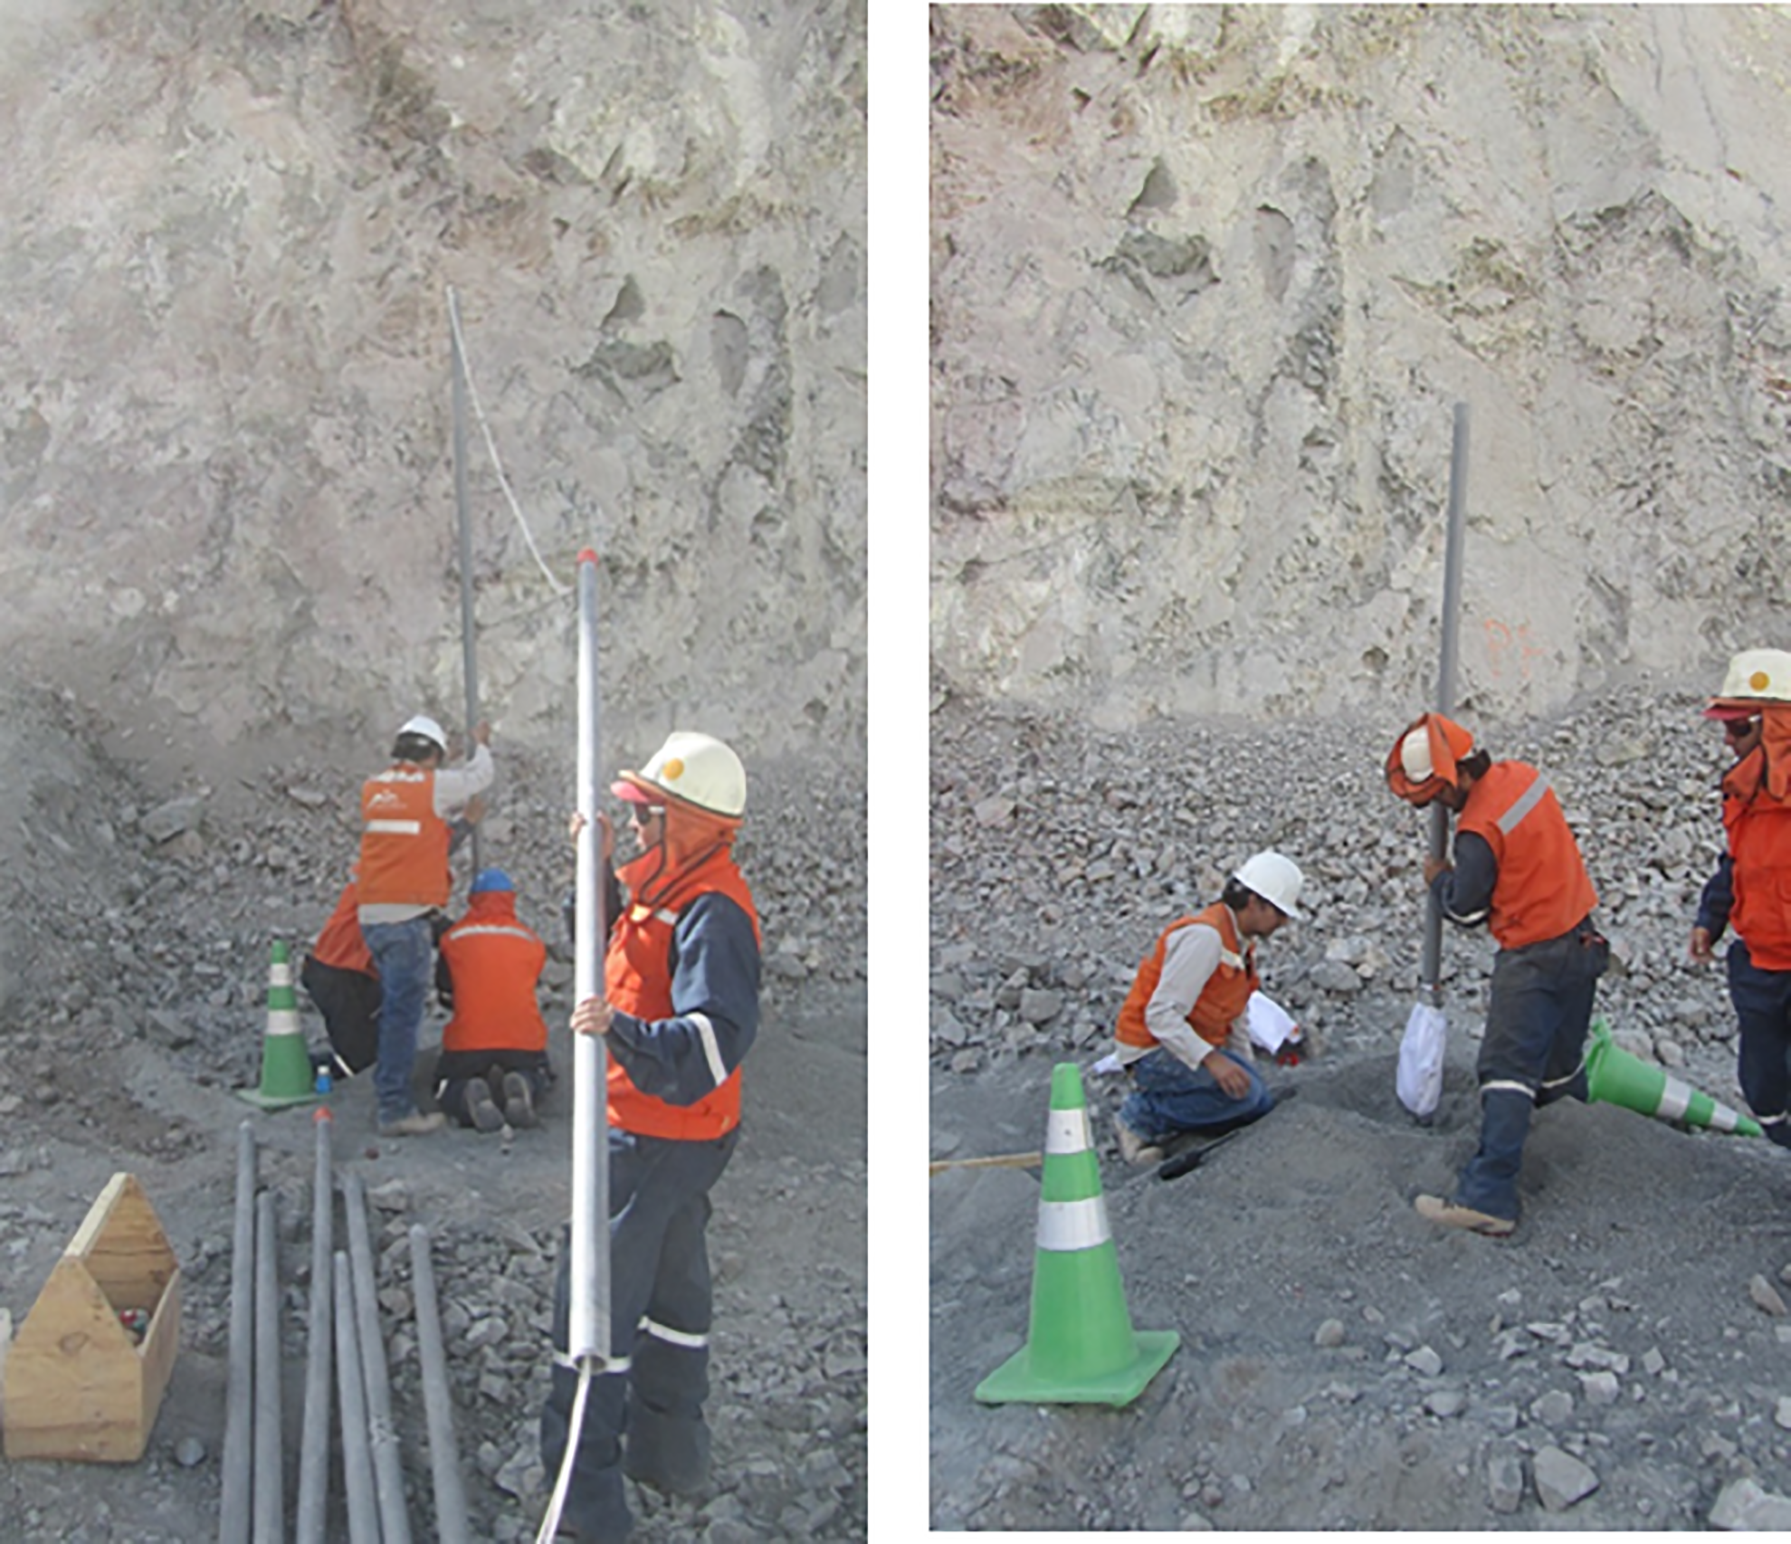
Installation of accelerometers and gas pressure sensors at each monitoring station
Each monitoring station consisted of a triaxial accelerometer and a gas pressure sensor. Triaxial accelerometers were grouted in 165 mm diameter holes at a depth of 8 m (e.g. mid bench). These were 5000 g rated triaxial accelerometers with a frequency response of 1.2–10 000 Hz. Gas pressure stations were drilled to the full height of the bench (i.e. 16 m). Pressure transducers were rated to a maximum pressure of 55 GPa with a frequency response of 2–5000 Hz and a rise time of input pulse of 2 μs. It should be noted that gas pressure transducers could be recycled between blasts given the set up shown in Fig. 5. Signal conditioners were also required and these were connected to an eight-channel MREL DataTrap II data acquisition system MREL (2014).
Data collection and evaluation criteria
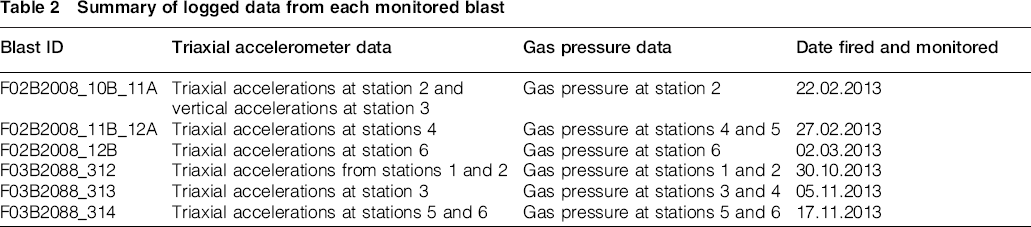
Table 2 gives a summary of the data that was collected during the monitoring trials. The blast ID reported corresponds to the nomenclature used at the mine site. The blast ID is used in this paper to identify monitoring results from each location. Note that this table summarises only those stations from which reliable data were successfully obtained and reported. There were specific cases where not all channels were able to be logged because of cable malfunctions and other field-related problems, which affected the recovery of data.
Summary of logged data from each monitored blast
As discussed earlier, one of the objectives of this blast monitoring campaign was to measure particle acceleration, PPV vector sum and gas pressures behind pre-split lines, with the view to evaluate the effectiveness of pre-splits as a filtering medium of both stresses and explosion gases. It was therefore necessary to establish a simple criterion that would determine whether or not filtering effects were occurring.
The criterion was developed in conjunction with geotechnical department of Centinela Sulphide mine. With regards to near field stress-induced damage, a PPV vector sum threshold was used as an index to identify the likelihood of damage. The incipient damage threshold of intact rock was set at levels equal or greater than 1000 mm s− 1; and the influence on discontinuities was set at half of this value (i.e. 500 mm s− 1). Previous monitoring supported by empirical modelling indicated that without a presplit, both production and buffer charges could induce PPV levels in the range of 975 and 1300 mm s− 1 in the region where the monitoring stations were located (i.e. ∼3 m behind presplit lines). These PPV levels would clearly exceed the established incipient damage thresholds and would therefore indicate damage to the rock mass in this region.
It was recognised on site that given the jointed nature of the rock mass, damage mechanisms due to gas could in fact be more prevalent and hence the need to make direct measurements of gas pressure. The criterion adopted involved a review of both the shape and amplitude of signals. As shown by Ouchterlony (1995) in Fig. 6, pressure measurements may show a distinctive negative pressure immediately followed by a faster positive pressure rise until a peak is reached. Afterwards, the pressure starts to dissipate from the monitoring cavity. As shown in Fig. 6, the distinctive negative pressure is generally associated with the dilation of discontinuities, which in turn can provide a path for the explosion gases to penetrate towards the monitoring station, hence the logging of positive pressure, which will dissipate at a specific rate depending on the characteristics of the rock mass. These mechanisms have been well documented by others including Kanchibotla (1994), Lymbery (2001), Brent and Smith (2000).
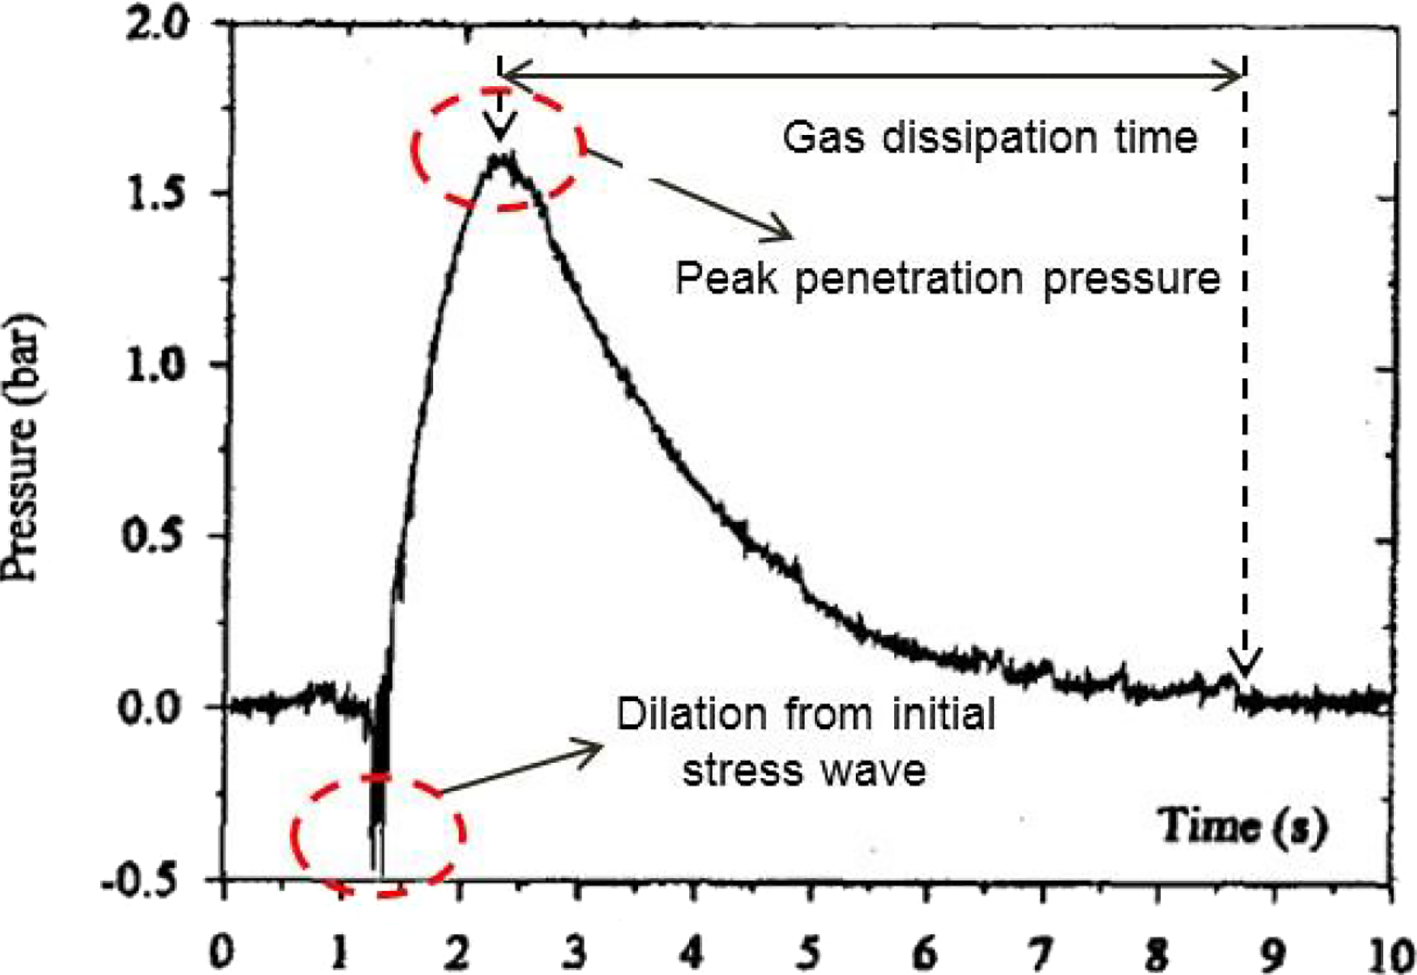
The case of a negative pressure followed by a positive pressure rise indicating dilation of discontinuities, after Ouchterlony (1995)
Highlighted within the red box in Fig. 7 is the case where dilation has not occurred and low level pressure fluctuations are recorded. The signal appears to show random pressure fluctuations that are clearly different from background noise in the signal. In this case, measurements indicate that gases have been filtered or dissipated before reaching the monitoring station. It is important to note that in the case of fluctuating pressures, the amplitude of the pressure experienced at the monitoring stations was also noted and used as an indicator of potential damage. It was assumed that pressures exceeding the static tensile strength of intact rock (i.e. 5 MPa) would cause damage. A shear strength threshold for discontinuities of 0.1 MPa (100 kPa) was also used as a potential damage threshold.
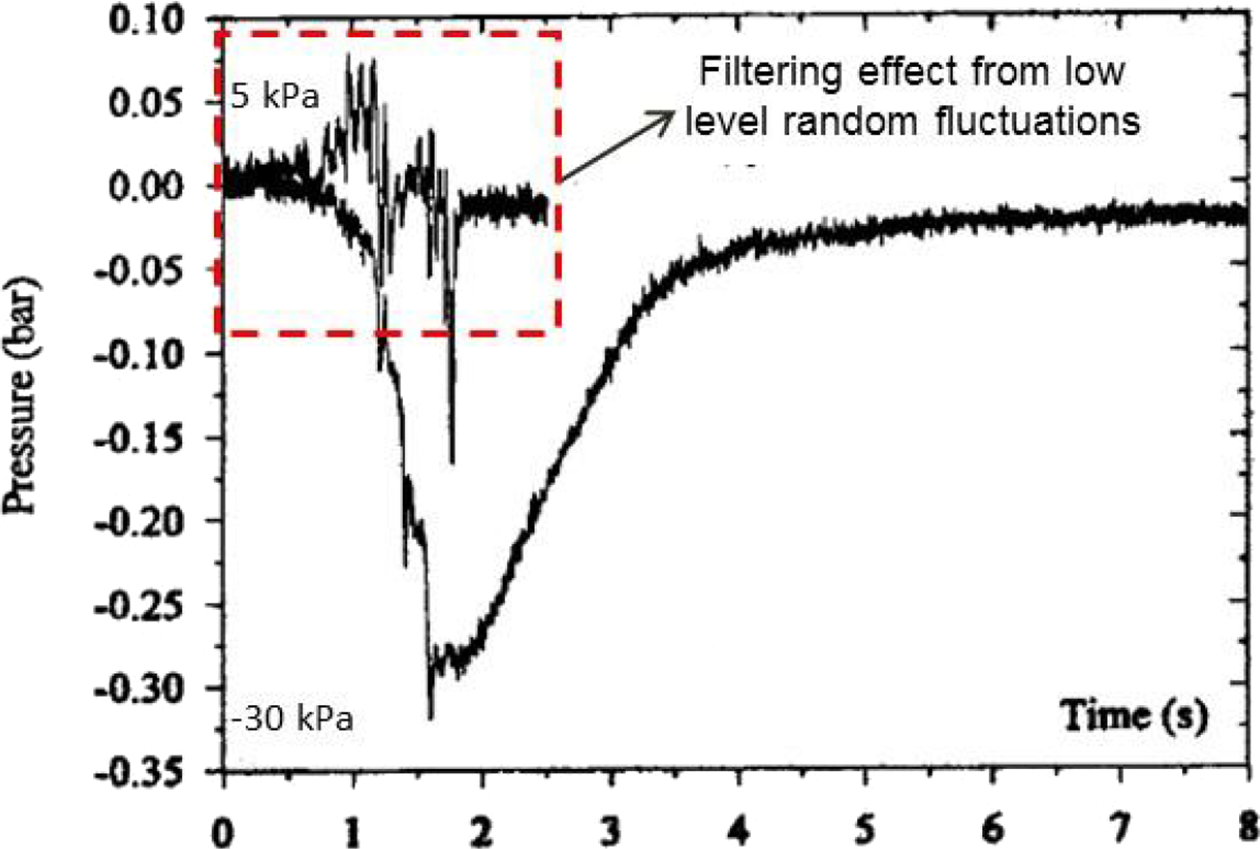
The case of low level pressure fluctuations that indicate filtering of gases before reaching the monitoring point, after Ouchterlony (1995)
In the case of a fully coupled explosive charge, measures of rock mass damage in the form of dilation of discontinuities behind blastholes can be identified by the presence of a negative pressure (Brent and Smith 2000). The work conducted by Brent and Smith (2000) also showed an expected degree of attenuation with distance from the blastholes (see Fig. 8). Note that these measurements were taken behind production blasts having a free face and without the presence of a pre-split. It can be seen from Fig. 8 that within 5 m of the last row of blastholes, negative pressures could range from − 20 to − 80 kPa for blasthole patterns with diameters in the range of 127–270 mm, which included both buffer and standard production rows.
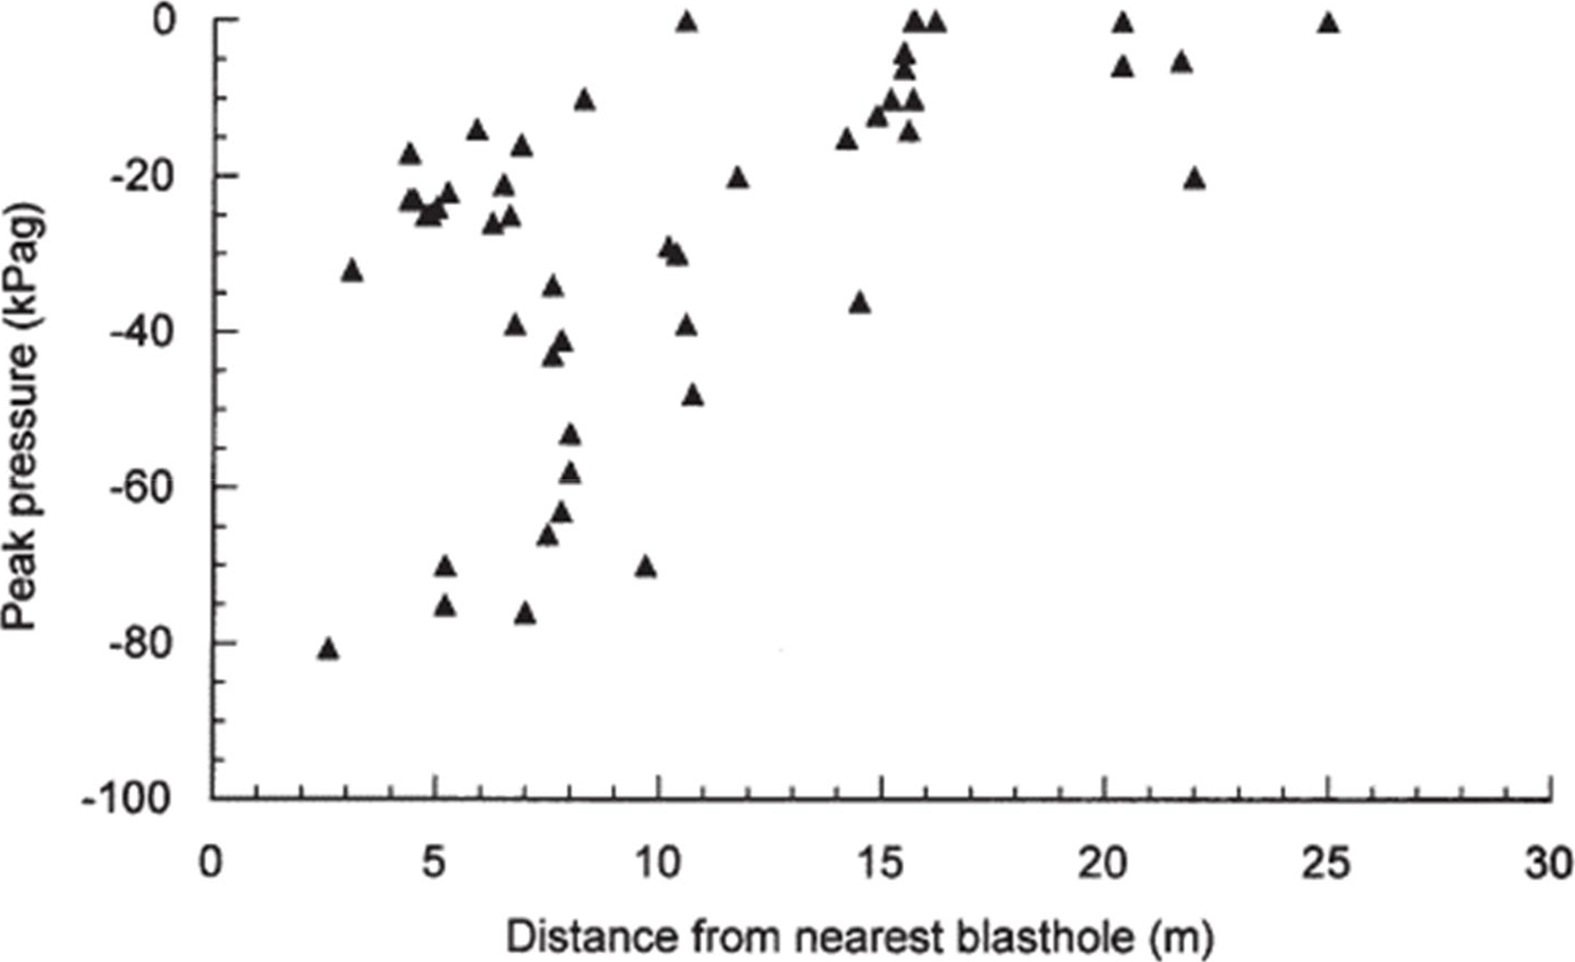
Peak pressure data from monitoring work conducted by Brent and Smith (2000)
Examples of blast monitoring results at Esperanza mine
This section discusses two examples showing typical acceleration and particle velocity records as well as gas pressure measurements obtained during the blast monitoring campaign.
Accelerations and particle velocities
The first example corresponds to blast F02B2008_10B_11. Radial, transverse and vertical accelerations recorded at station 2 of this blast are shown in Fig. 9. The integrated acceleration signal showing particle velocity traces from these three components is given in Fig. 10. Vector sum peak particle velocities with respect to the firing sequence for the complete blast are given in Fig. 11.
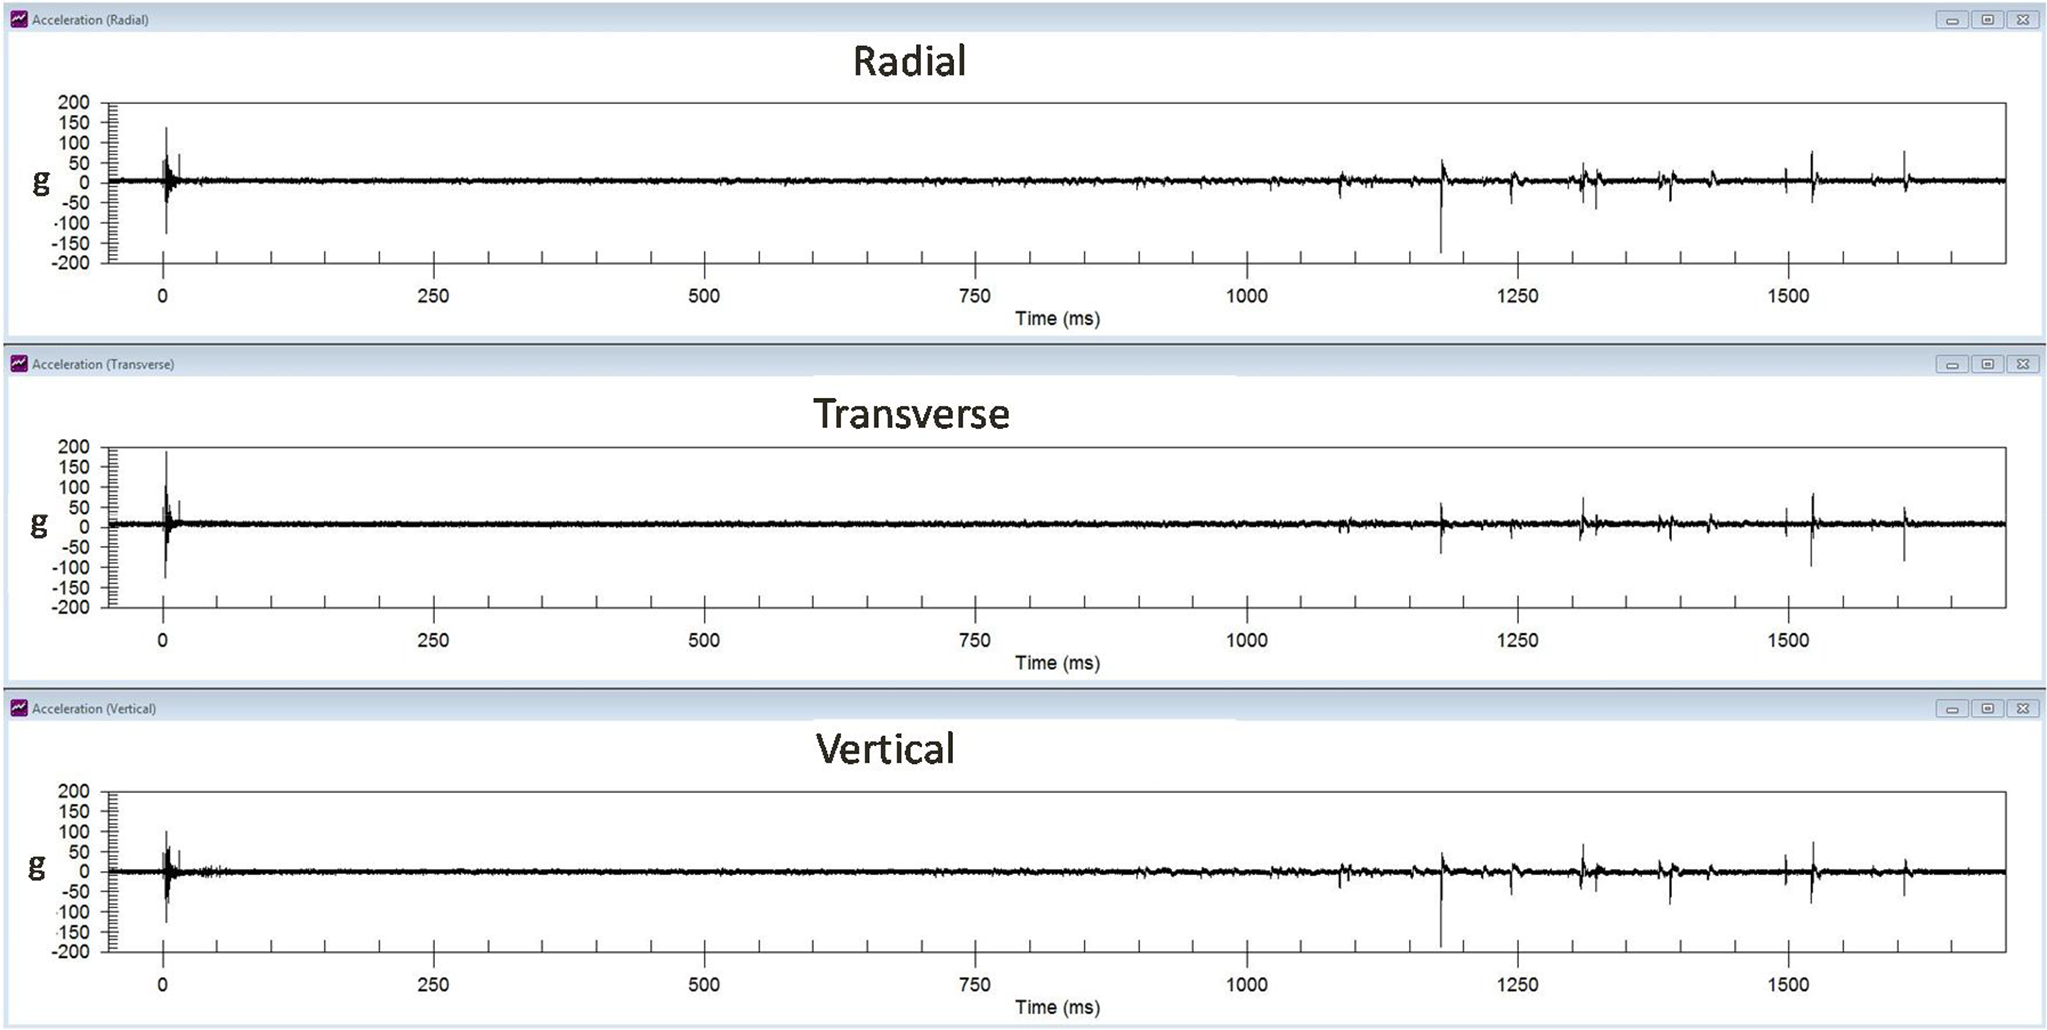
Acceleration records of blast T_F02B2008_10B_11
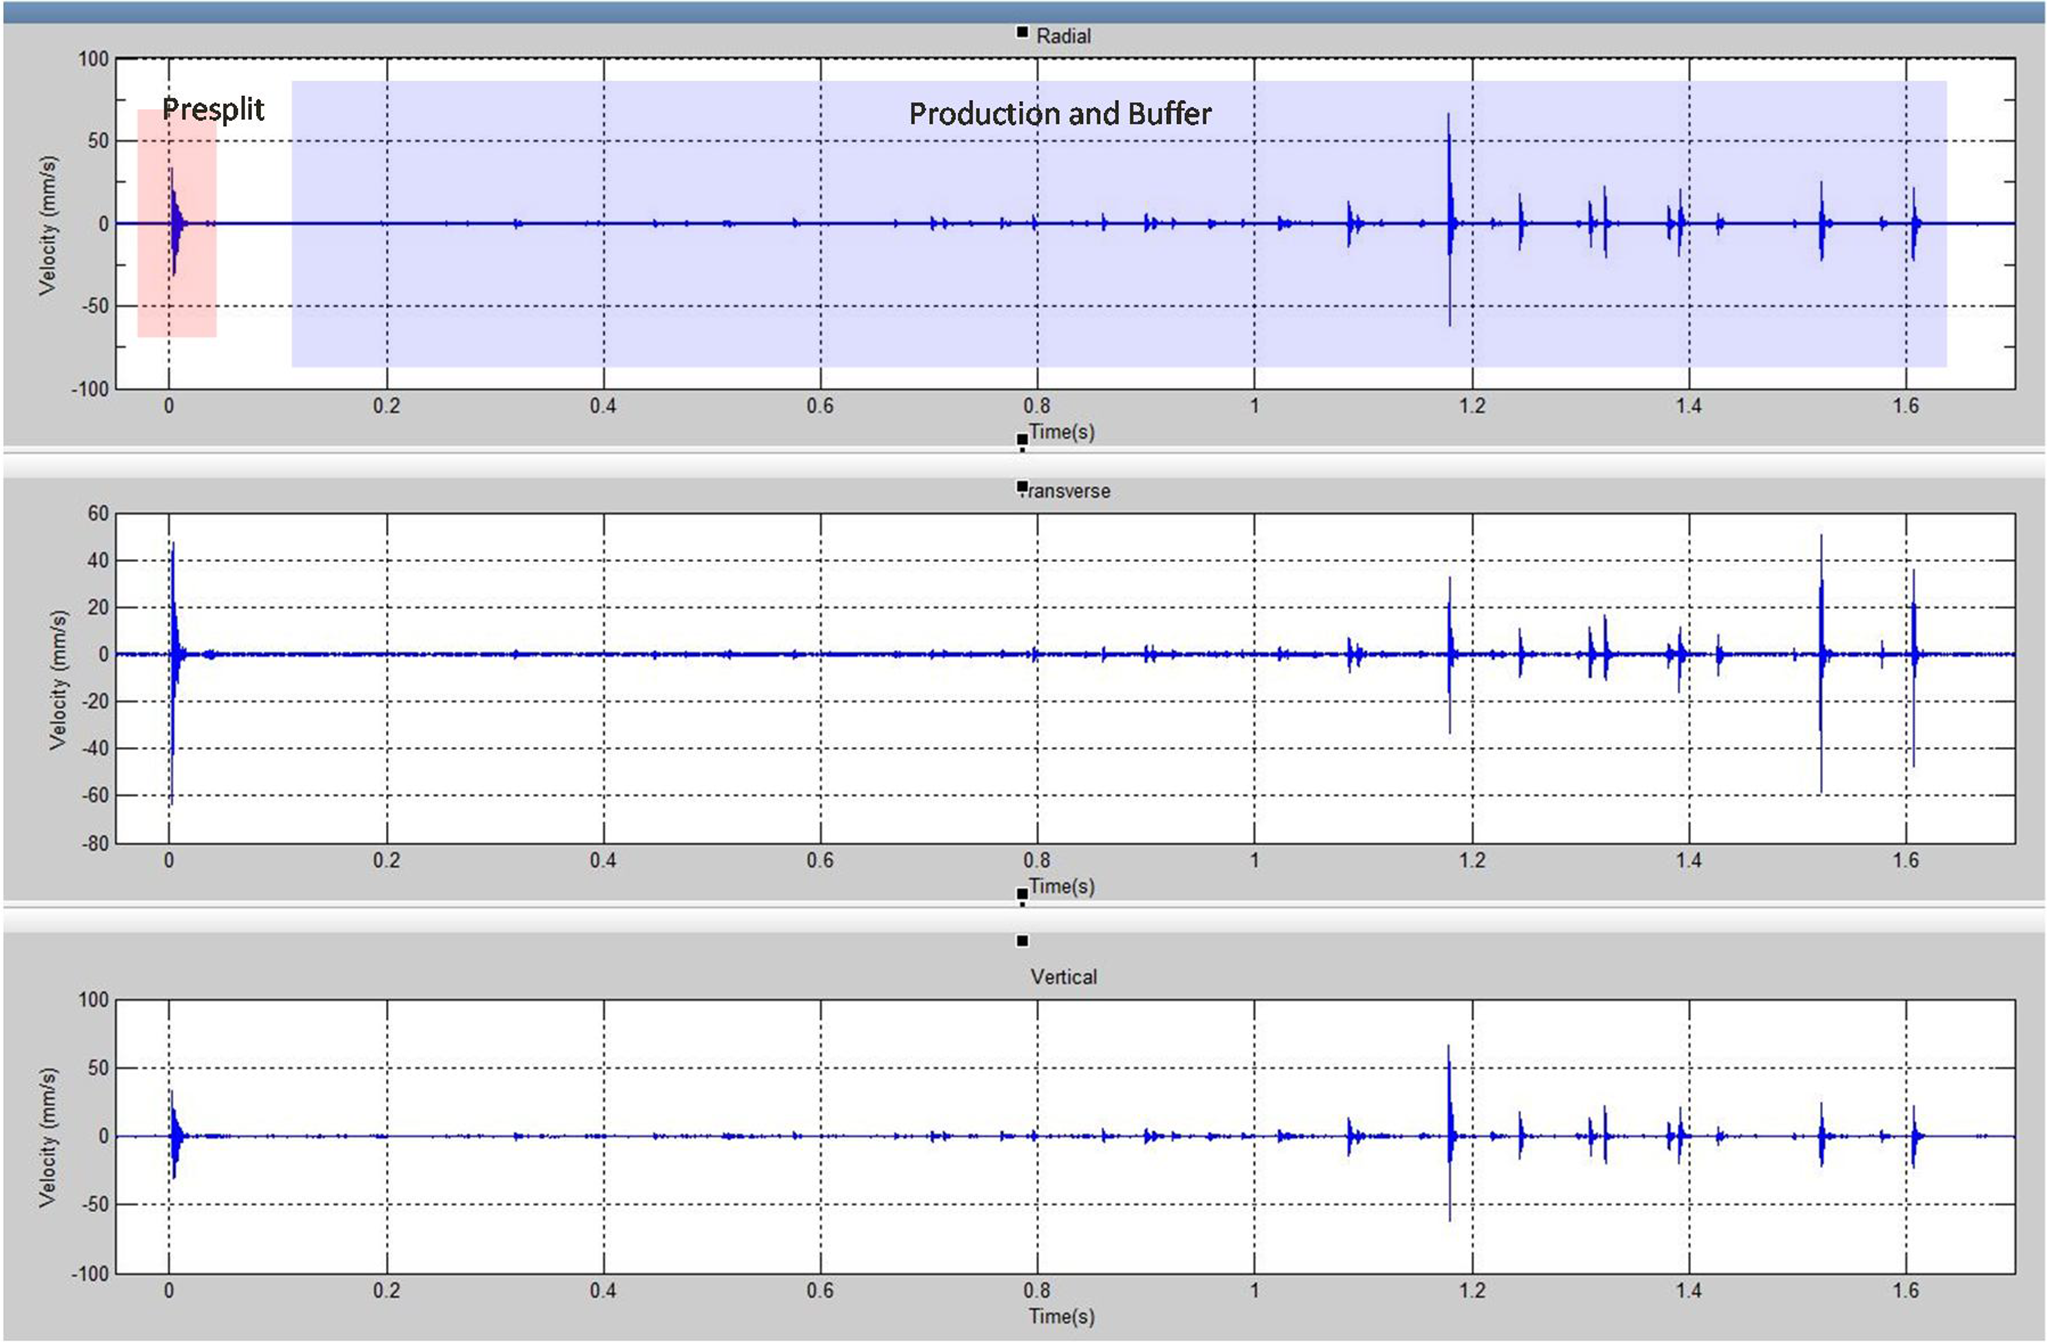
Velocity records of blast TF02B2008_10B_11A
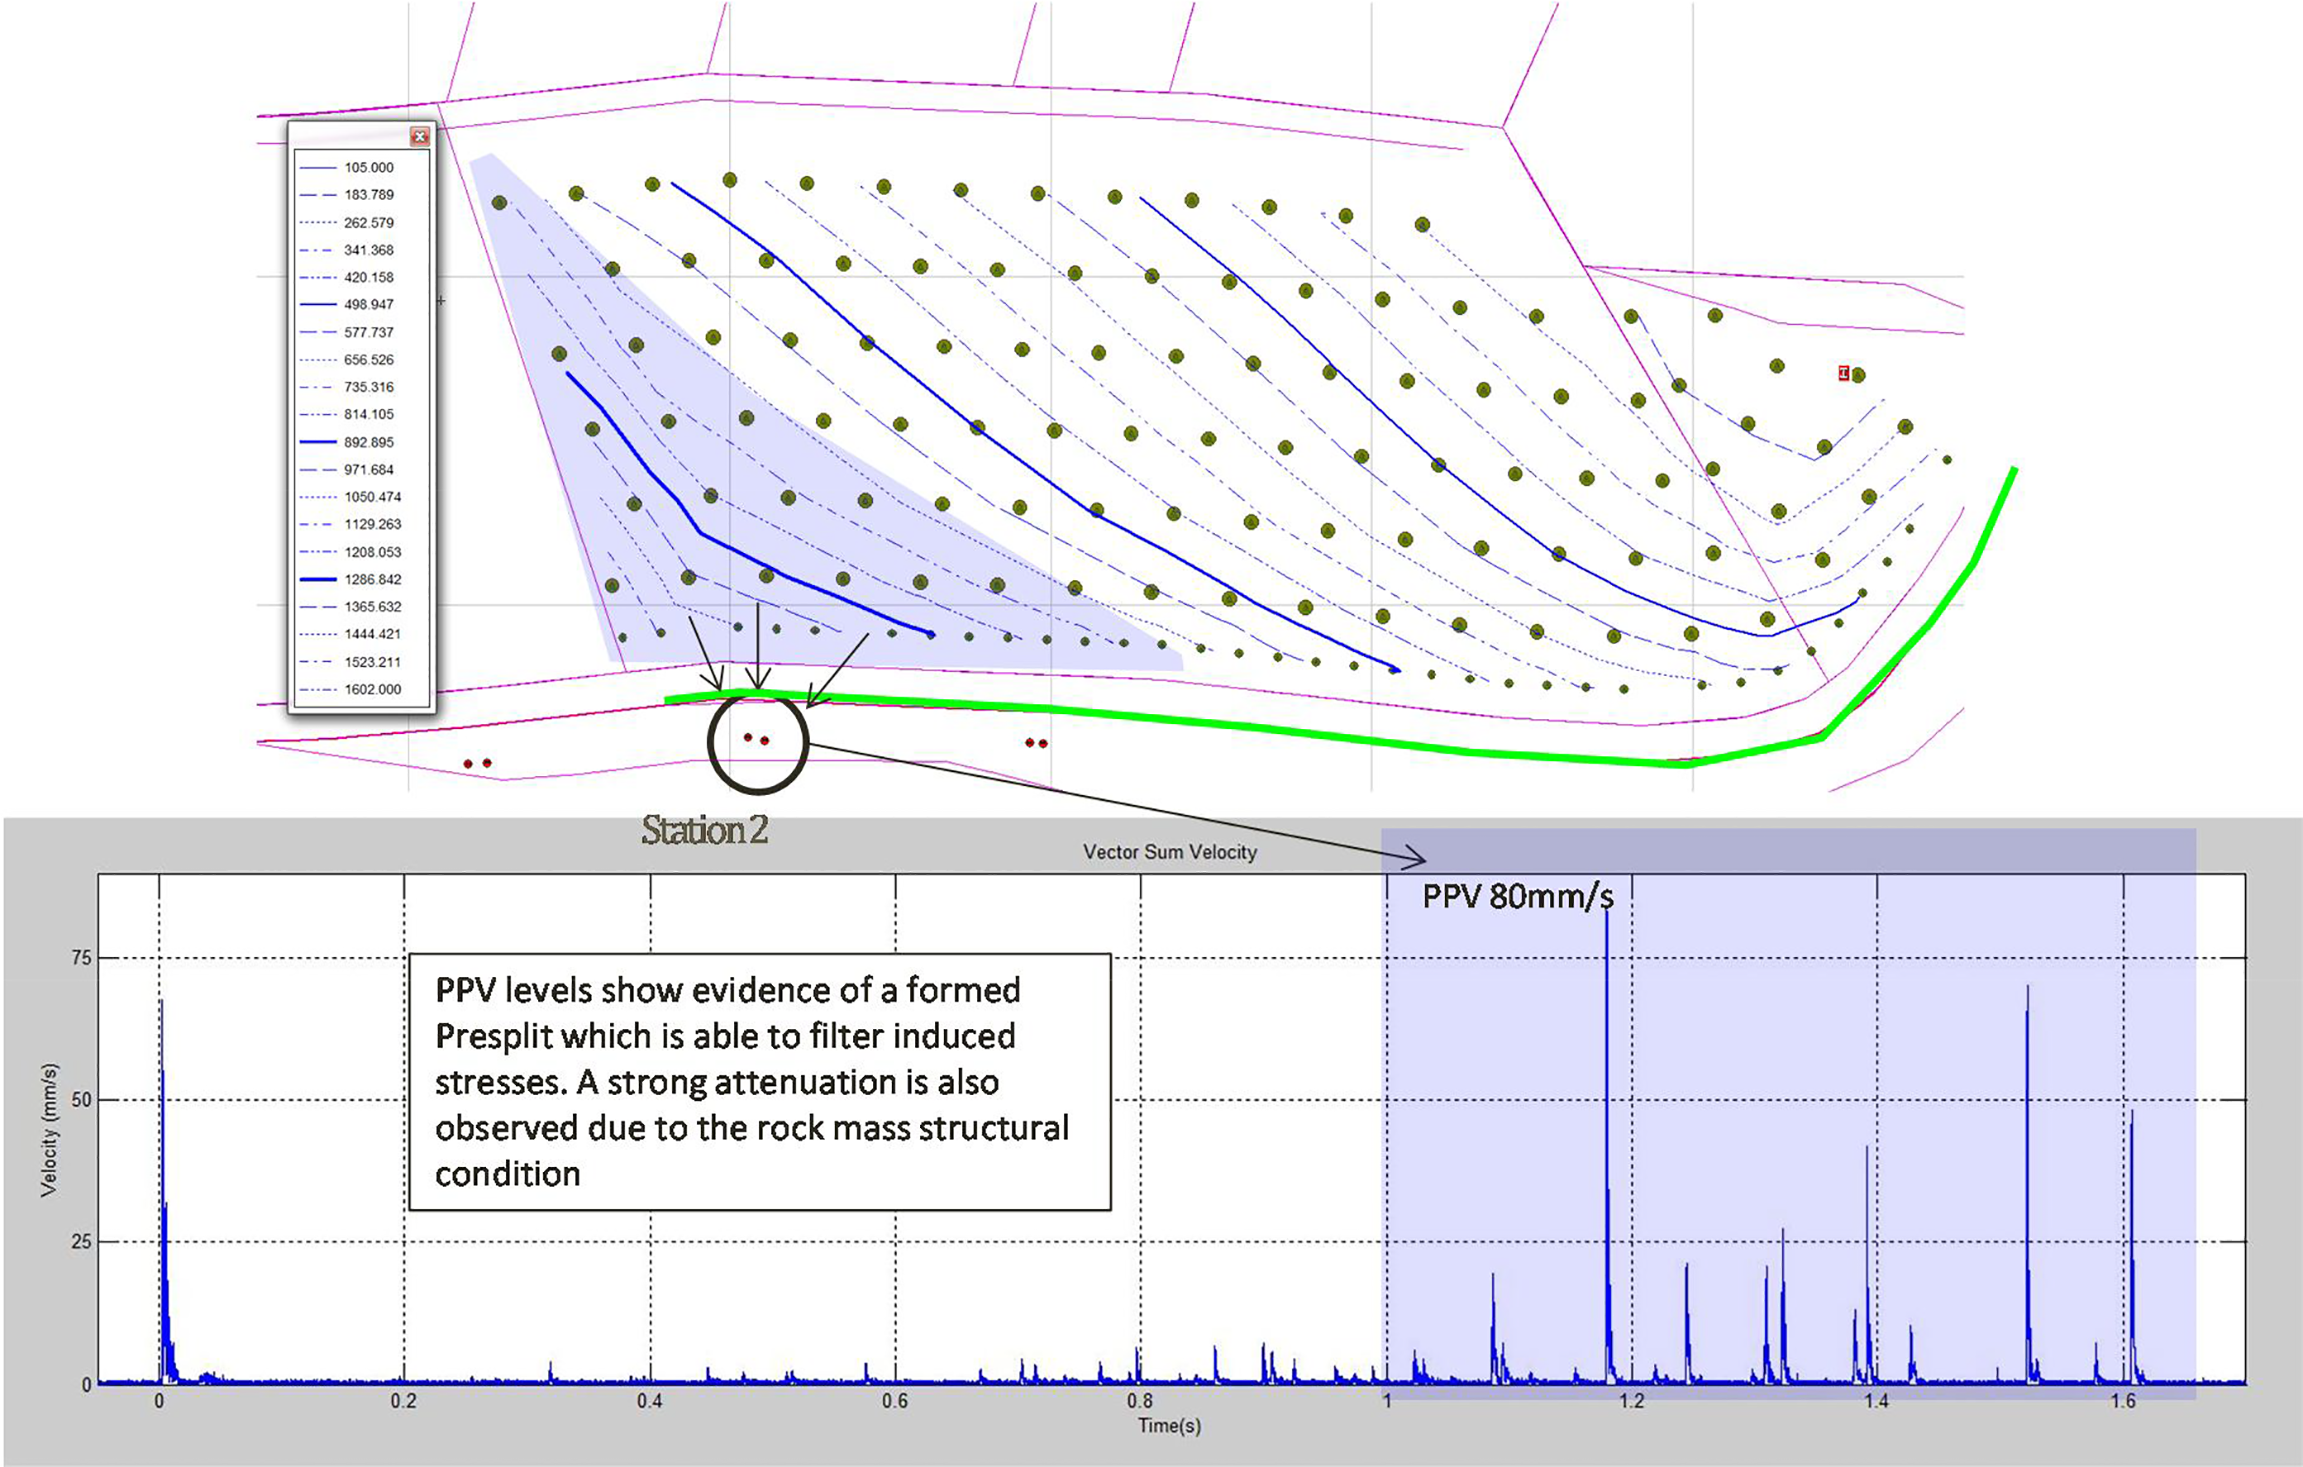
Peak particle velocity (PPV) vector sum of blast T_F02B2008_10B_11A
The vector sum trace can be taken as the signature of what the monitoring point is experiencing as the blast is progressing. One interesting characteristics of the records obtained from this monitoring station is related to its proximity to the pre-split blast, which was fired ahead of the production blast being monitored (see Fig. 1). The effect of the pre-split was clearly recorded at this station, and that was expected given its proximity to this station. The amplitude of the PPV vector sum from this section of the pre-split was measured at 70 mm s− 1 at a distance of approximately 3.8 m. This was consistent with the expected PPV from a decoupled charged in a jointed rock mass.
From the production blast, amplitudes varied as a function of the firing sequence and distance to the monitoring station. As shown in Fig. 11, the maximum PPV vector sum for sections of the blast closest to the monitoring station was approximately 80 mm s− 1. From these measured PPV levels, it was concluded that filtering effects had to be associated with the pre-split fired earlier and in front of the monitoring station.
The second example corresponds to blast F03B2088_312. In this case, acceleration and velocity records for all components were obtained from two monitoring stations located at the centre of the blast (also refer to Fig. 4). Vector sum PPV as a function of the blasting sequence at stations 2 and 1 is shown in Figs. 12 and 13, respectively. Given by the initiation point and blasting sequence, records from station 2 are purposely shown first.
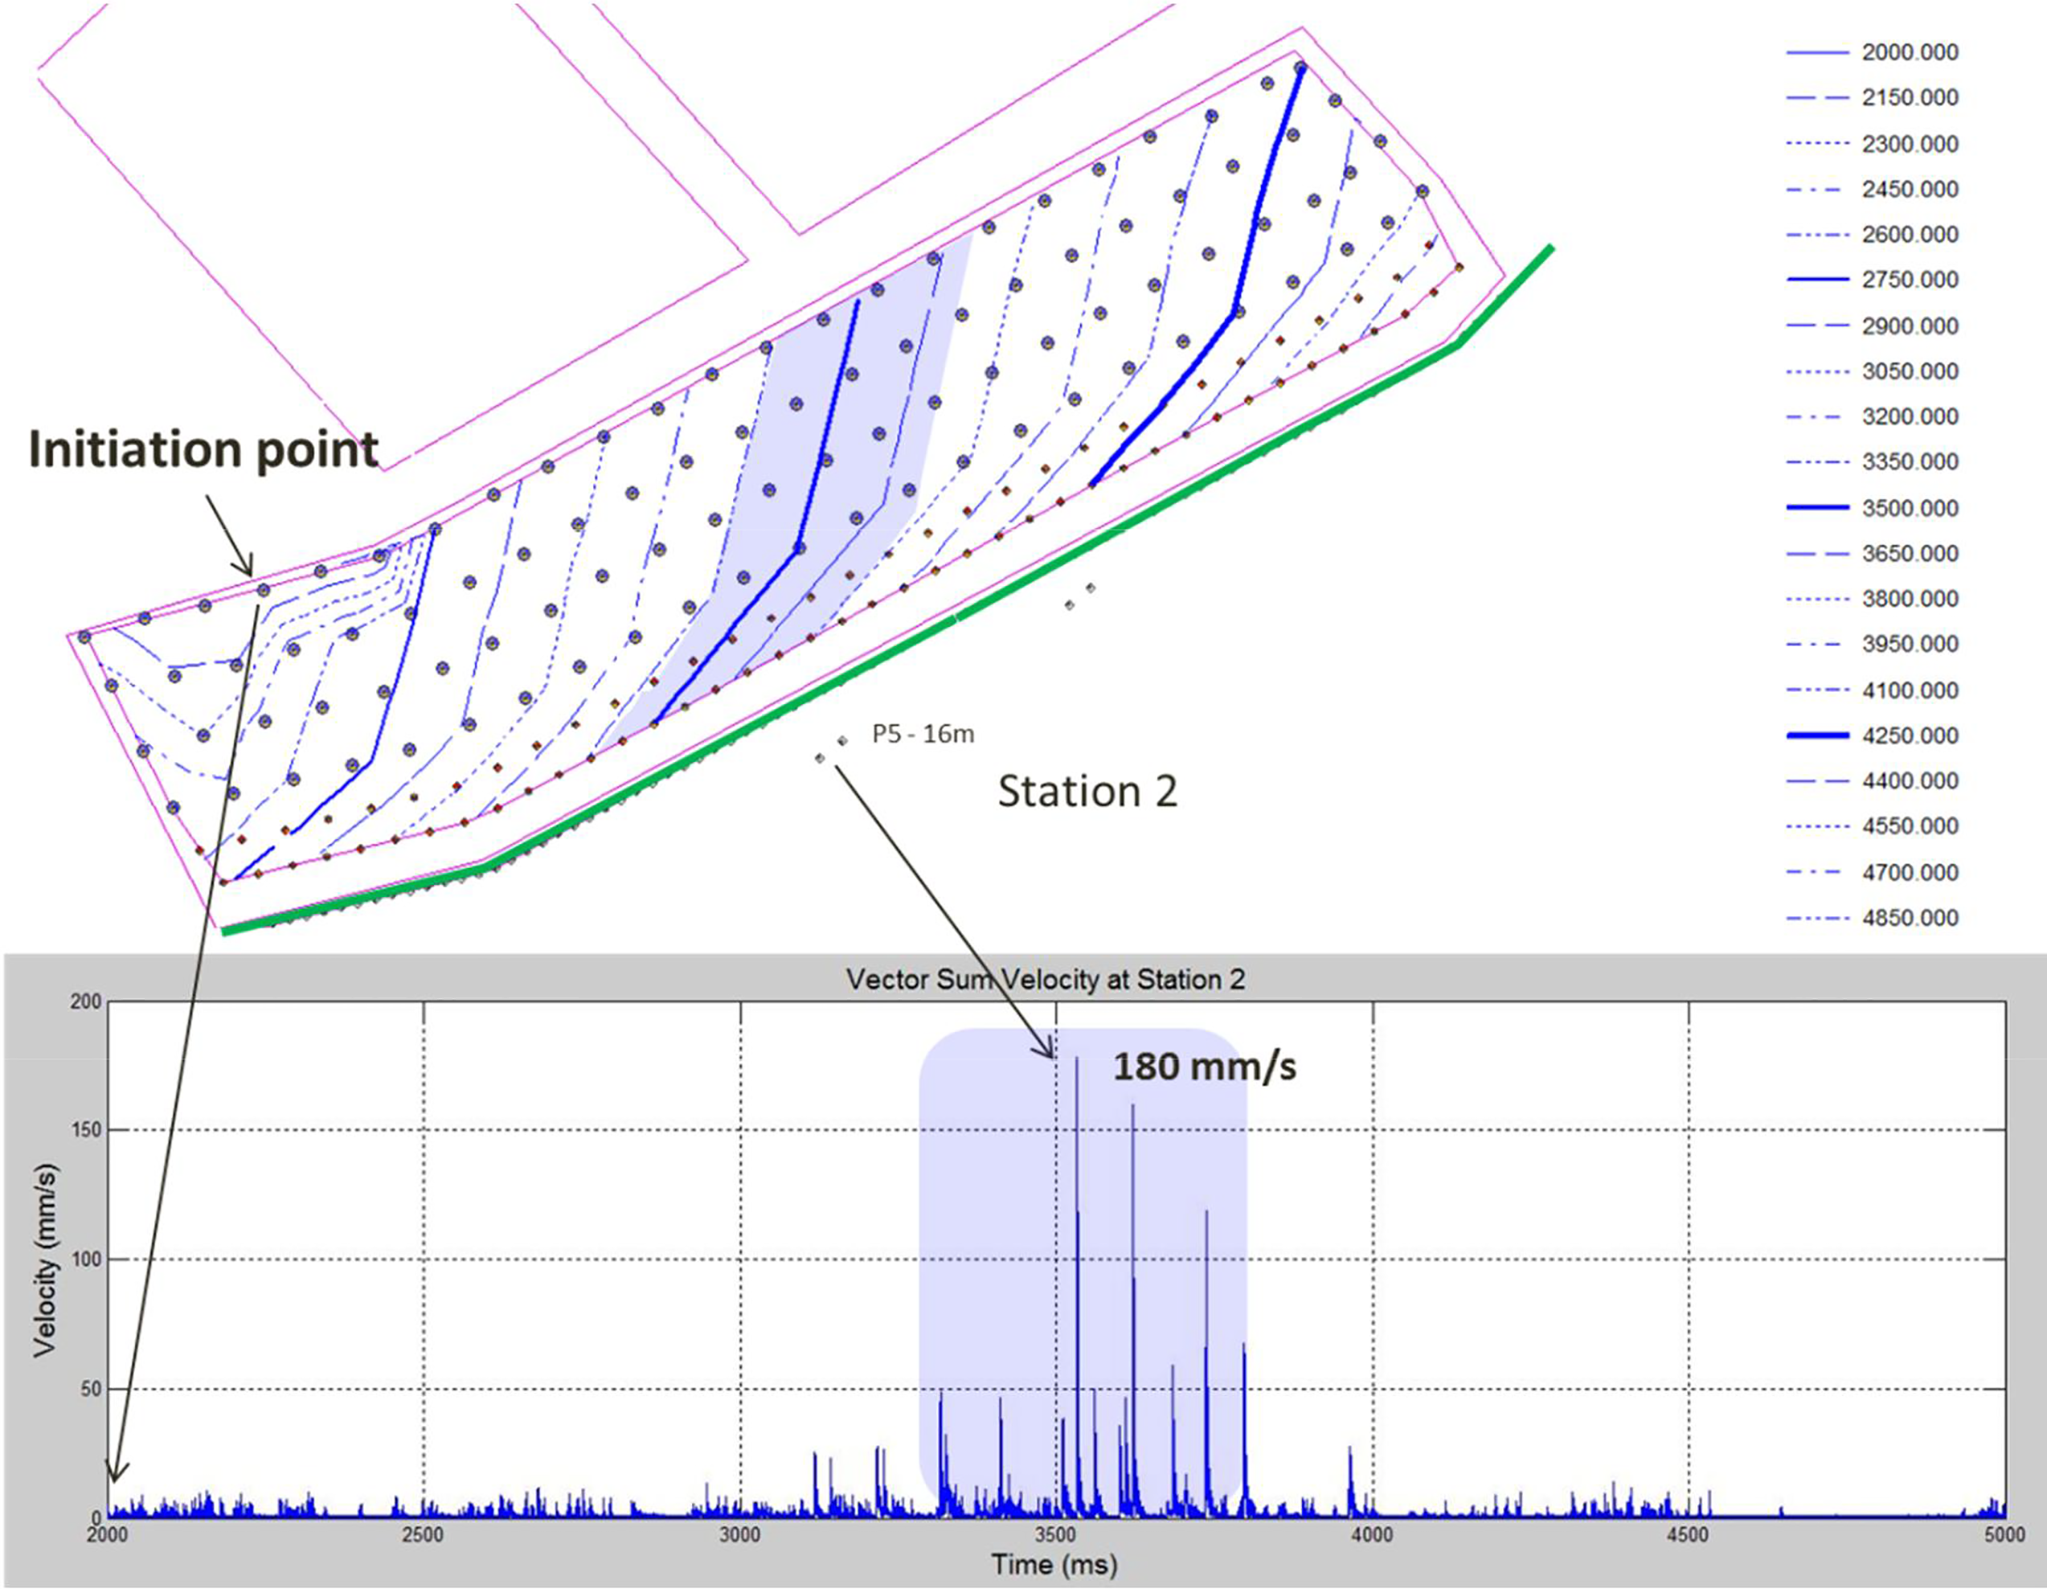
Peak particle velocity (PPV) vector sum of blast T_F03B2088_312 at station 2
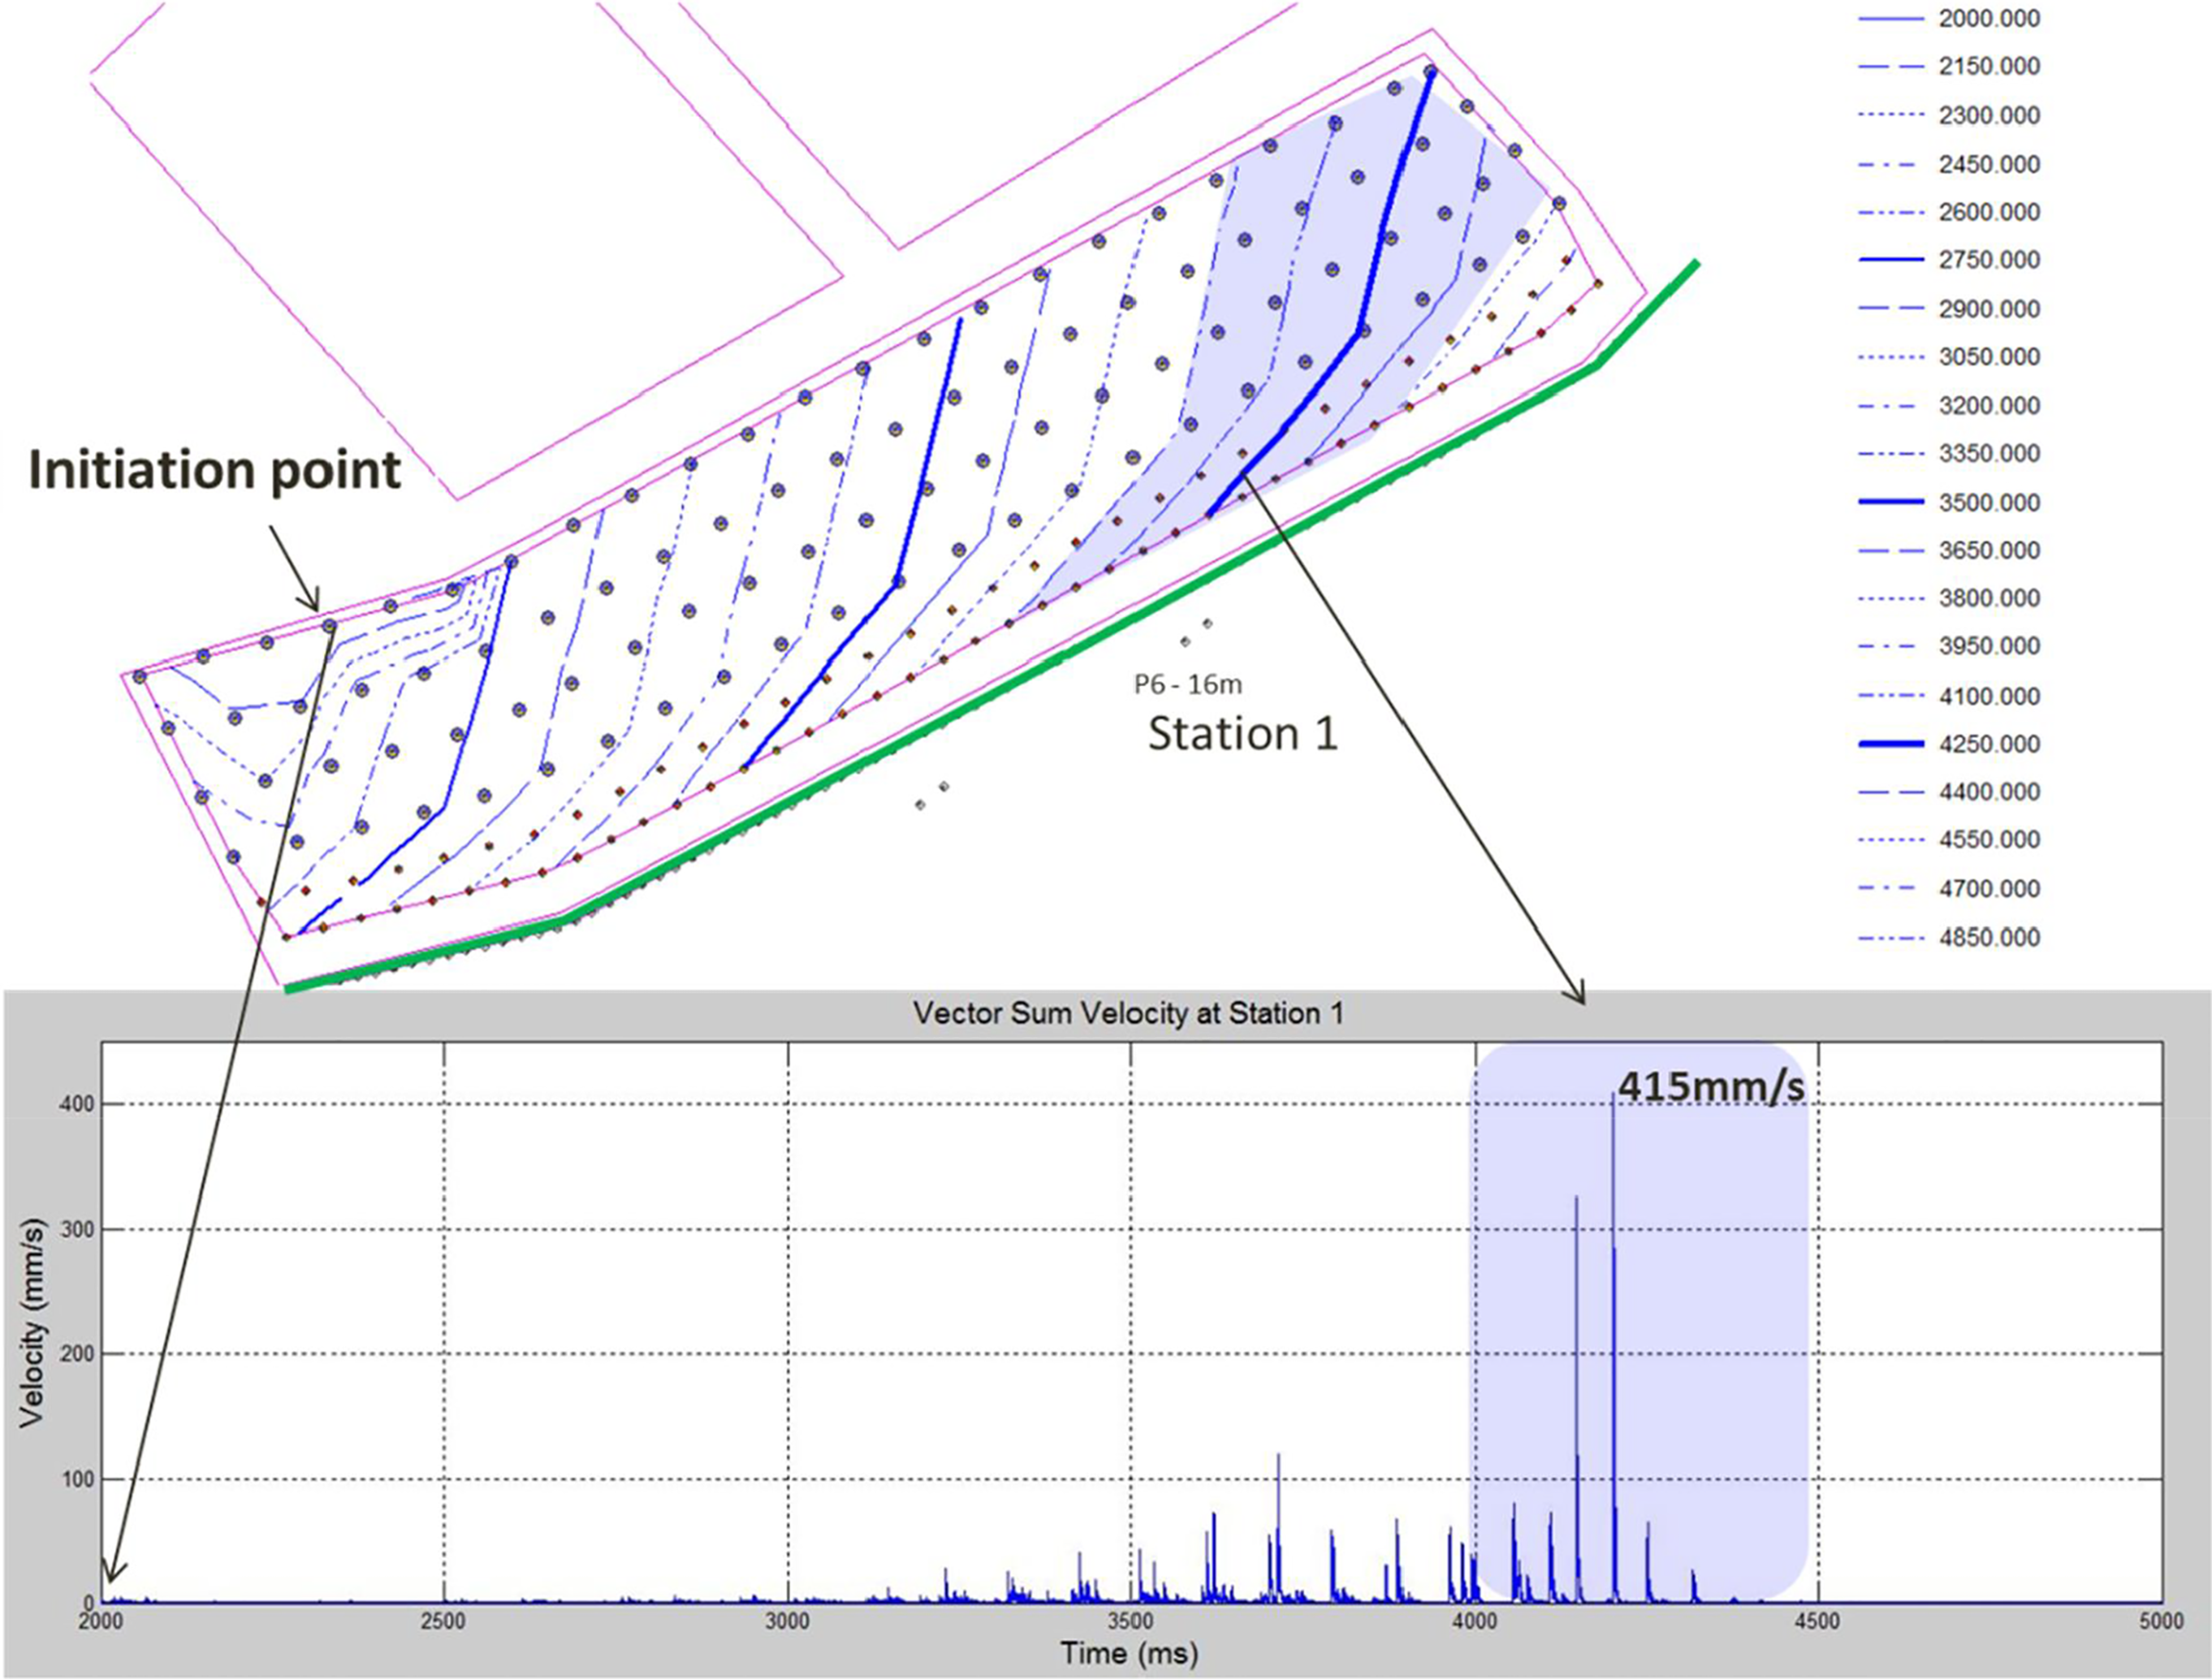
Peak particle velocity (PPV) vector sum of blast T_F03B2088_312 at station 1
As shown, maximum PPV values of 180 and 415 mm s− 1 were recorded from this blast at stations 2 and 1, respectively. In this case, it is important to note the difference in the amplitudes measured. The 415 mm s− 1 amplitude level was admittedly higher than expected, but nevertheless consistent with the possibility of confinement effects as blasting progressed towards this monitoring point. It was also concluded that the pre-split fired earlier was filtering blast-induced stresses with the likelihood of some sections not completely formed. However, both cases did not exceed the damage thresholds established as part of the evaluation criterion.
Measurements of gas pressure
The first example of a gas pressure record is shown in Fig. 14 for blast F02B2008_10B_11 at station 2. As with acceleration measurements, the recorded trace shows the influence of both the pre-split fired at close proximity; and the production blast that followed (also refer to Fig. 1). The influence of the pre-split blast is described in more detail in Fig. 15. Here it is evident that dilation of discontinuities and gas penetration may occur behind a pre-split. However, gas pressures measured approximately 3.8 m from the start of this pre-split are relatively low. The influence of the production blast is also captured and this shows low level pressure fluctuations that support the view of a filtering effect occurring in front of the monitoring station.
Gas pressure records of blast T_F02B2008_10B_11A
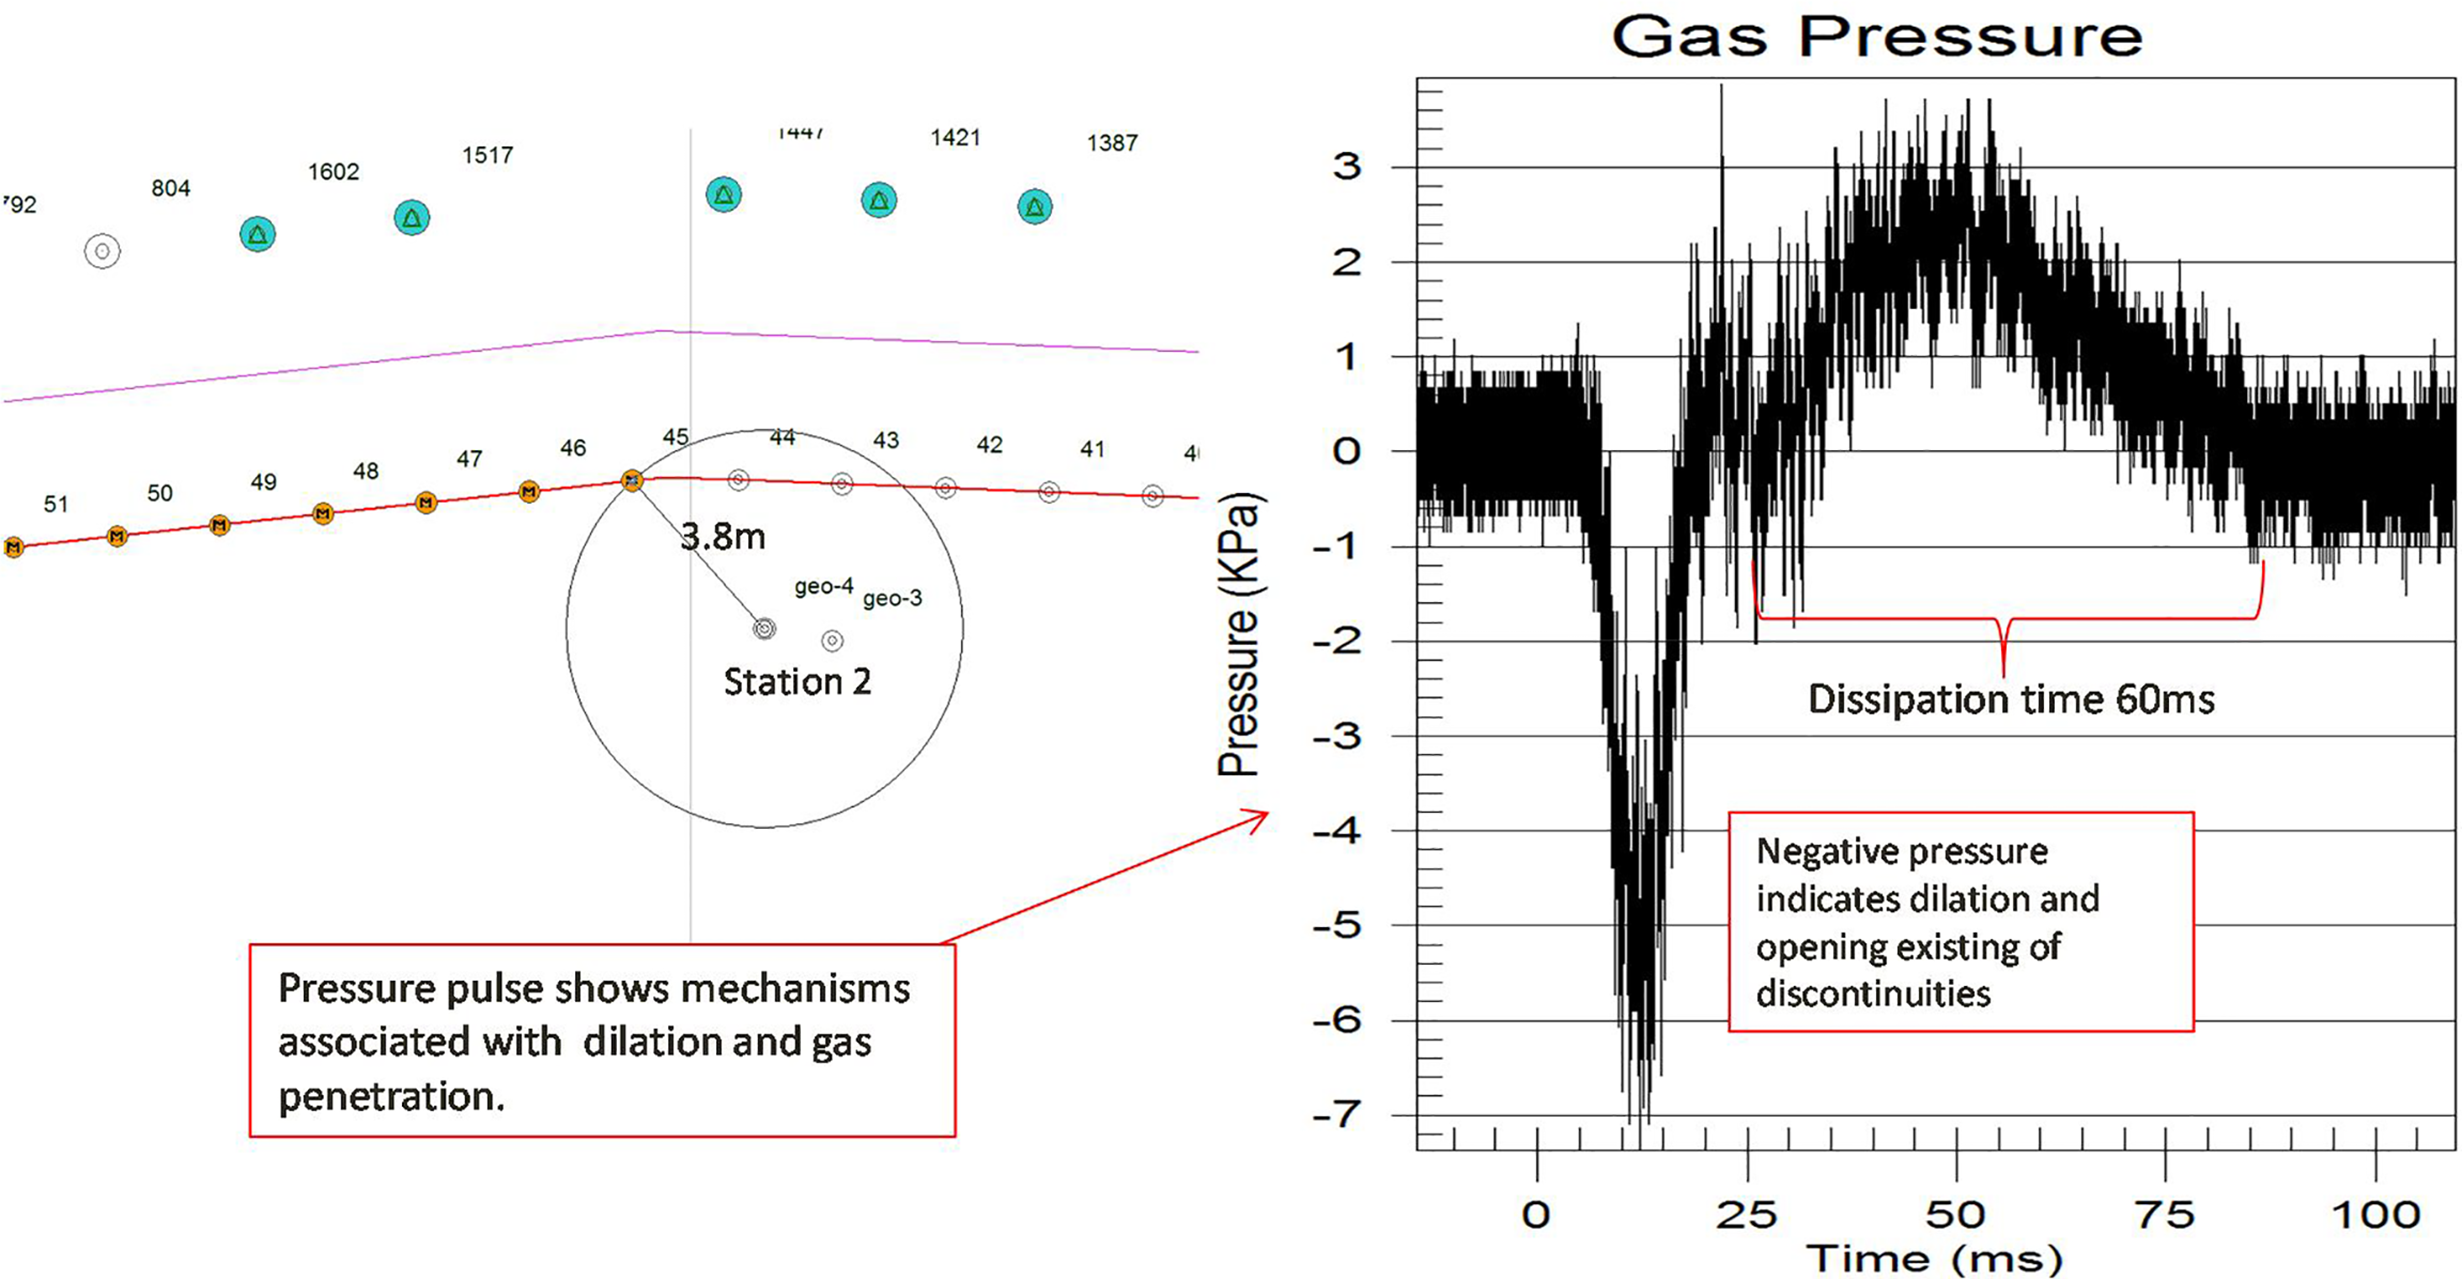
Gas pressure from the initial pre-split section fired at close proximity to station 2
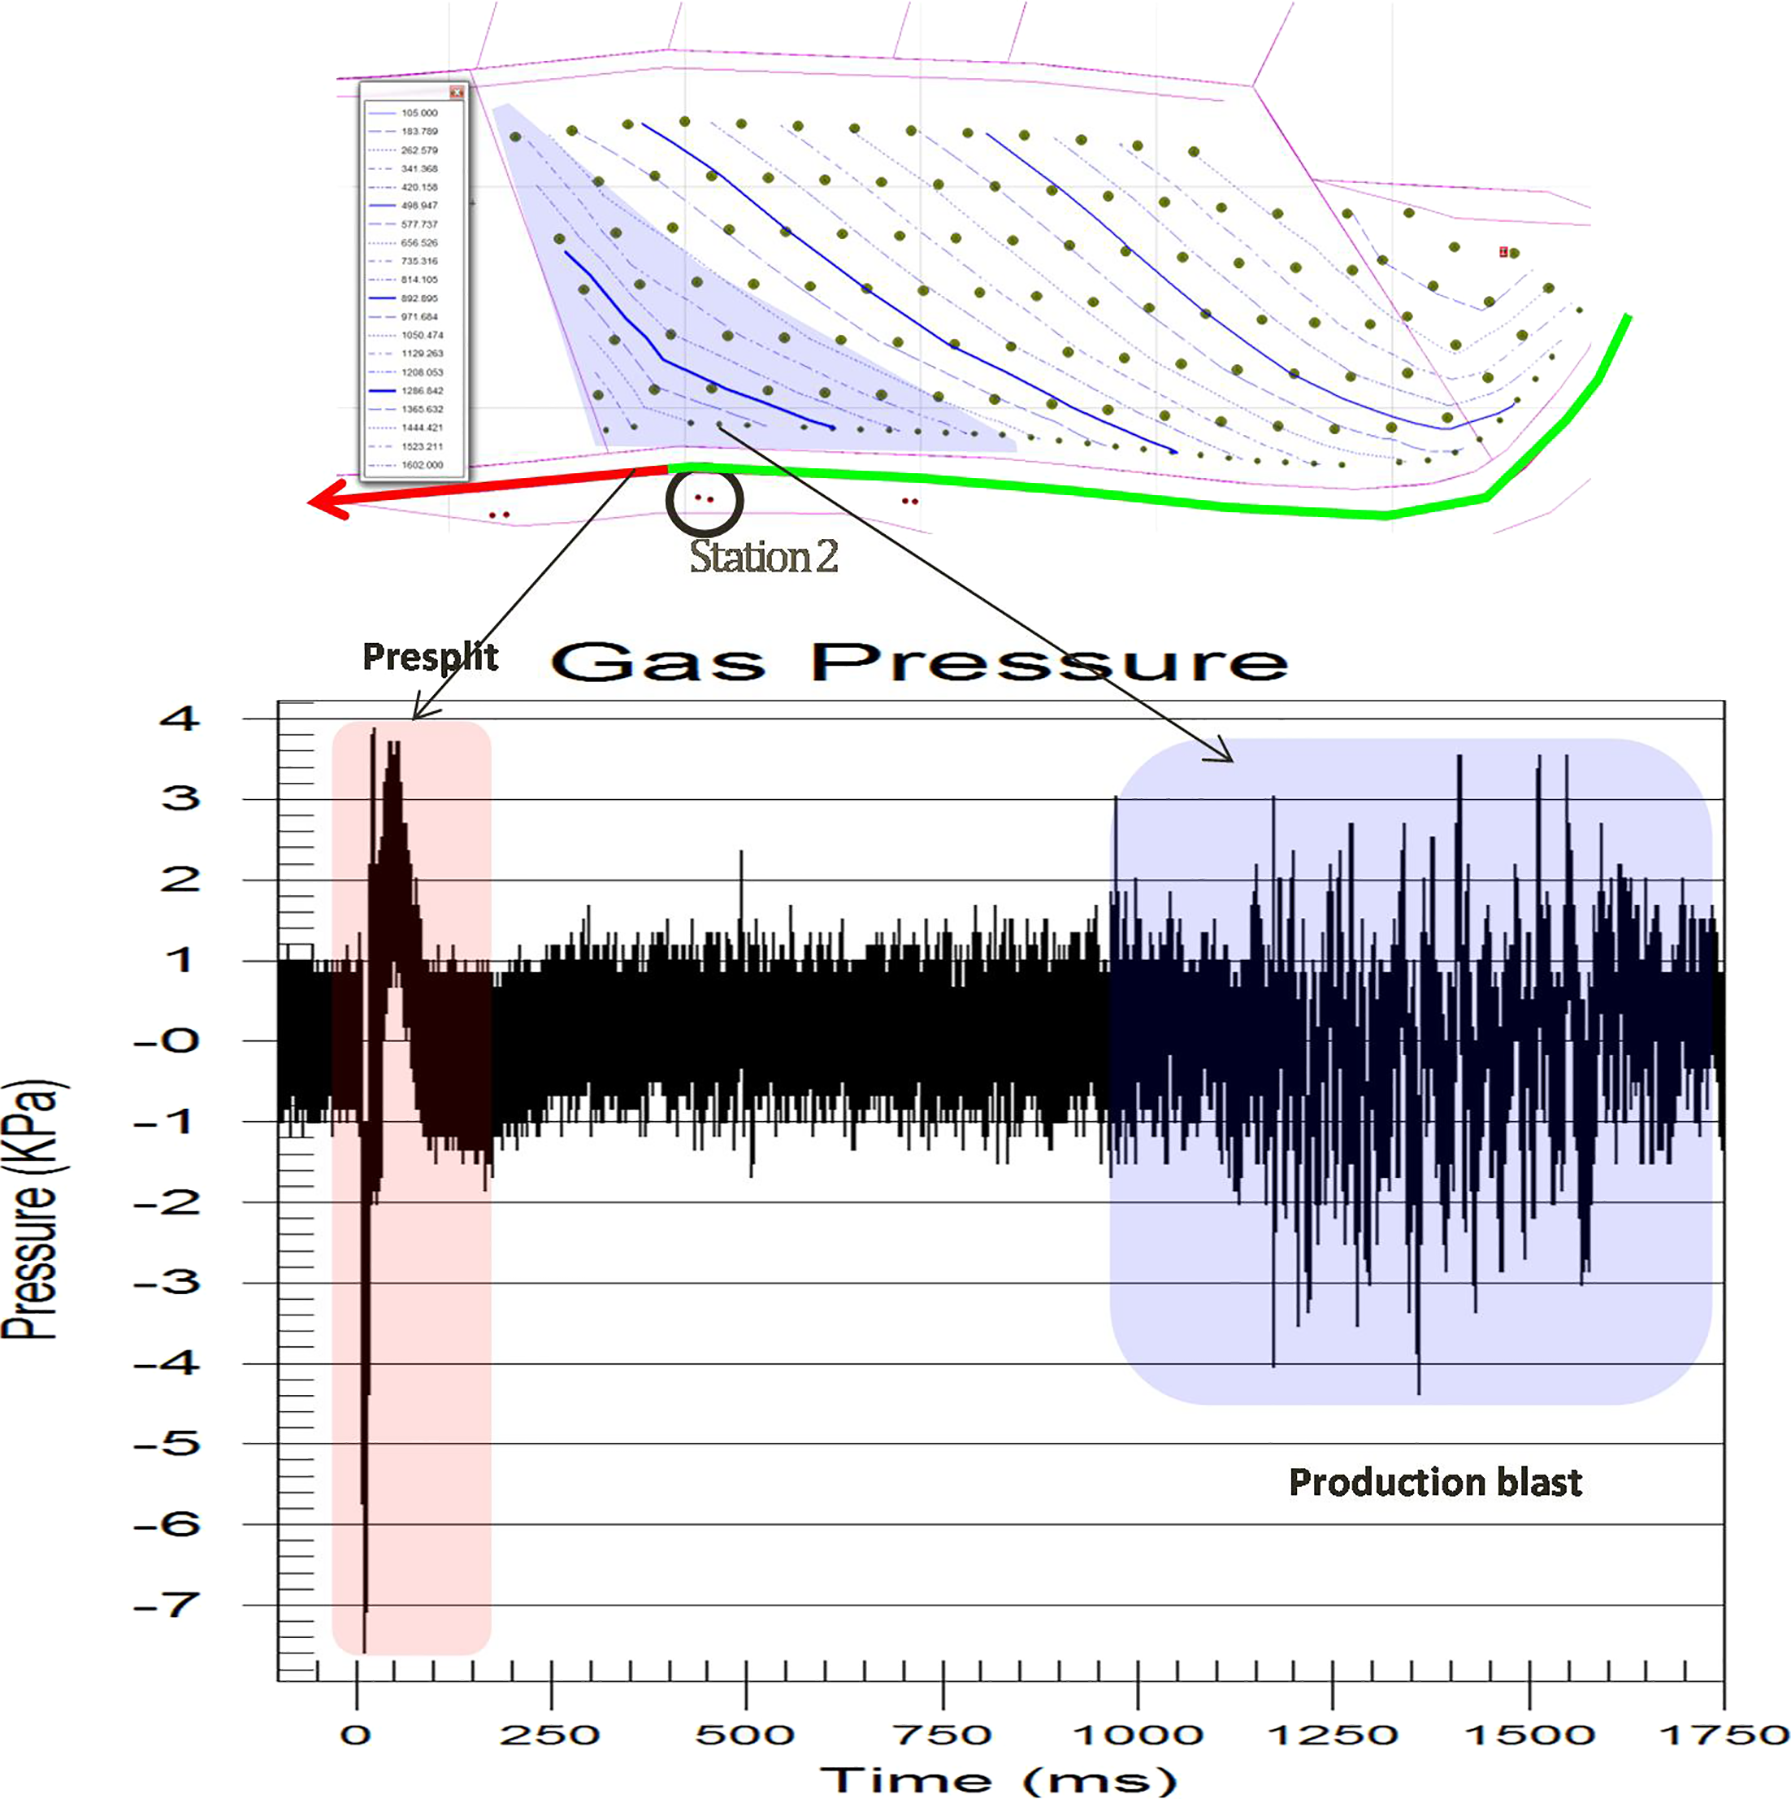
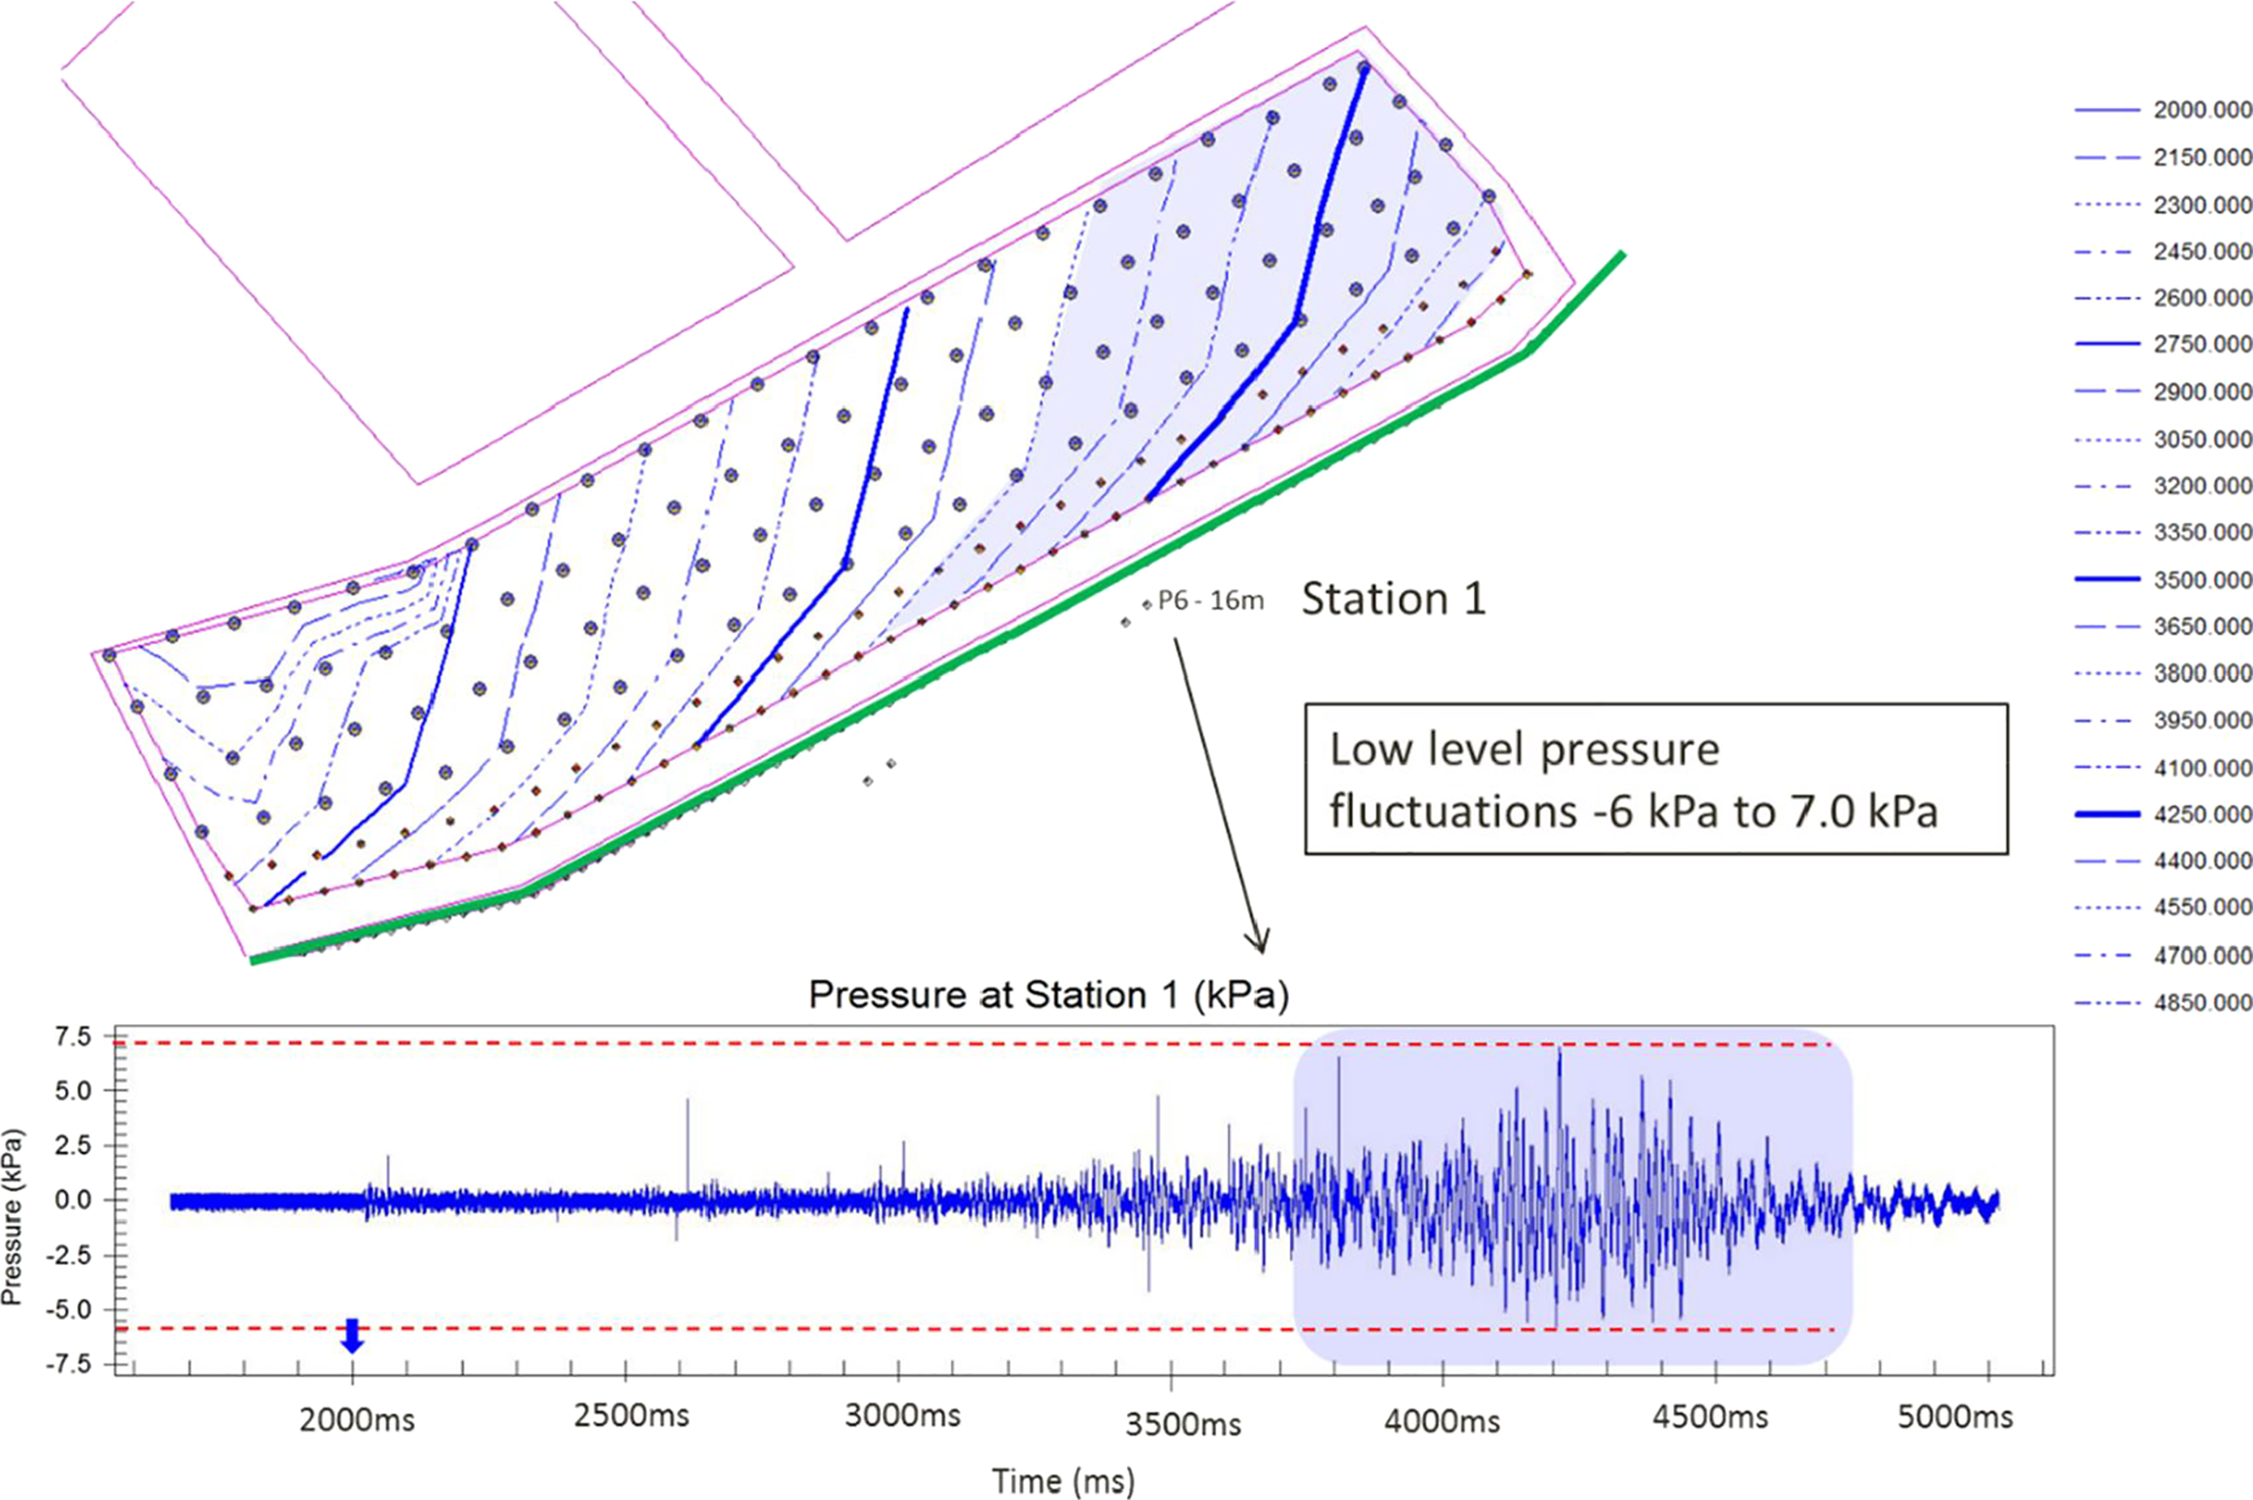
The second example corresponds to blast F03B2088_312. Figures 16 and 17 show gas pressure measurements behind the pre-split line at stations 2 and 1, respectively. Again station 2 is shown first because of the point of initiation in relation to the monitoring stations. In both cases, there is a clear fluctuation of low level gas pressures in the range of − 5.5 and +5.0 kPa at station 2 and − 6 to +7 kPa at station 1. The higher pressures at station 1 may also be attributed to the lack of relief (confinement) as the blast progresses towards the eastern end.
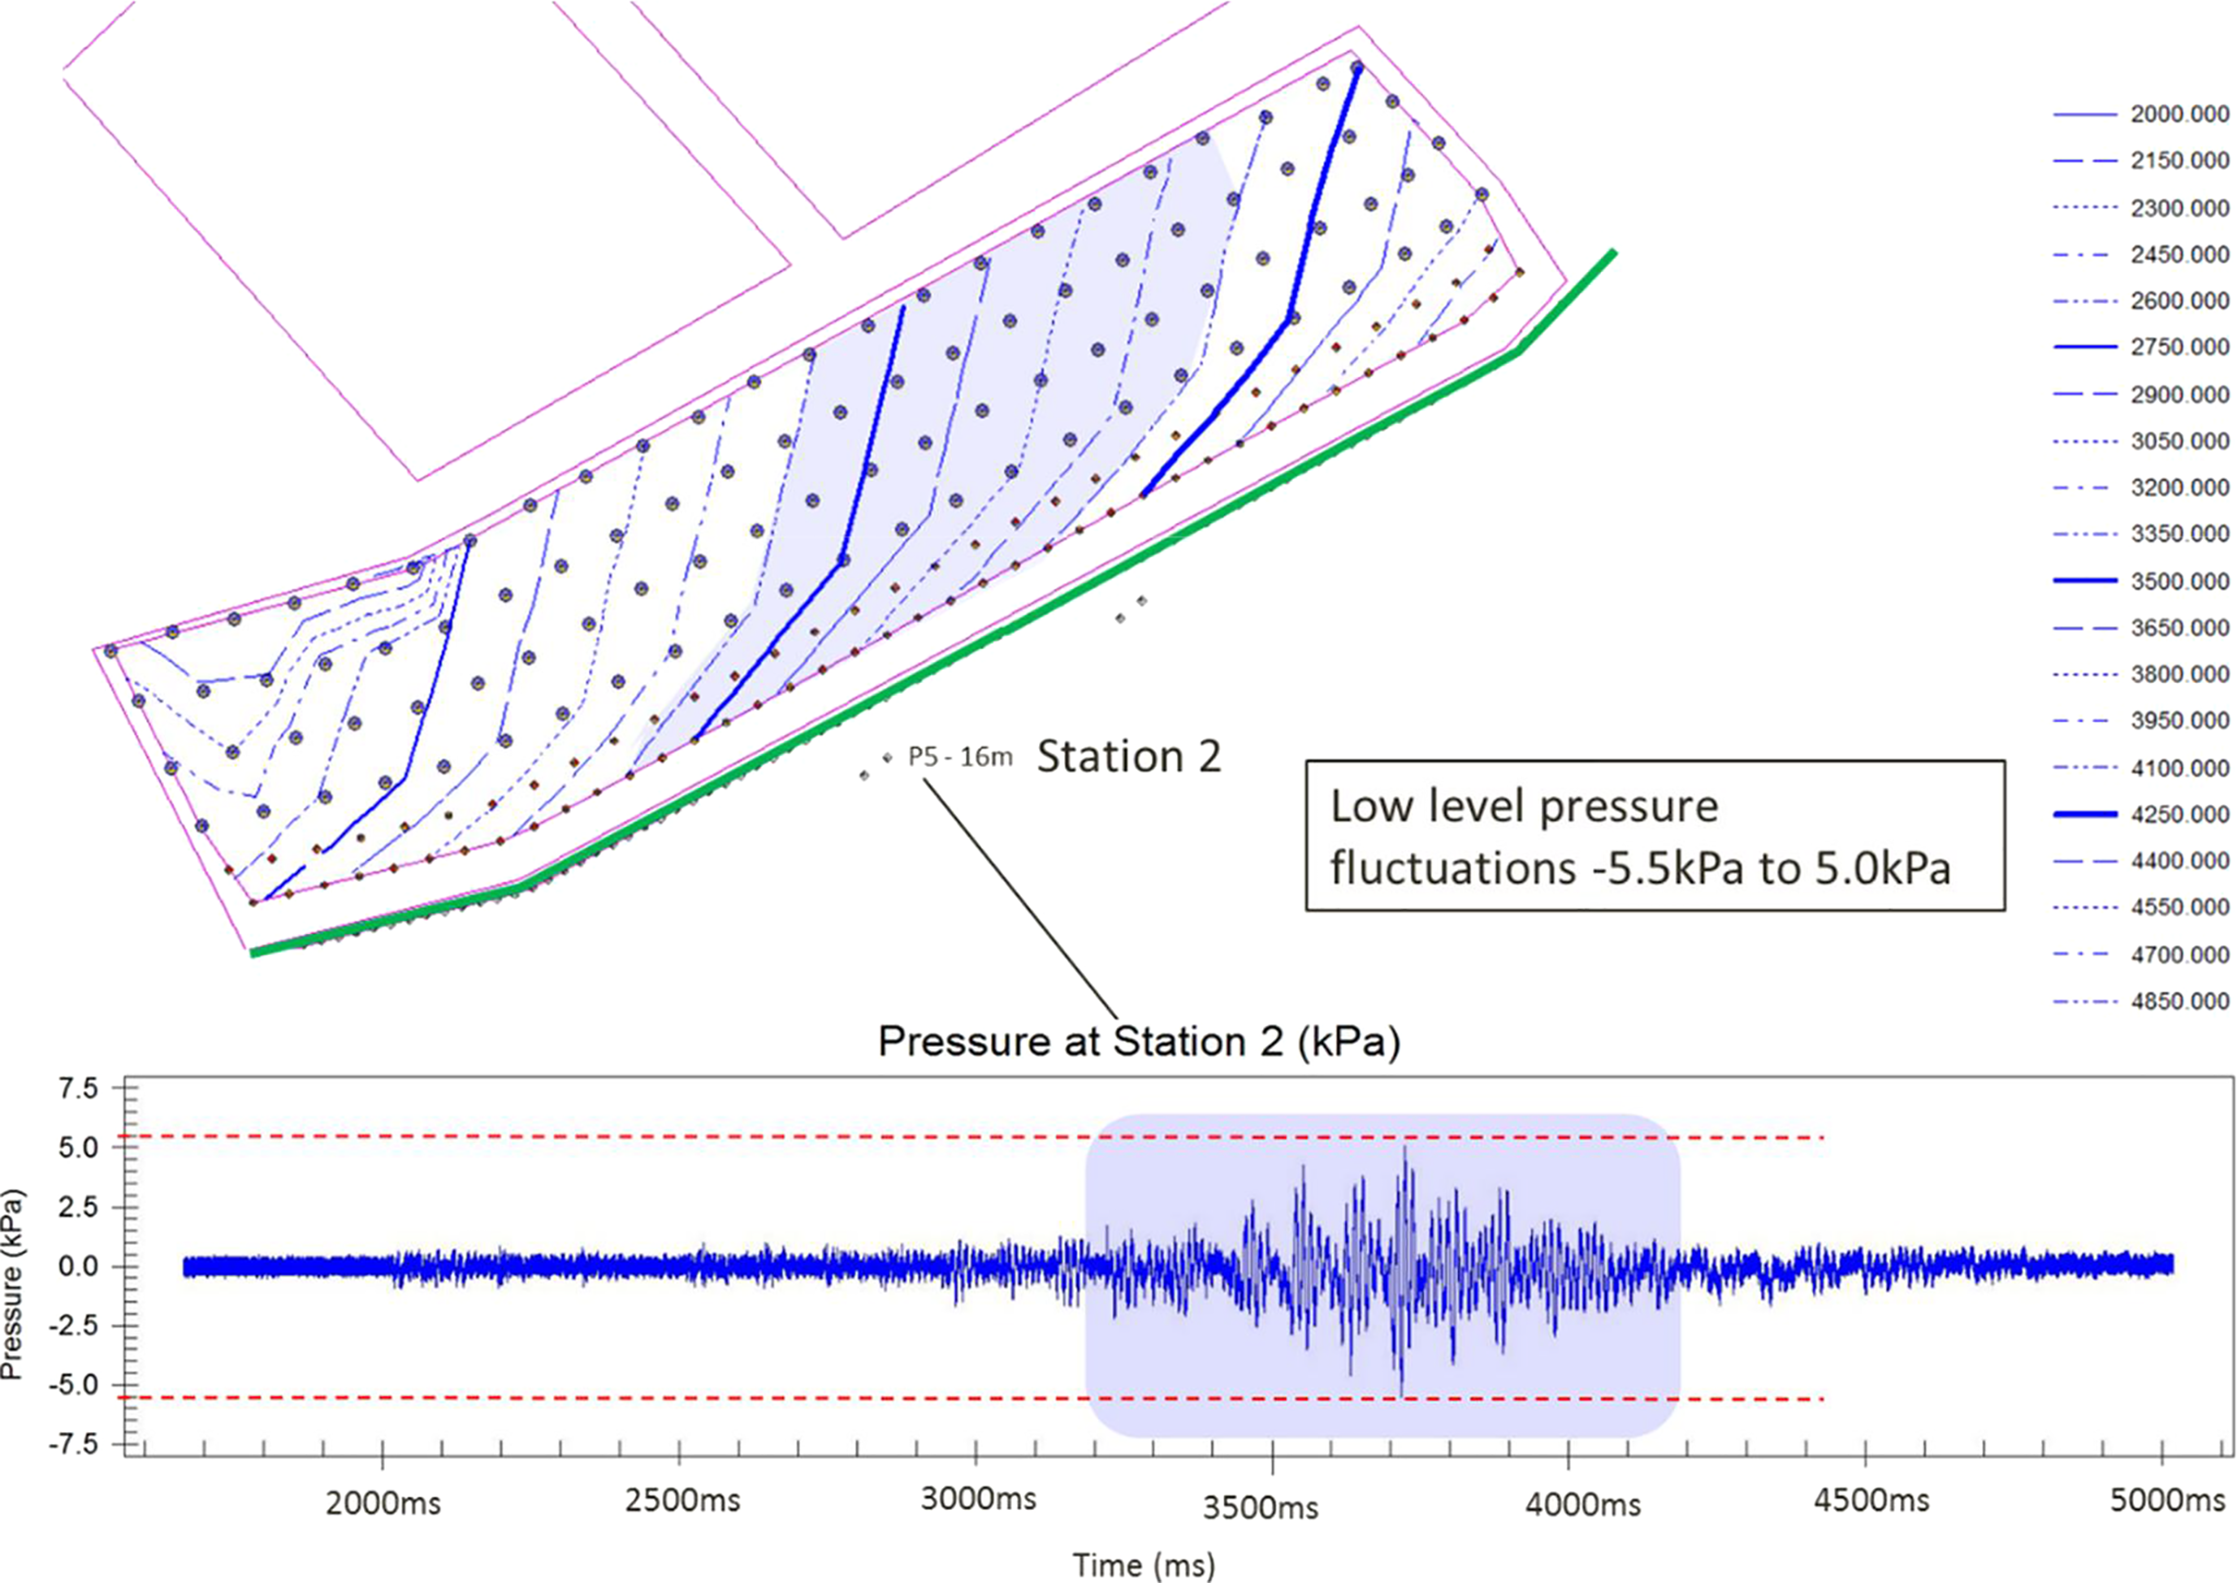
Gas pressures at station 2 from blast T_F03B2088_312
Gas pressure at station 2 from buffer and production section of blast T_F03B2088_312
Summary of results from all monitored blasts
Table 3 provides a summary of the results from all six blasts monitored during the campaign at Centinela Sulphide mine. Based on the criteria established earlier, the effectiveness of the pre-split was recorded for each blasted zone. In general, the recorded PPV vector sum in all blasts was below the threshold of damage of intact rock and discontinuities. Differences in peak particle velocities between stations could be attributed to changes in the degree of confinement as the detonation front moves across the blast pattern.
Summary of monitoring results
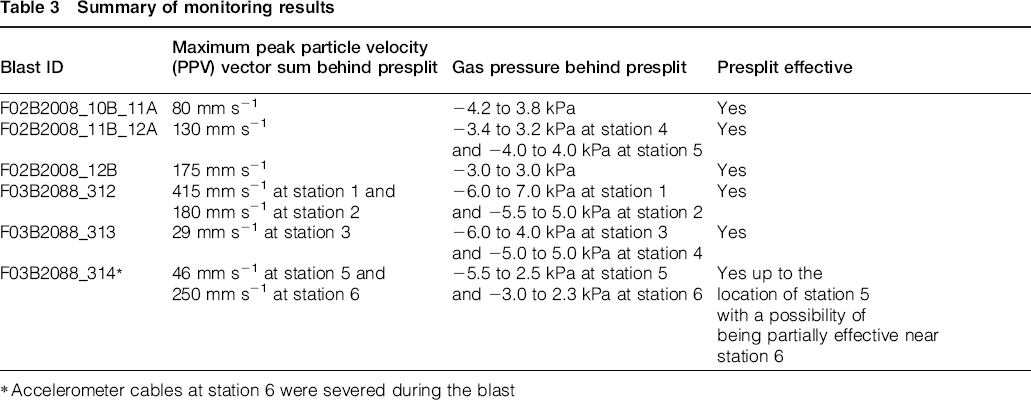
Accelerometer cables at station 6 were severed during the blast
As highlighted in Table 3, no data were able to be recorded from blastholes firing close to station 6 in blast F03B2088_314. As shown in Fig. 18, data were only recorded up to the middle section of the blast, which was approximately 25 m away from the monitoring station. The maximum PPV recorded was 250 mm s− 1 at this distance, suggesting that there was a potential for much higher levels to be reached as the detonation front moved closer to the monitoring station. Unfortunately, this could not be validated as the accelerometer cables were severed during the blast.
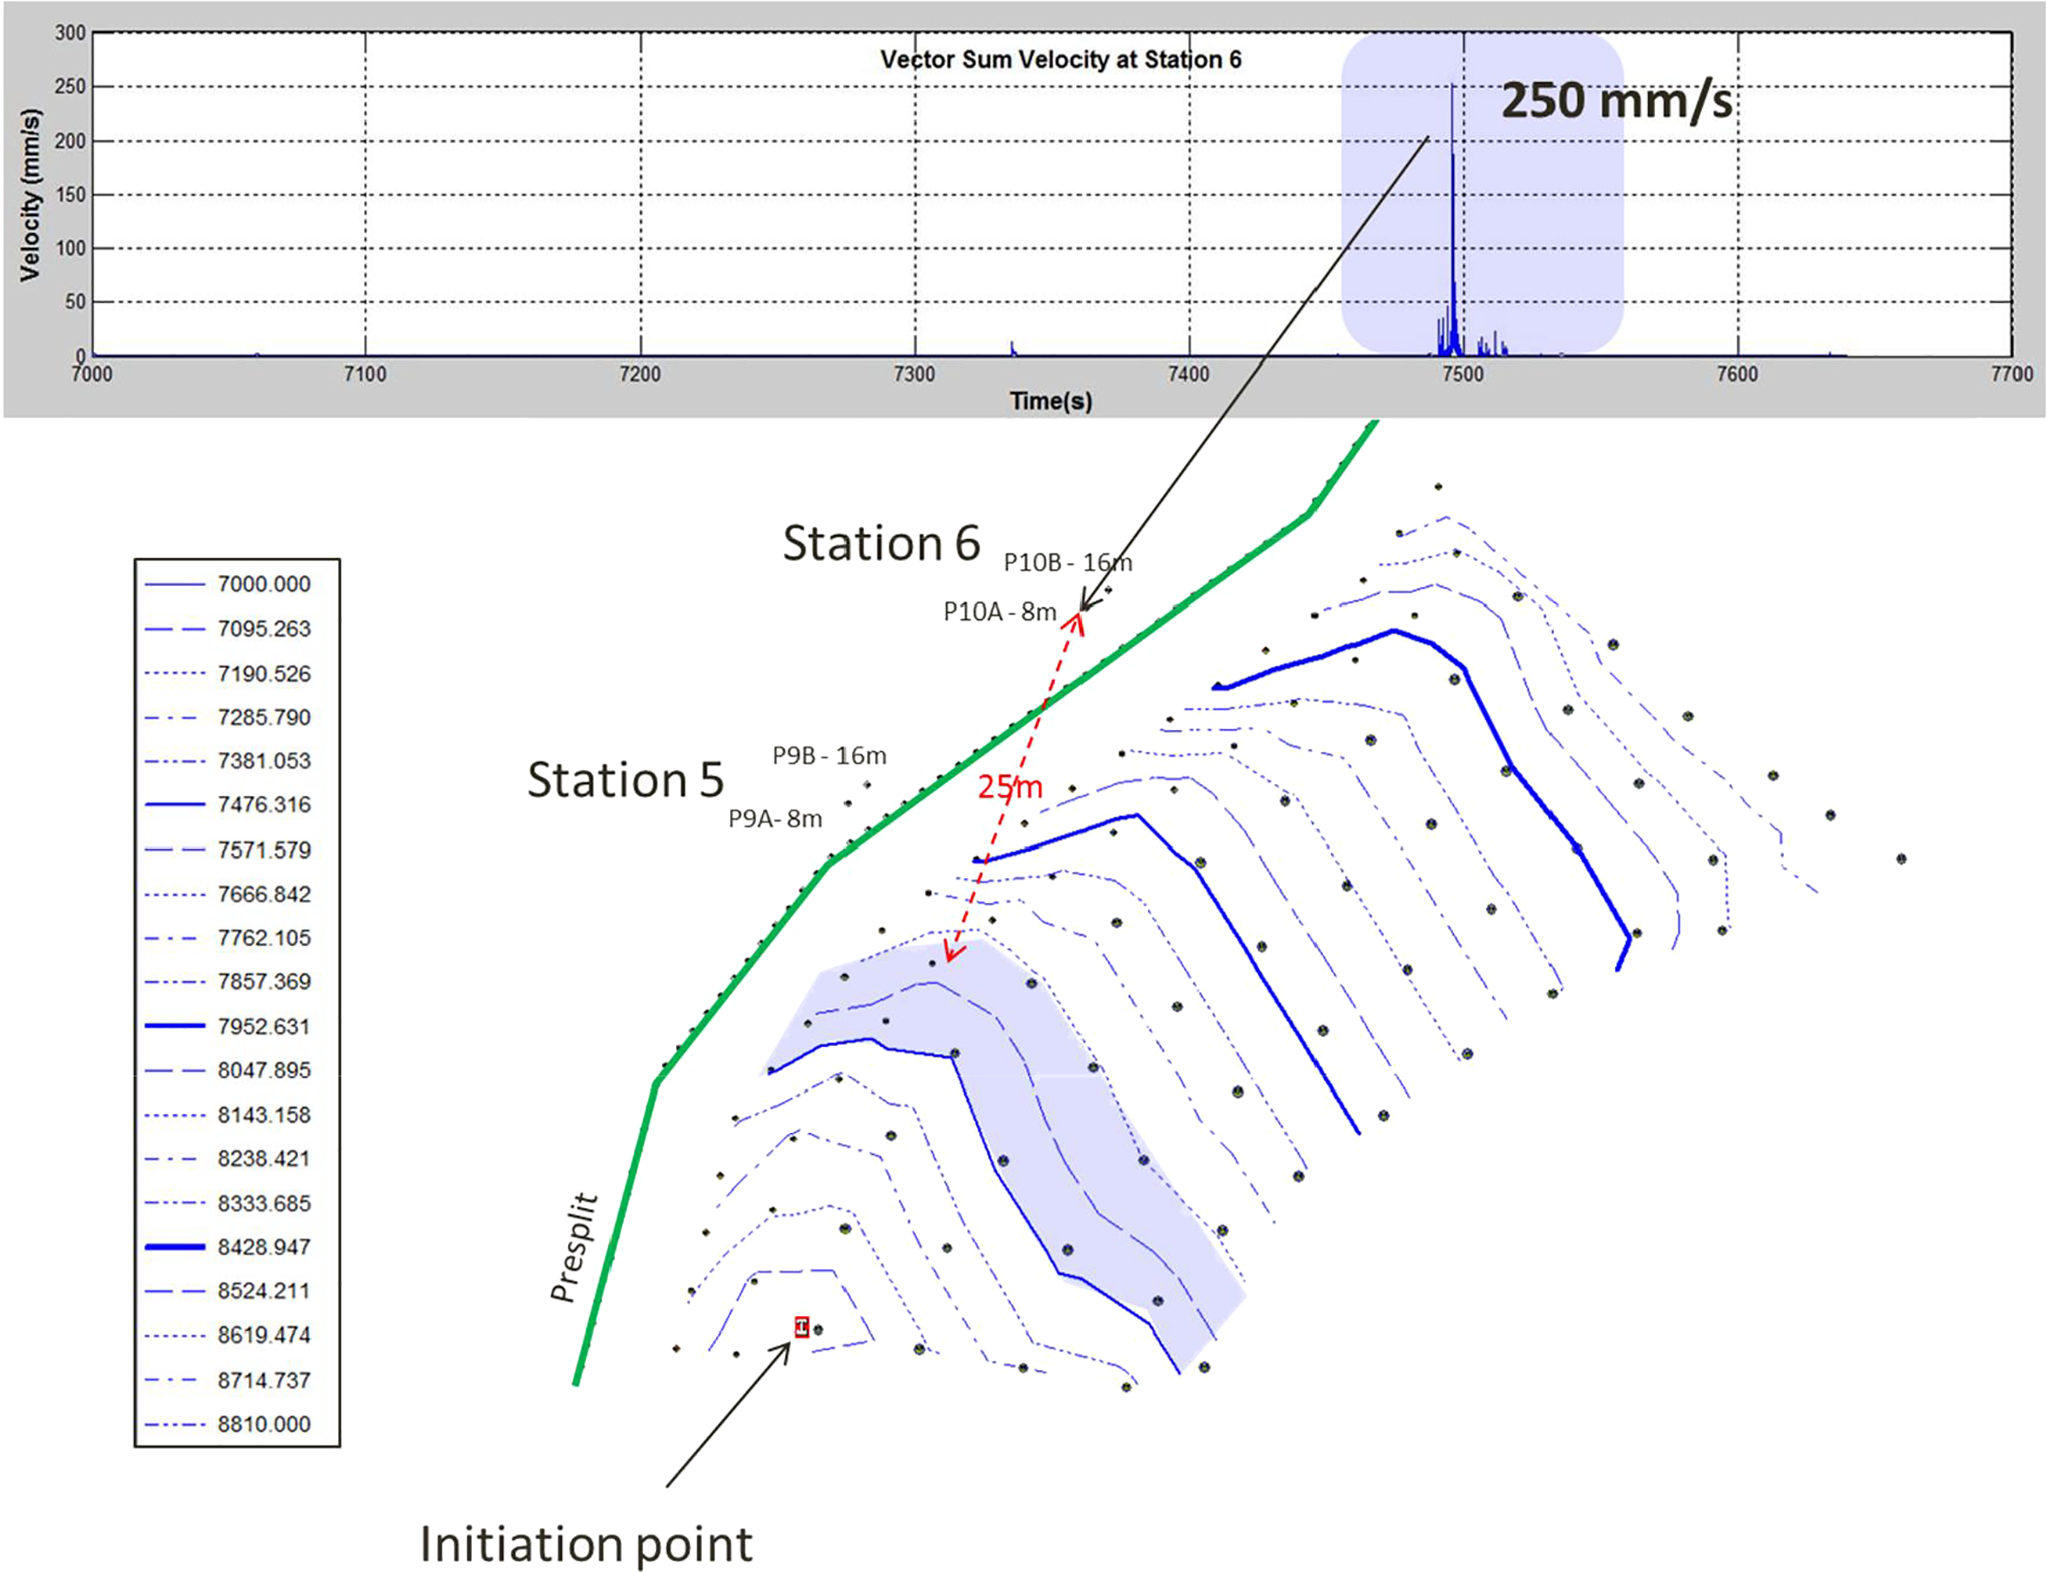
Peak particle velocity (PPV) vector sum measured at station 6 up to middle section of blast F03B2088_314
With regards to the recorded gas pressure data, measurements from buffer and production blasts showed fluctuations of low pressure levels in all cases. This reinforced the view that pre-splits were adequately filtering gases. The amplitude of gas pressures was also well below the established shear strength threshold of discontinuities.
From the analysis of the monitored data, it was concluded that pre-split practices in the domains monitored at Centinela Sulphide mine were effective at filtering blast-induced stresses and gases and this minimise rock mass damage near final walls.
Conclusions
In most cases, the design process of pre-splits only relies on simple rules of thumb and design parameters need to be validated in each domain once implemented. This particular work focused on the direct measurement of pre-split performance at the Centinela Sulphide mine through a targeted blast monitoring campaign.
One the main objectives was to measure peak particle acceleration, velocity and gas pressures behind pre-split lines with the view to evaluate its effectiveness as a filtering medium to both stress induced and gas penetration mechanisms. A criterion was established based on knowledge of the geotechnical characteristics of the intact rock and rock mass at Centinela, which was supplemented by documented experiences of near field blast monitoring.
Maximum PPV at different locations and across all blasts ranged from 29 to 415 mm s− 1. Differences in peak particle velocities between stations of the same blast were attributed to changes in the degree of confinement as the detonation front moved across the blast pattern. With regards to the recorded gas pressure data, measurements from production blasts showed fluctuations of low pressure levels in all cases. This reinforced the view that pre-splits were adequately filtering gases from both production and buffer zones.
The peak amplitudes of gas pressures were also well below the established shear strength threshold of discontinuities and also well below previous work conducted behind production blast without the presence of a pre-split. It was therefore concluded that from the analysis of monitored data, pre-split design parameters implemented in the domains monitored at Centinela Sulphide mine were effective at filtering blast-induced stresses and gases. It was recommended that parameters be maintained and quality of implementation controlled in order to minimise the potential for rock mass damage in final walls.
Currently, research work is continuing in order to streamline monitoring techniques and overall data analysis and reporting. This involves the use of wireless technology and advances in portable data acquisition systems. In this way, wall control and more general blasting practices could be routinely verified and design parameters continuously optimise.