
Abstract
A mining complex may be comprised of multiple components, including open-pit and underground operations. Traditional approaches in mine planning do not account for the various components simultaneously leading to under-value solutions. Over the last decade, some methods have been developed to incorporate multiple components of the mining value chain during optimisation. Even though these new methods incorporate more decisions and flexibility to the optimisation of a mining complex, they may either ignore uncertainties associated with the mining project or consider decisions taken before optimisation. This paper presents a method that optimises mining complexes comprised of multiple open-pits, underground operations and processing destinations. Mining, blending, processing and transportation decision variables are simultaneously optimised while accounting for geological uncertainty. The method uses a simulated annealing algorithm at different decision levels in order to generate a stochastic-based extraction sequence and processing policies. A case study shows its ability to generate a higher NPV while facing a reduced amount of risk when compared to traditional optimisation methods.
Introduction
A mining complex is a value chain with multiple components: deposits, stockpiles, processing destinations and transportation systems. Optimising a mining complex demands the simultaneous optimisation of all its components, a problem known in the mining literature as global optimisation of mining (Whittle 2007; Whittle 2010). Several methods have been developed to incorporate multiple components of the value chain during the optimisation. Hoerger et al. (1999) formulate the problem of optimising the simultaneous mining of multiple pits and the delivery of ore to multiple plants as a mixed integer program. The model group blocks into increments and accounts for multiple stockpiles. The authors implement the model at Newmont's Nevada operations where 50 sources, 60 destinations and eight stockpiles are present, which leads to an increase of profitability by taking advantage of the synergies. Stone et al. (2007) present the Blasor optimisation tool developed by the mine planning optimisation group within BHP Billiton technology. Blasor formulates the problem of determining the optimal extraction sequence of multiple pits as a mixed integer linear program and solves it using ILOG CPLEX (IBM Corp 2011). Menabde et al. (2007) Blasor aggregates spatially connected blocks that have similar properties and generates nearly optimal solutions in practical times in large-scale operations: Yandi (1000 aggregates, 11 pits, 20 periods) and Illawarra Coal mine (eight domains) (Rocchi et al.2011). Zuckerberg et al. (2007) present Blasor-InPitDumping (Blasor IPD) that is an extension of Blasor that accounts for waste handling; that is, it incorporates refilling mined-out areas with waste. Zuckerberg, Van der Riet et al. (2011) introduce Bodor to optimise the sequence of extraction of bauxite ‘pods’ at Boddington bauxite mine, south-western Australia. Pods are distinct bodies of modest-sized ore that are lying close to the surface. Chanda (2007) formulates the delivery of material from different deposits to a metallurgical complex as a network linear programming optimisation problem. The model attempts to minimise the costs through the network that encompasses mines, concentrators, smelters, refineries and market regions. Wooller (2007) describes COMET, software used to optimise mill throughput/recovery and cutoff grade. COMET uses an iterative algorithm to define operating policies and process routes; e.g. heap leach versus concentration. Whittle (2007) introduces the global asset optimisation tool incorporated in Whittle software. The tool is designed to optimise the sequence of extraction of multiple deposits considering complex processing and blending operations.
The methods described above ignore the uncertainty associated with different parameters. Groeneveld et al. (2010) incorporate uncertainty in market price, costs, utilisation of equipment, plant recovery and time for building options (infrastructure) while simultaneously optimising mining, stockpiling, processing and port policies. Bodon et al. (2010) model the problem of supplying exports in a coal chain as a discrete event simulation model (DES). The model is able to asses various operating practices, including maintenance options and capital expenditure to determine the best infrastructure for a given system. In both methods, geological uncertainty is discarded, which is the major contributor of not meeting production targets and NPV forecasts. Sabour and Dimitrakopoulos (2011) and Asad and Dimitrakopoulos (2013) incorporate market and geological uncertainty in the design of open-pits. Although efficient and able to incorporate several components of the value chain, the methods available in the technical literature have at least one of the following limitations when globally optimising mining complexes: some decisions are fixed when they should be dynamic (operating modes, destinations of mining blocks, etc.); component-based objectives are imposed, which may not coincide with global objectives; many parameters are assumed to be known when they are uncertain (Whittle 2007).
The geological uncertainty of a deposit can be modelled by means of stochastic orebody simulations (Goovaerts 1997; Mustapha et al.2014; Straubhaar and Malinverni 2014; Maleki and Emery 2015). Several methods have been used to incorporate geological uncertainty for the open-pit production scheduling problem (Leite and Dimitrakopoulos 2007, 2008, 2014; Albor and Dimitrakopoulos 2009, 2010; Ramazan and Dimitrakopoulos 2013; Lamghari and Dimitrakopoulos 2012; Lamghari et al.2013; Dimitrakopoulos and Ramazan 2004); however, little work has been done regarding the production scheduling of underground mines. Grieco and Dimitrakopoulos (2007) implement probabilistic programming in stope design optimisation. The authors evaluate the probabilities of different rings of the above specified cutoffs. However, the probabilistic programming formulation discards the compound relationship between rings, whereas stochastic formulations make full use of joint local uncertainty.
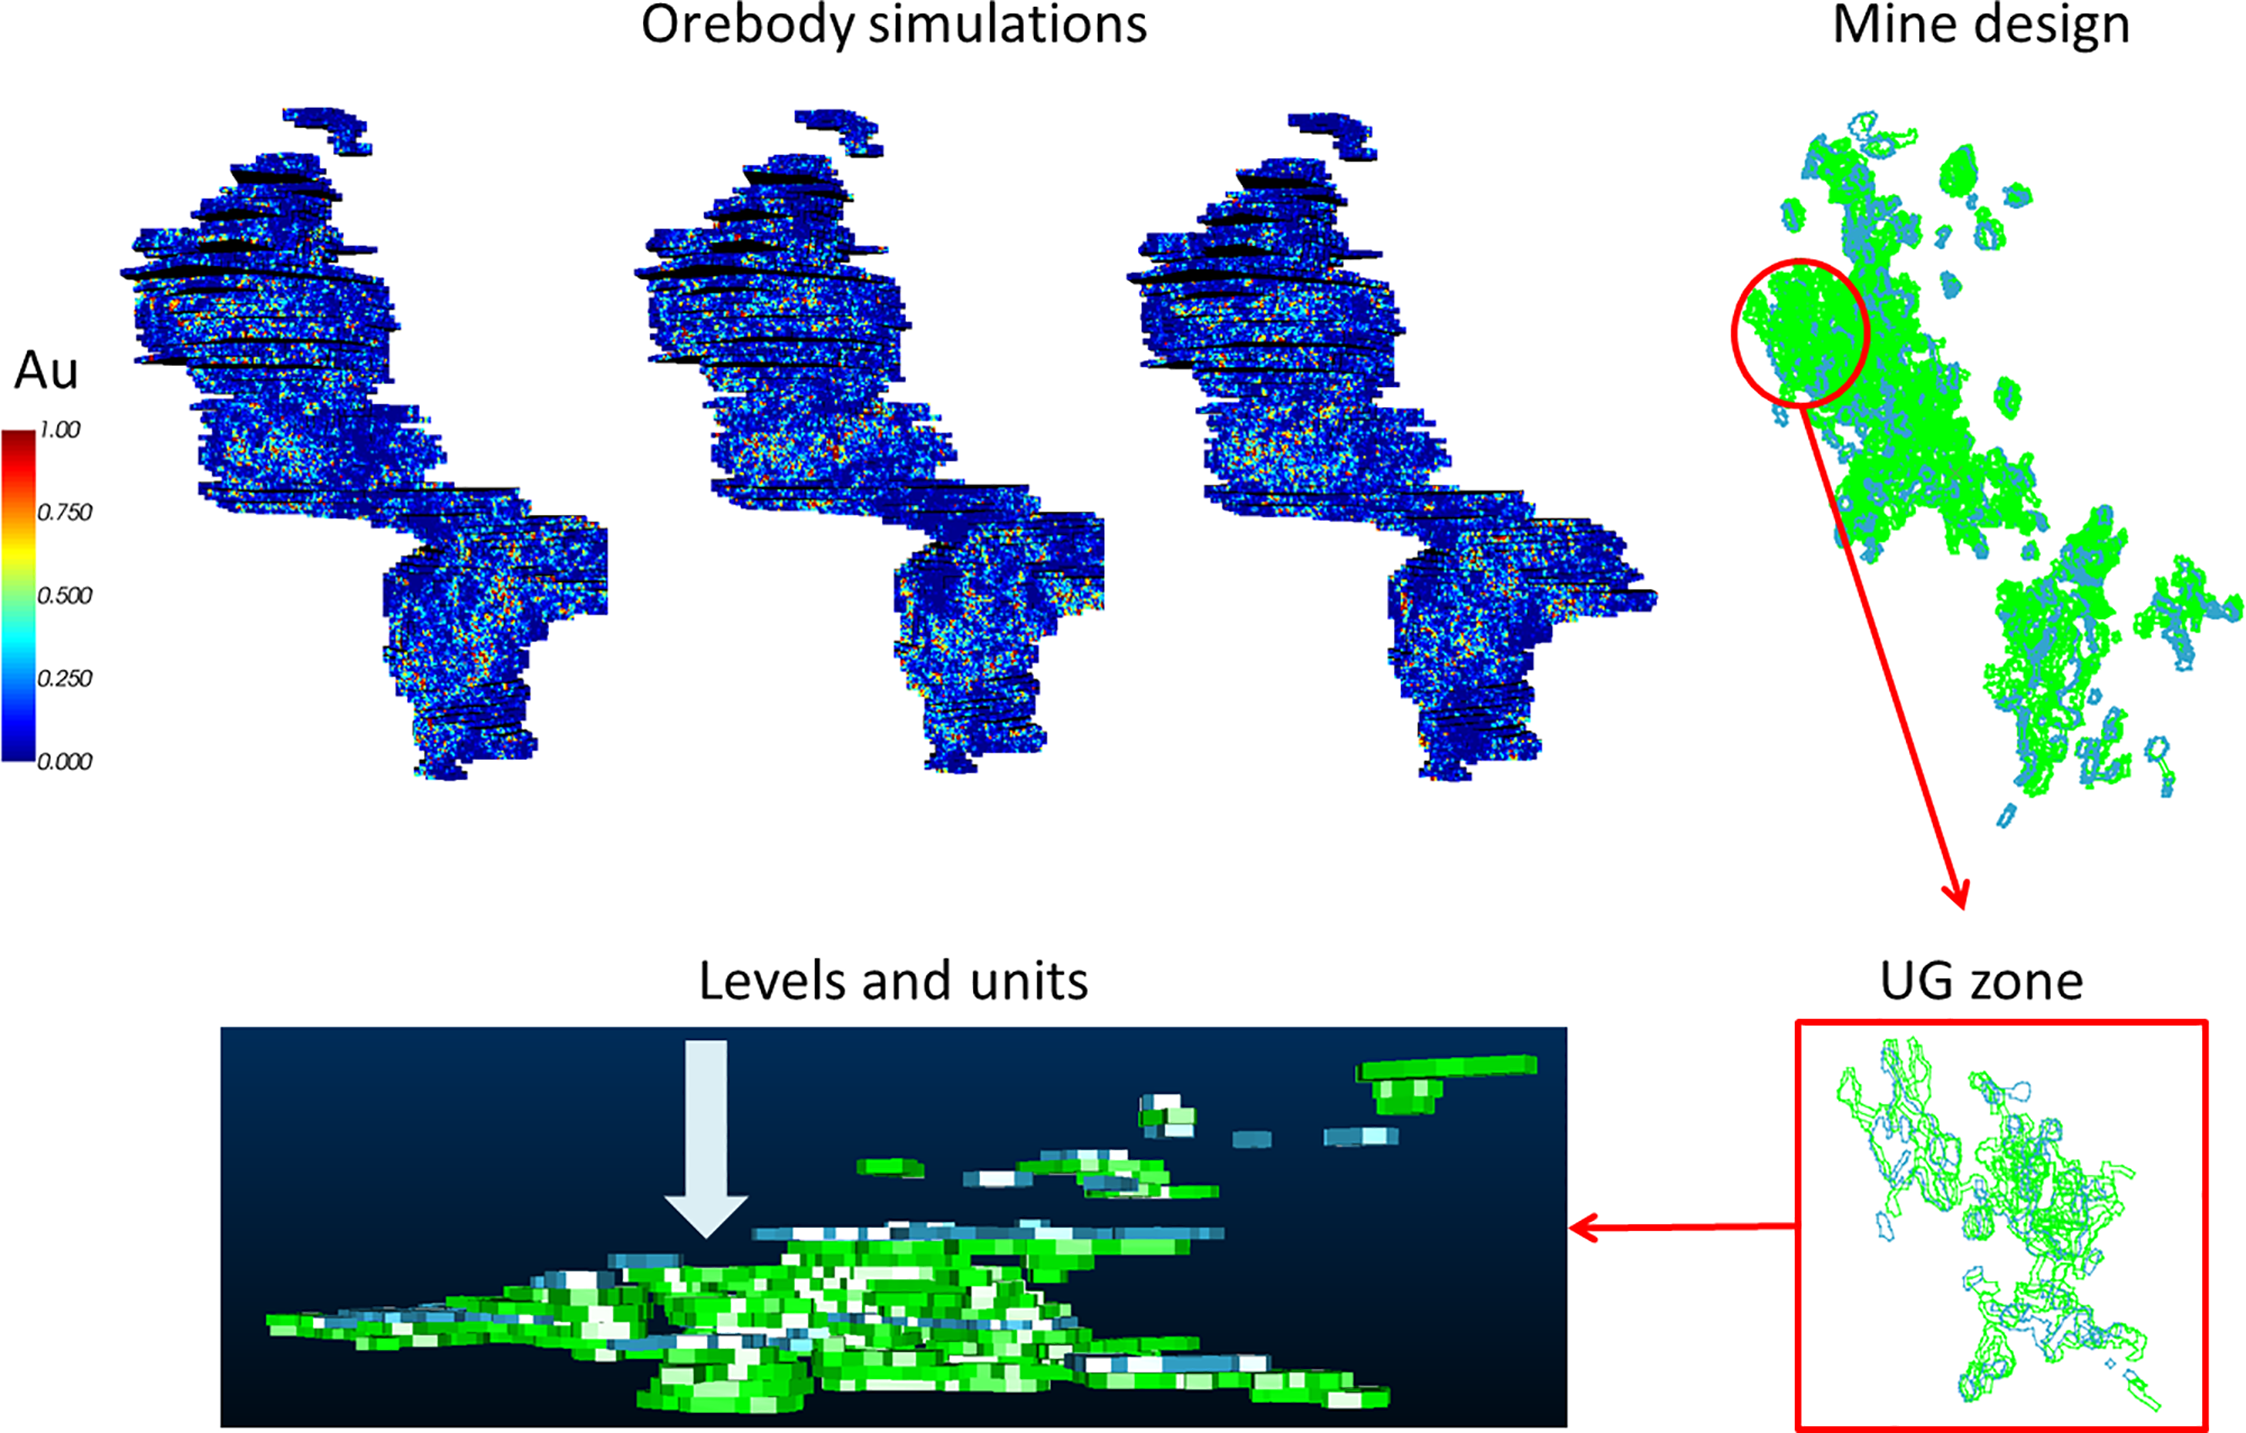
This paper describes a method for optimising a mining complex by simultaneously accounting for different components of the mineral value chain and geological uncertainty. To incorporate geological uncertainty, the method uses geological scenarios that are a combination of stochastic orebody simulations of different deposits (Ravenscroft 1992; Dowd 1994; Godoy and Dimitrakopoulos 2011) (Fig. 1). The main contribution of the method is its ability to integrate the optimisation of different components simultaneously, which avoids simplifying assumptions that exist in standard industry practices. Such components include the mining from multiple open-pit mines and/or underground operations. Furthermore, by accounting for the uncertainty associated with different deposits, the method is capable of generating solutions with higher value and less risk when compared to solutions generated using standard industry practices, as can be seen from its implementation at a gold mining complex in Case study: a gold mining complex section.
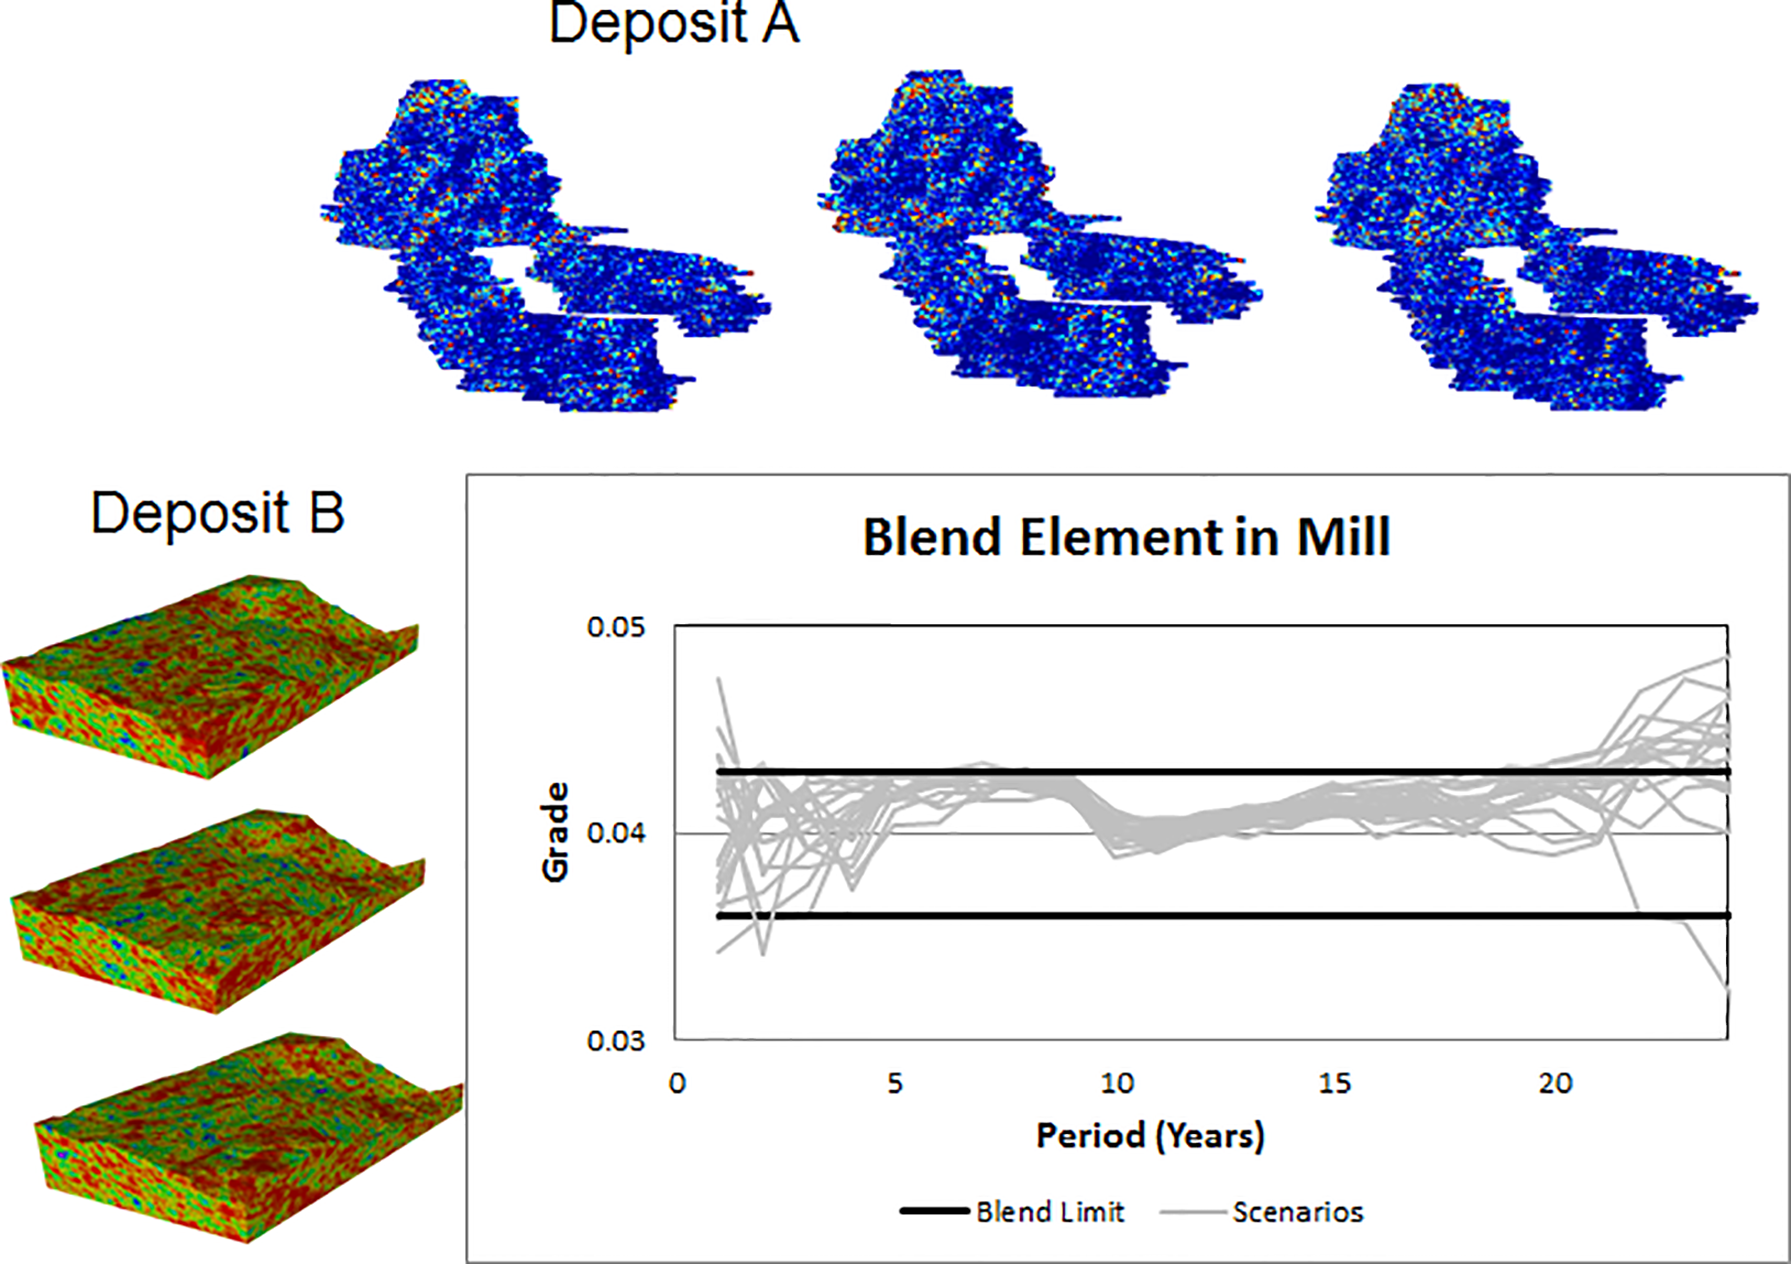
Geological scenarios: grade of a blending element for each scenario
Optimising the components of the mineral value chain
A mining complex is comprised of multiple components including mineral deposits, stockpiles, processing destinations and transportation systems (Fig. 2). Mineral deposits are the sources of material. Different types of ore are extracted via open-pits or underground mining methods. Open-pits are discretised into mining blocks, whereas underground mines contain development, preparation and production activities. Different underground mining methods have different activities; however, regardless of the mining method, the mine design can be discretised in activities and dependences, that is, each activity has a set of successor and predecessor activities, similar to slope constraints in an open-pit. Mining blocks in open-pits and activities in underground mines are named as ‘units’ in this article. Each unit can be sent to a particular processing destination or a stockpile. There may be as many stockpiles as metallurgical ore types available from the deposits. Stockpiles contain potential ore, contribute to the blending operation and serve as a backup supply of material.
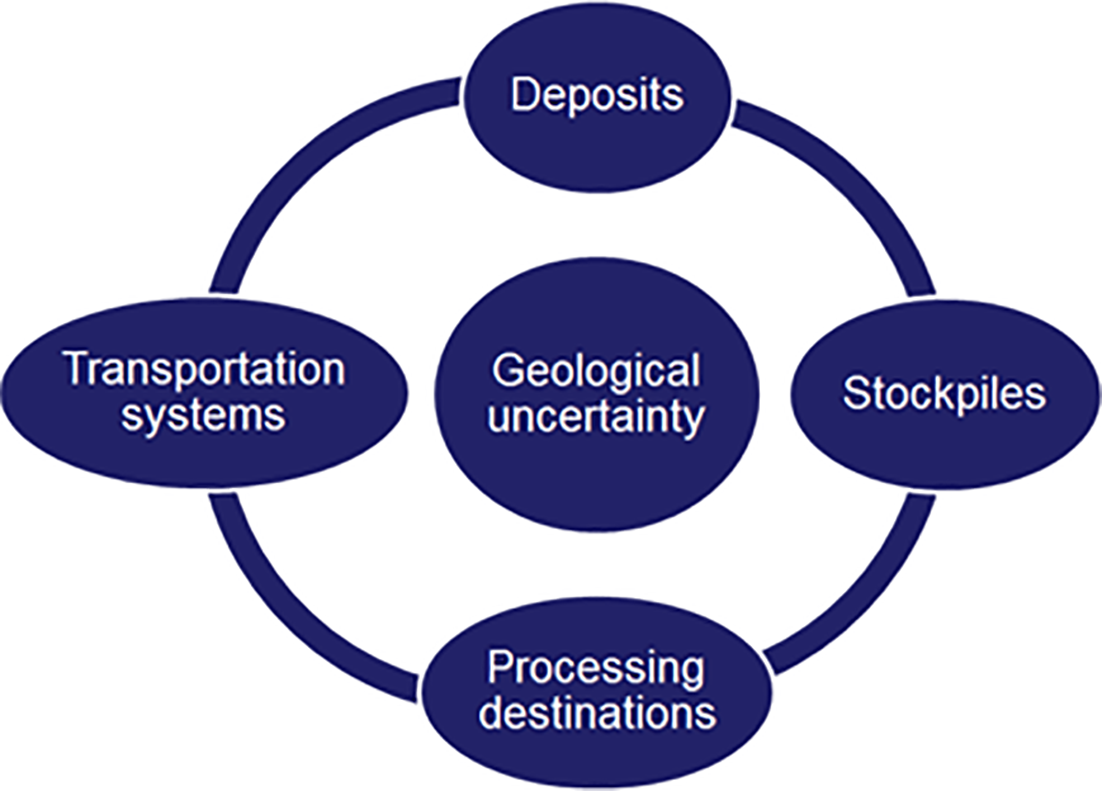
Components of a mining complex
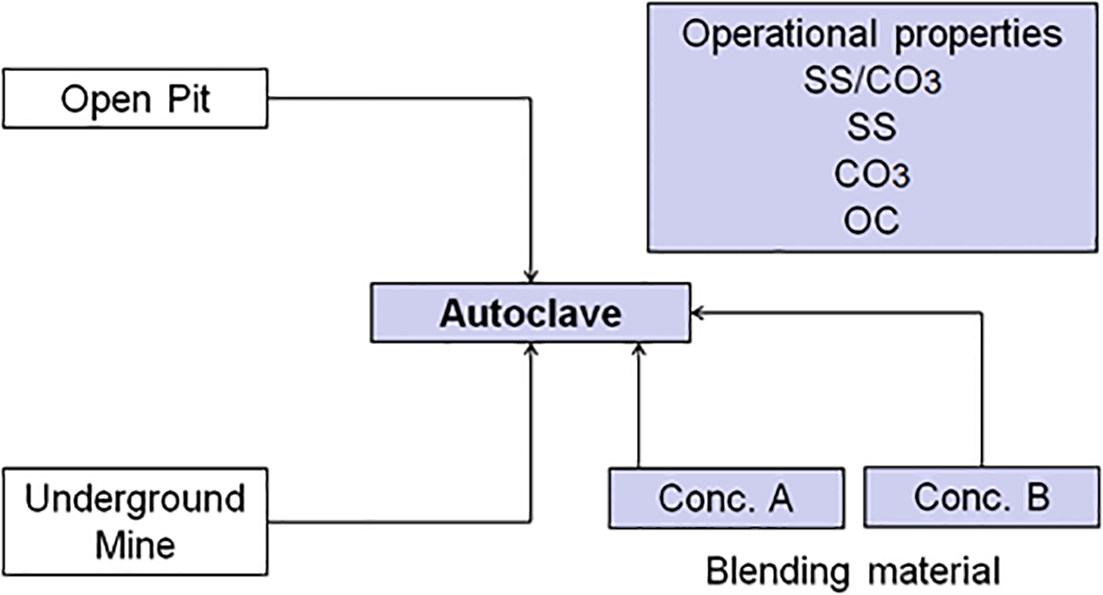
Each processing destination may have operating modes that determine the operating costs, metallurgical recoveries, operational blending limits for the metallurgical properties and throughputs. For example, the capacity, operating cost and recovery of a milling plant change if it operates to generate fine material (80 μm) or coarse material (120 μm). The choice of operating mode at a processing destination should be made by accounting for the decisions taken at the other components of the value chain. In some cases, the quality of the material extracted from different deposits does not meet the specific blending requirements at a given processing destination. To meet the quality targets, external blending materials are added to specific destinations (Fig. 3). These materials come from external sources and have very specific qualities. For example, in an autoclave, external material with high sulphide and low carbonate may be added to meet the SS/CO3 ratio if the ore extracted from the deposits have low sulphide.
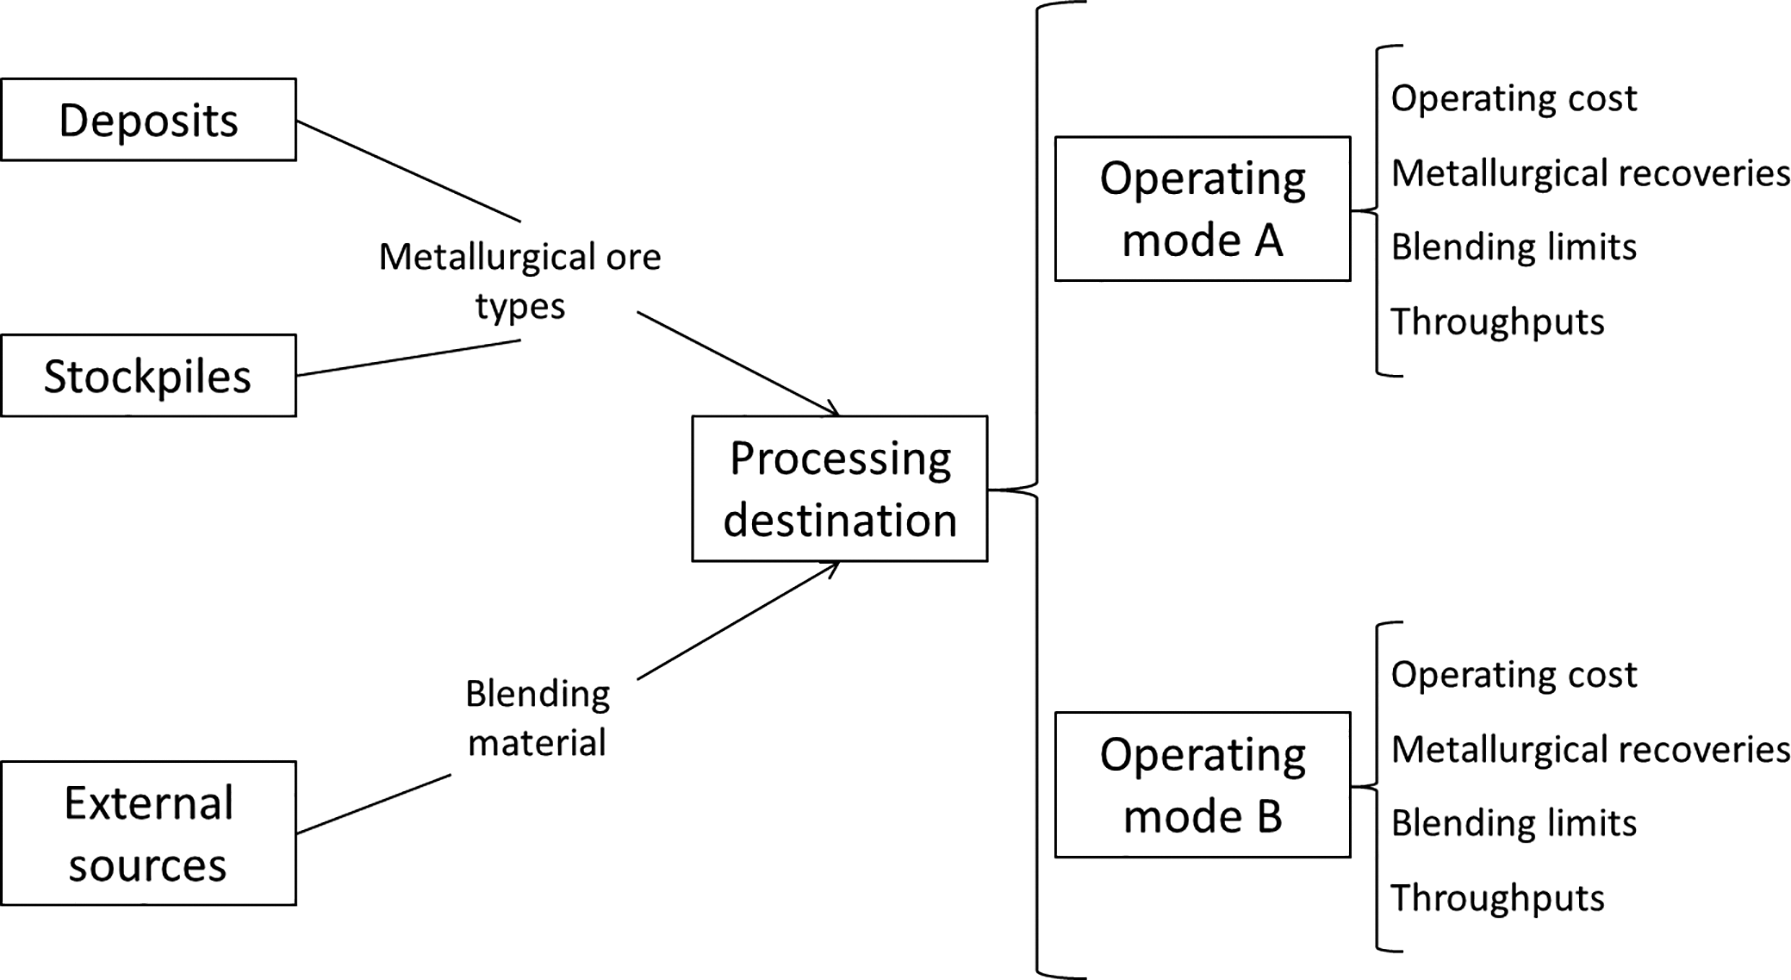
Operating modes in a processing destination
The output material from the processing destinations is transported to final stocks or ports using available transportation systems (Fig. 4). It is important to account for transportation systems when optimising a mining complex given that they can limit the overall throughput of the system (bottleneck). Each transportation system has its associated cost and capacity.
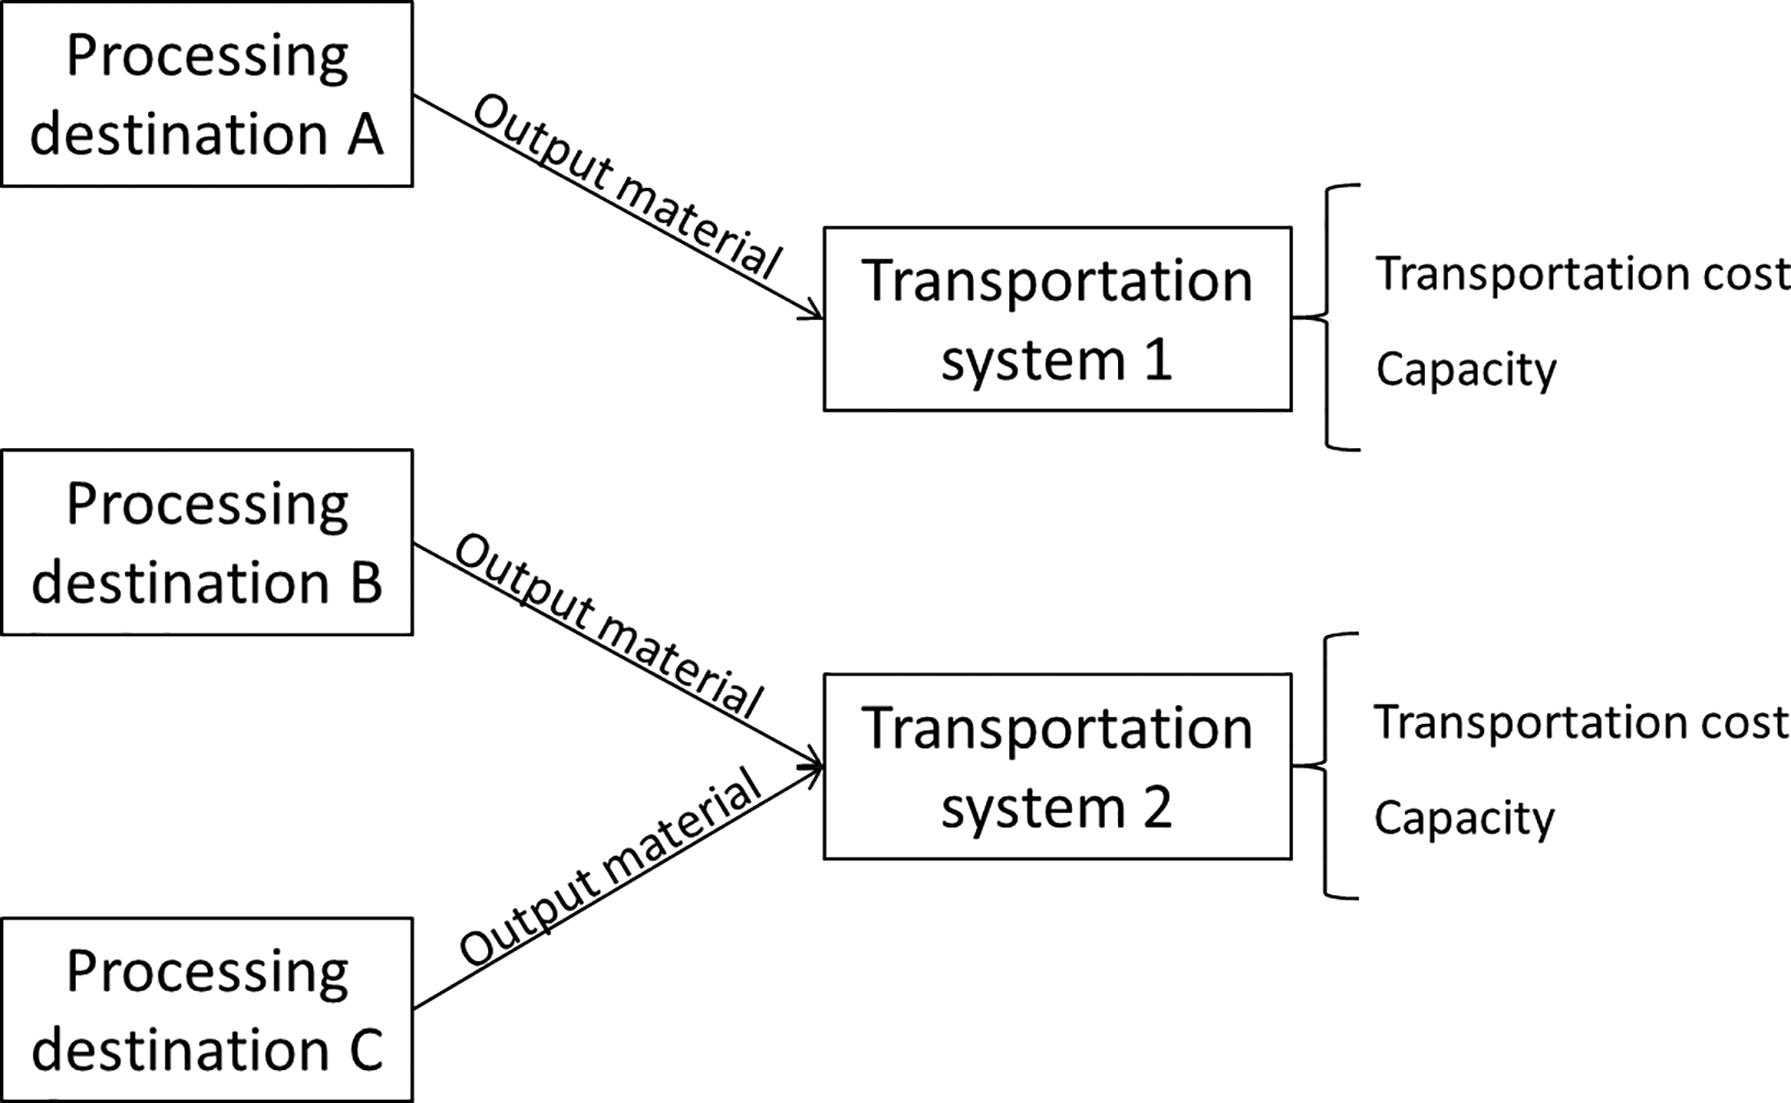
Transportation of products to final stocks or ports
Given the strong interrelation between the different components of the mineral value chain, the optimisation of a mining complex demands the simultaneous optimisation of all its components, including open-pits and underground mines. The next section outlines the mathematical model used to optimise the mining complex.
Mathematical model
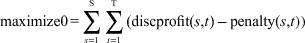
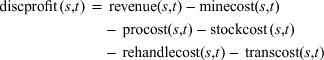
The goal is to maximise expected NPV while minimising deviations from targets associated with different components of the value chain. The objective function (Equation (1)) has two terms: discprofit(s,t) is the discounted profit in period t under scenario s; penalty(s,t) is a term that accounts for the penalised deviations from the targets at different components in period t under scenario s

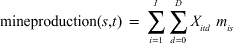
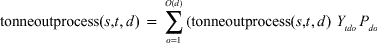
Three sets of decision variables are used to evaluate revenues, costs, production and deviations at different components of the value chain. X itd is a binary variable that represents whether or not a particular unit i is mined in period t and sent to processing destination d. Y tdo is a binary variable that represents whether or not an operating mode o is used in destination d during period t. Ztdr represents the proportion of output material from destination d transported using transportation system r during period t. The following equations show the evaluation of tonnages at different components using the decision variables described above
Solution approach based on simulated annealing
Any solution of the optimisation model must answer the questions associated with the three main sets of decision variables: (i) which units are going to be extracted in each period and where are they going to be sent? (X itd variables); (ii) which operating modes are going to be used at the different processing destinations? (Y tdo variables); and (iii) which transportation systems are going to be used? (Z tdr variables).
Given a particular solution, it is possible to modify the objective value by generating perturbations at three different decision levels. These perturbations should be done towards improvements in the objective value. Previous implementation of metaheuristic approaches based on perturbation for the mine production scheduling problem has shown their ability to generate solutions with higher value and less risk (Godoy 2003; Leite and Dimitrakopoulos 2007; Albor and Dimitrakopoulos 2009; Goodfellow and Dimitrakopoulos 2013). Given the monetary value associated with time because of discounting, profitable units should be pushed to be extracted in early periods and non-profitable ones should be pushed to later periods. Operating and transportation decisions should minimise processing and transportation costs and deviations.
The perturbation mechanism
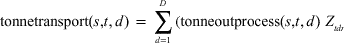
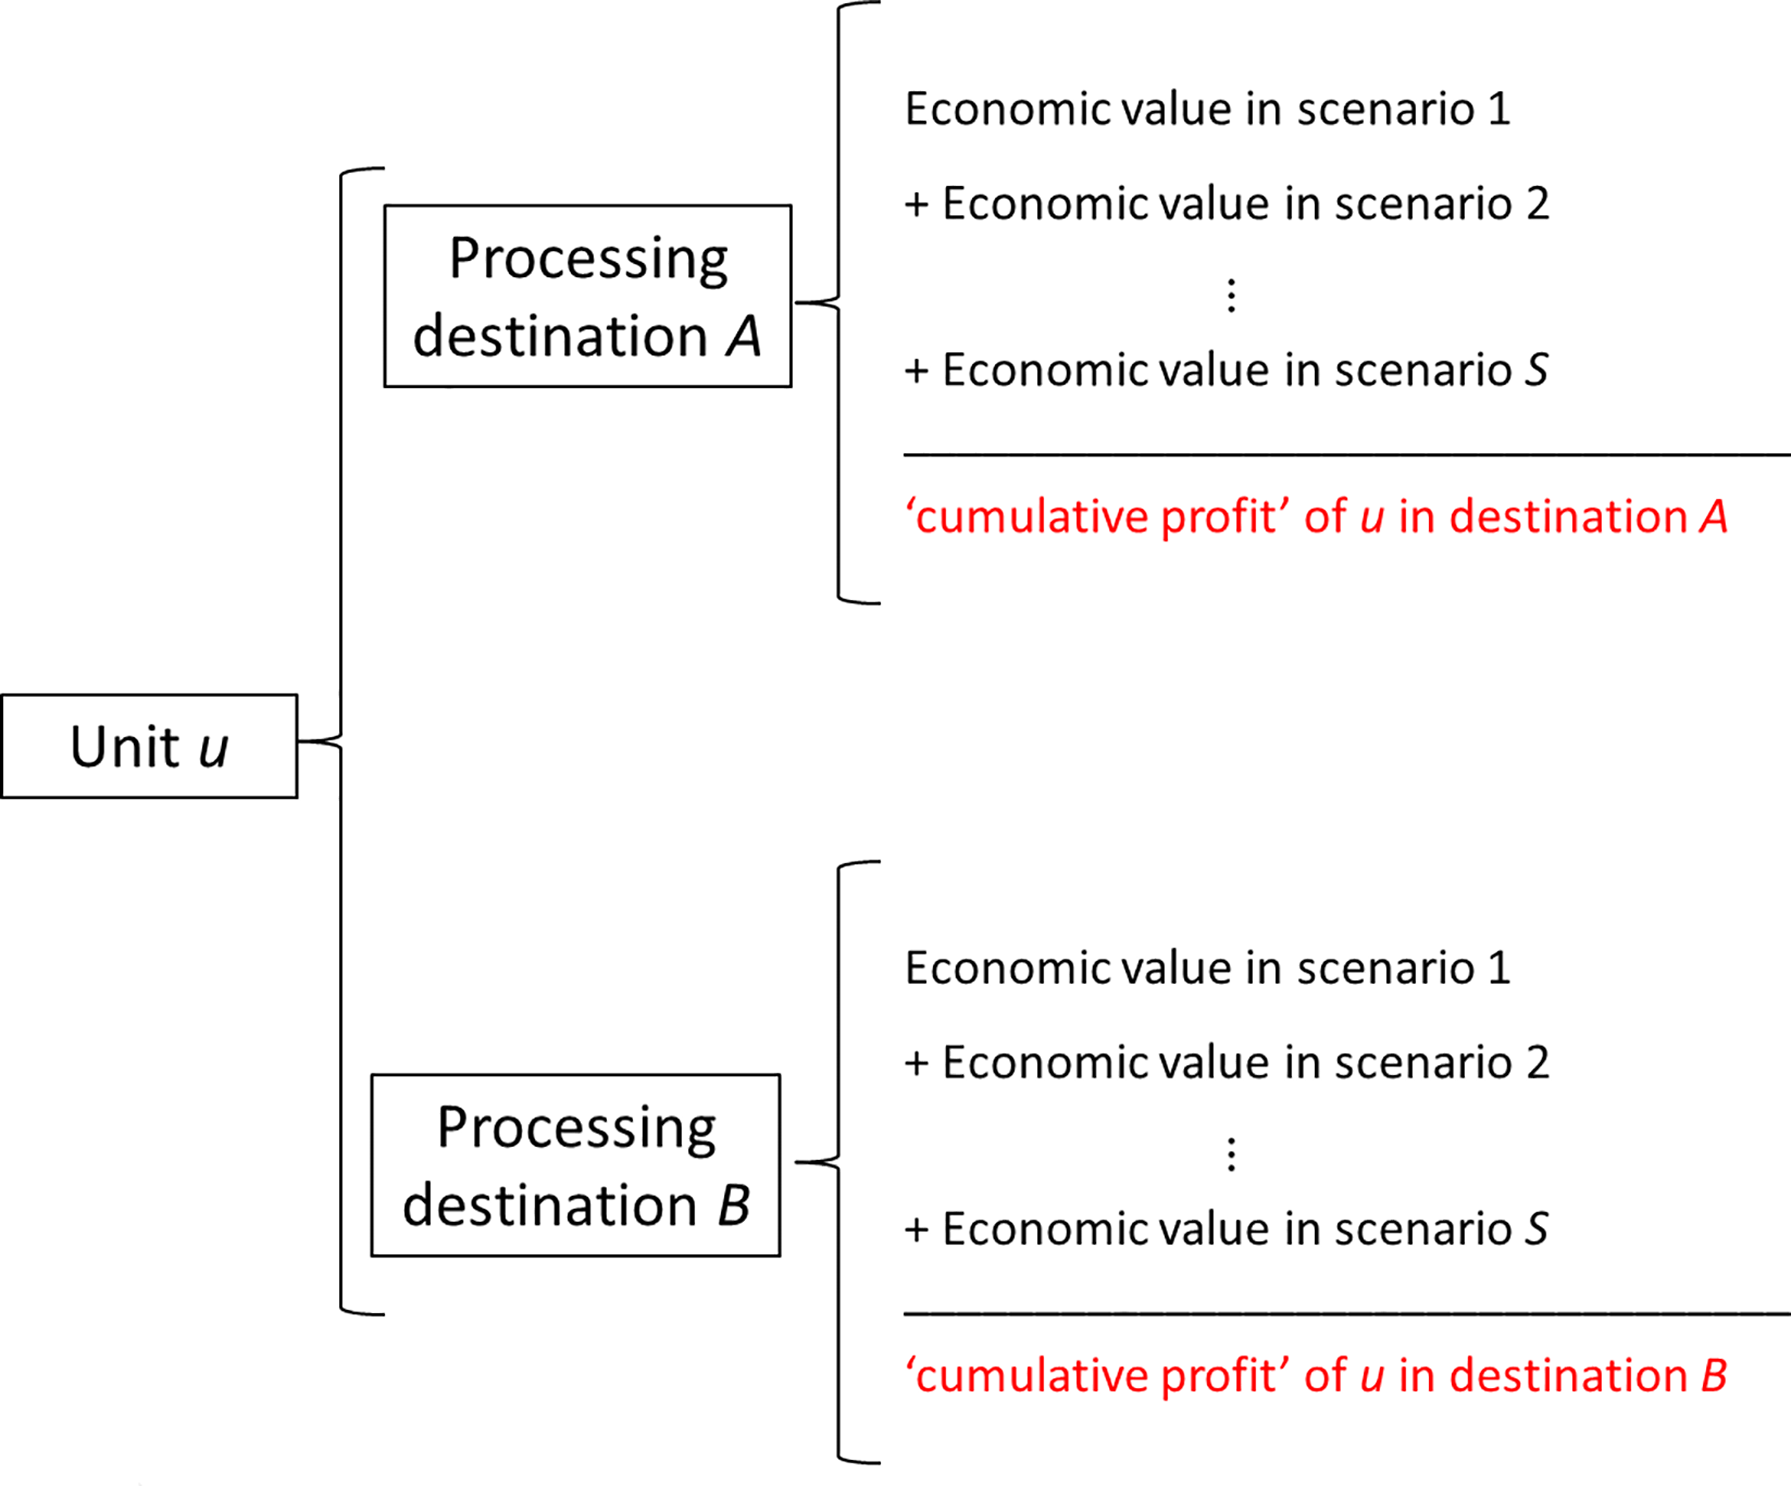
The method perturbs a solution at three different decision levels to improve the objective value: extraction unit-based perturbations, operating mode based perturbations and transportation based perturbations. For each unit u, it is possible to calculate the cumulative profit of u in every destination by accumulating the economic value in each scenario (Fig. 5). The cumulative profit provides a guidance of the most profitable destinations for a particular unit and controls the iterating process when swapping periods and destinations of a mining unit (Fig. 6). If the greatest cumulative profit of a unit is positive, extracting that unit in an earlier period will be favoured; otherwise, the iterating process will favour extracting the unit in a later period. The candidate destinations include the destinations with positive cumulative profit if the unit is profitable, or the less unprofitable destination in the opposite case.
Cumulative profit of a mining unit
Perturbation mechanism of mining units
The iteration process over the candidate periods and destinations of a mining unit is designed to increase the expected NPV given the time value of money. However, the objective value of the perturbed solution is also affected by the penalised deviations, therefore, there might be cases when pushing a profitable unit to a later period or an unprofitable one to an earlier period increases the objective value given the lower deviations in the new solution. In these cases, the objective function can be seen as trade-off between maximising the expected NPV and minimising the penalised deviations.
The perturbations at an operating decision level consist in swapping operating modes at different processing destinations towards improvements in the objective value. The perturbations at the transportation decision level consist in modifying the transportation proportions of the output material from different processing destinations; for example, changing the transportation of the output material from a mill from 50% trucks/50% pipeline to 70% trucks/30% pipeline. The transportation perturbation mechanism seeks for minimising transportation costs and deviations. At any level, perturbations are accepted or rejected using Equation (7) from the Metropolis algorithm (Metropolis et al.1953; Kirkpatrick et al.1983)

The method
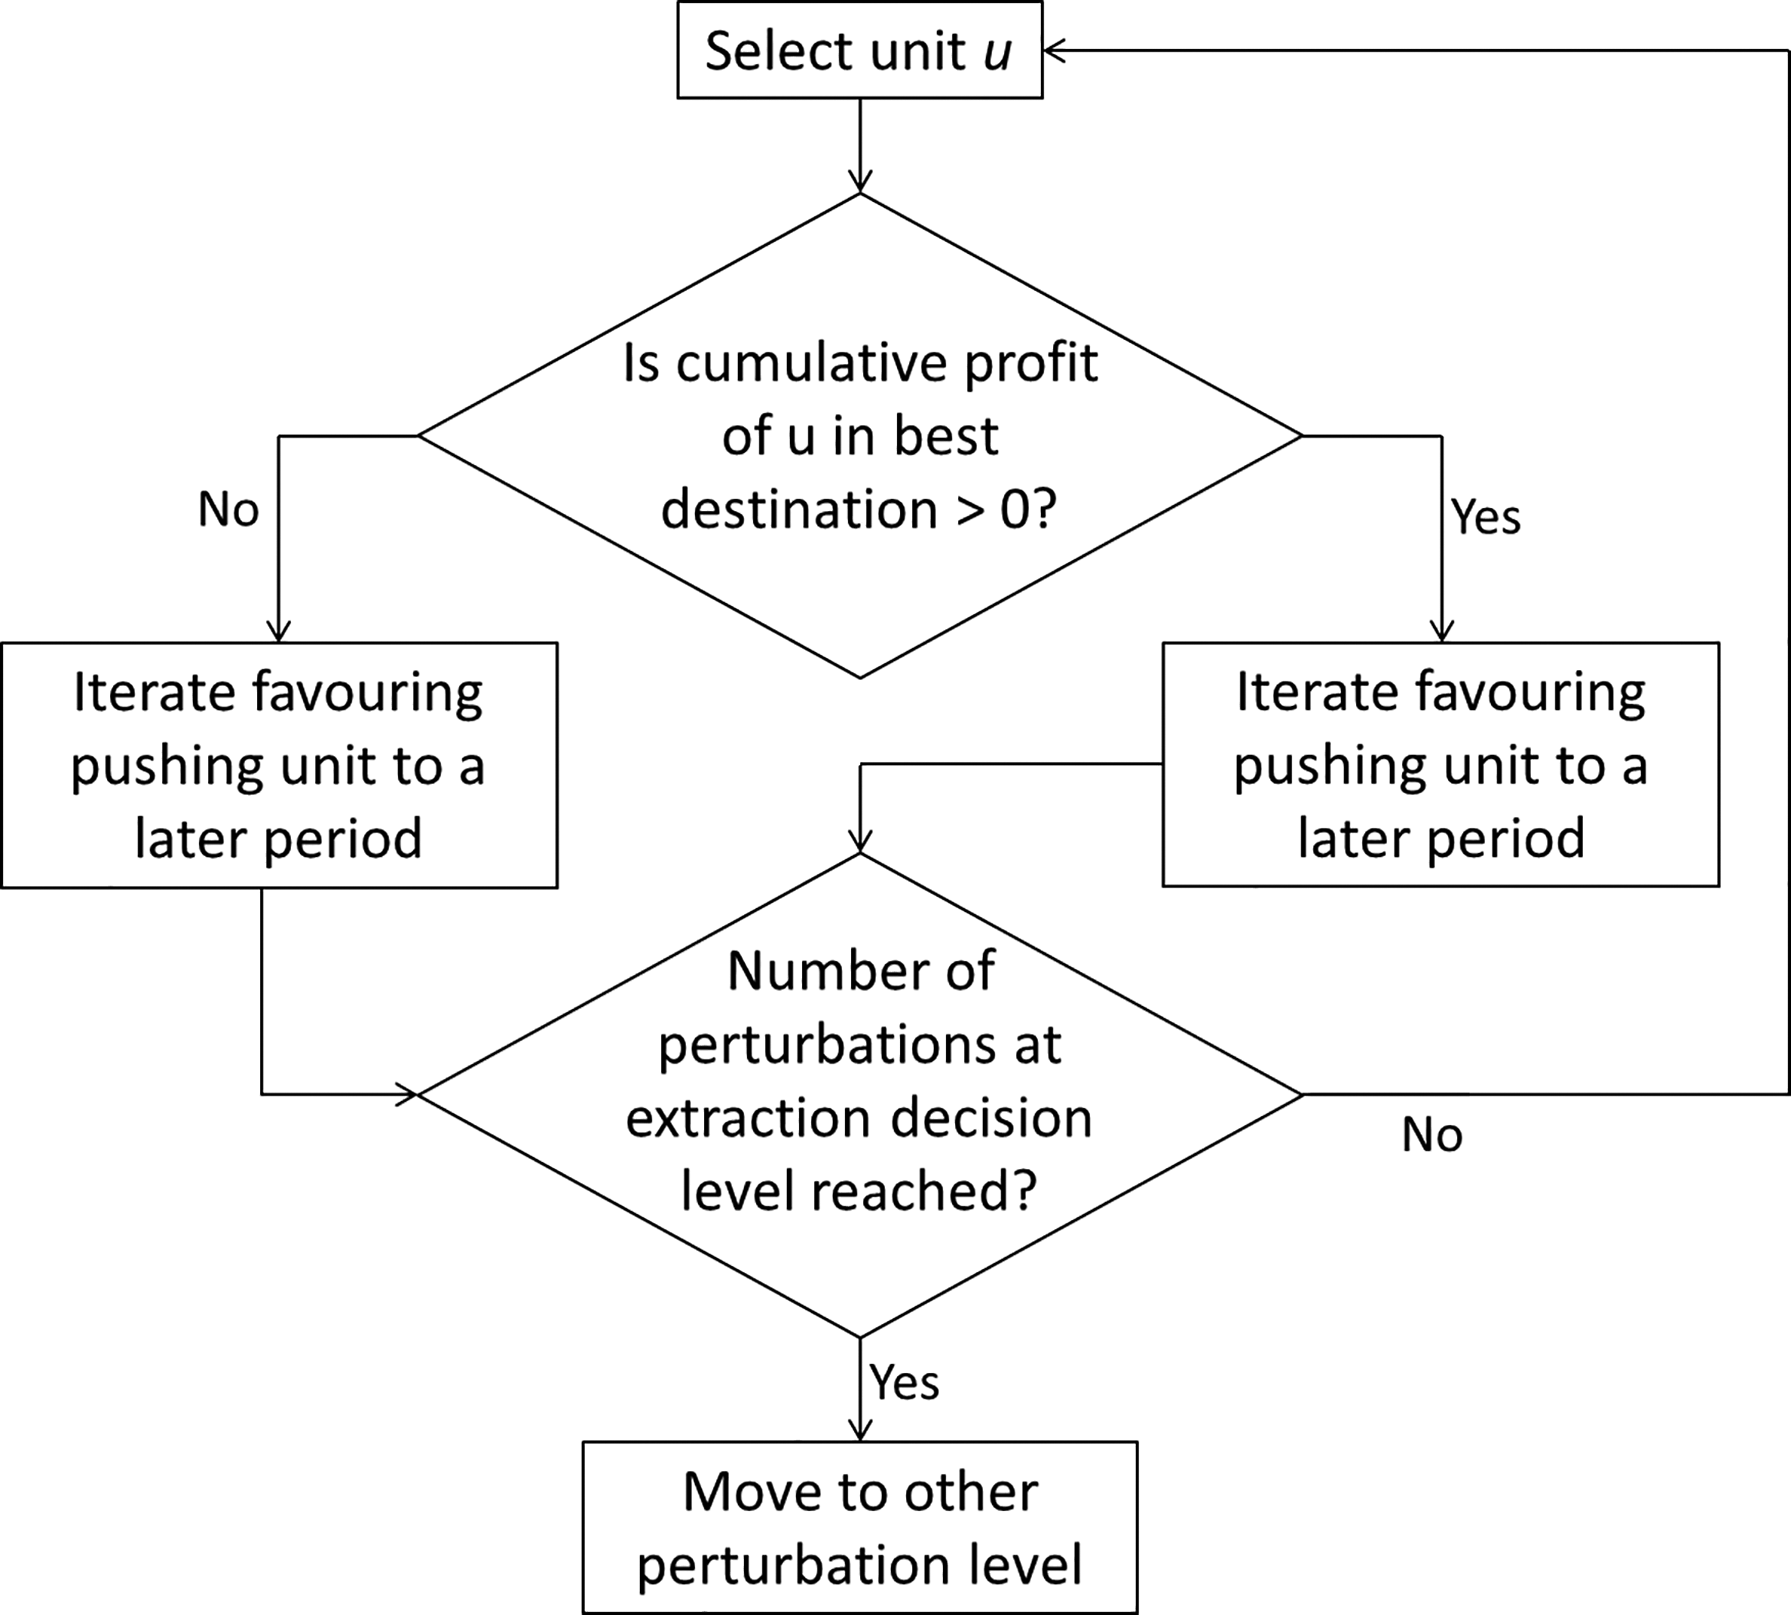
The method proposed to optimise a mining complex has three stages (Fig. 7). The first stage consists in assigning periods and destinations to the mining units from an initial solution. In the second stage, the method evaluates the profits, productions and deviations at different scenarios. It also evaluates the cumulative profit of the mining units at different destinations. The last stage is the perturbation mechanism at the three different decision levels. The algorithm stops when it reaches a user-specified number of iterations or poor improvement is presented in the objective value after a certain number of perturbations.
Stages of proposed method
Gold mining complex: one open-pit and one underground mine
Case study: A gold mining complex
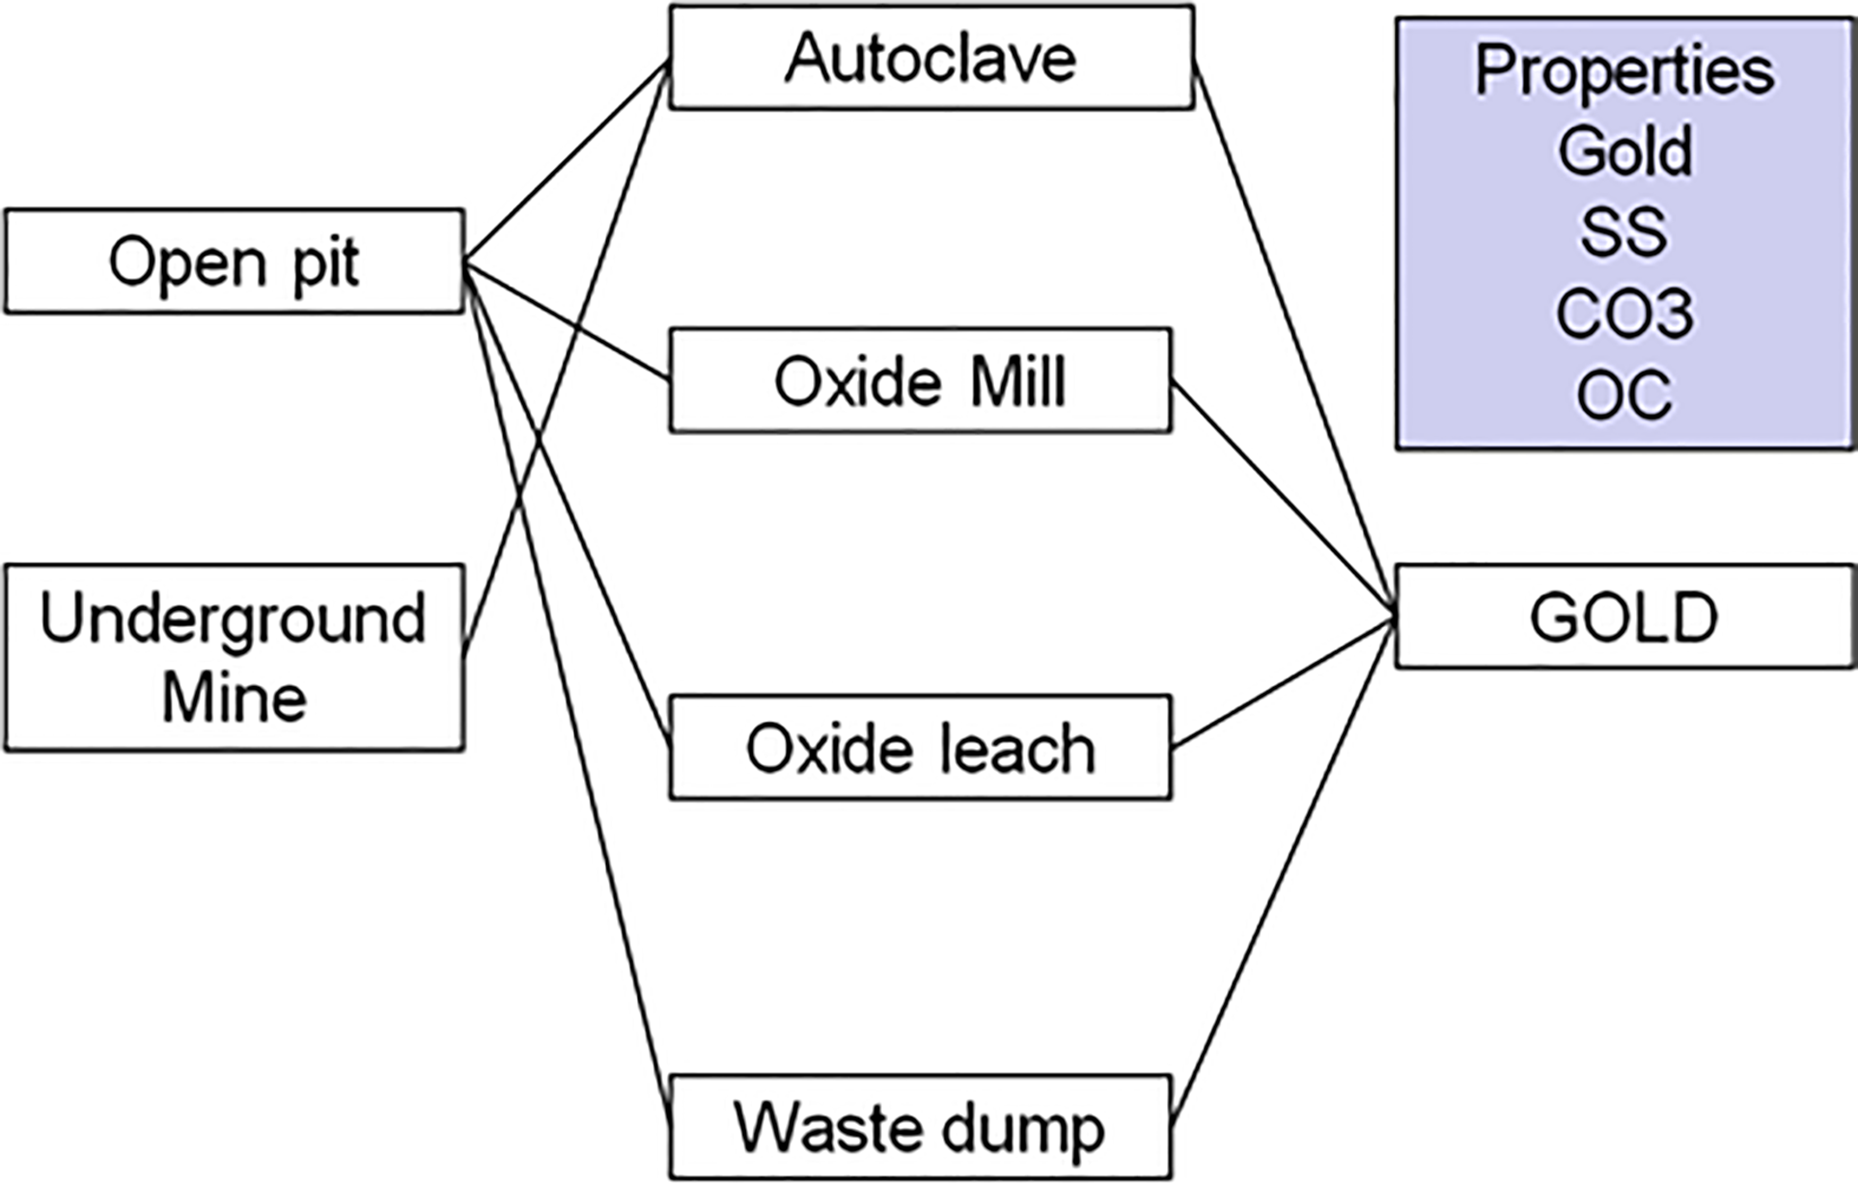
The method is implemented at a gold complex comprised of one open-pit and one underground mine (Fig. 8). Higher grade oxide ore is processed at a mill; lower grade is treated on heap leach pads. Refractory ore is processed at one autoclave. The open-pit provides both oxide and refractory ore, whereas the underground mine just provides refractory ore for the autoclave.
Twenty orebody simulations for gold, sulphide sulphur, CO3 and organic carbon are provided for the open-pit. The higher concentrations of gold are located in the north-east part of the deposit where the current mining phases are located (Fig. 9). The gold and sulphide sulphur grades are controlled by the mineralised domains, whereas the carbonate and organic carbon are spread in all the areas of the deposit. The underground mine uses underhand-cut-and-fill because of the relatively low rock quality in the ore zones. Intensity of gold mineralisation is related to structural complexity and the location of rocks chemically receptive to mineralisation. The production zones are located in the high grade areas (Fig. 10).
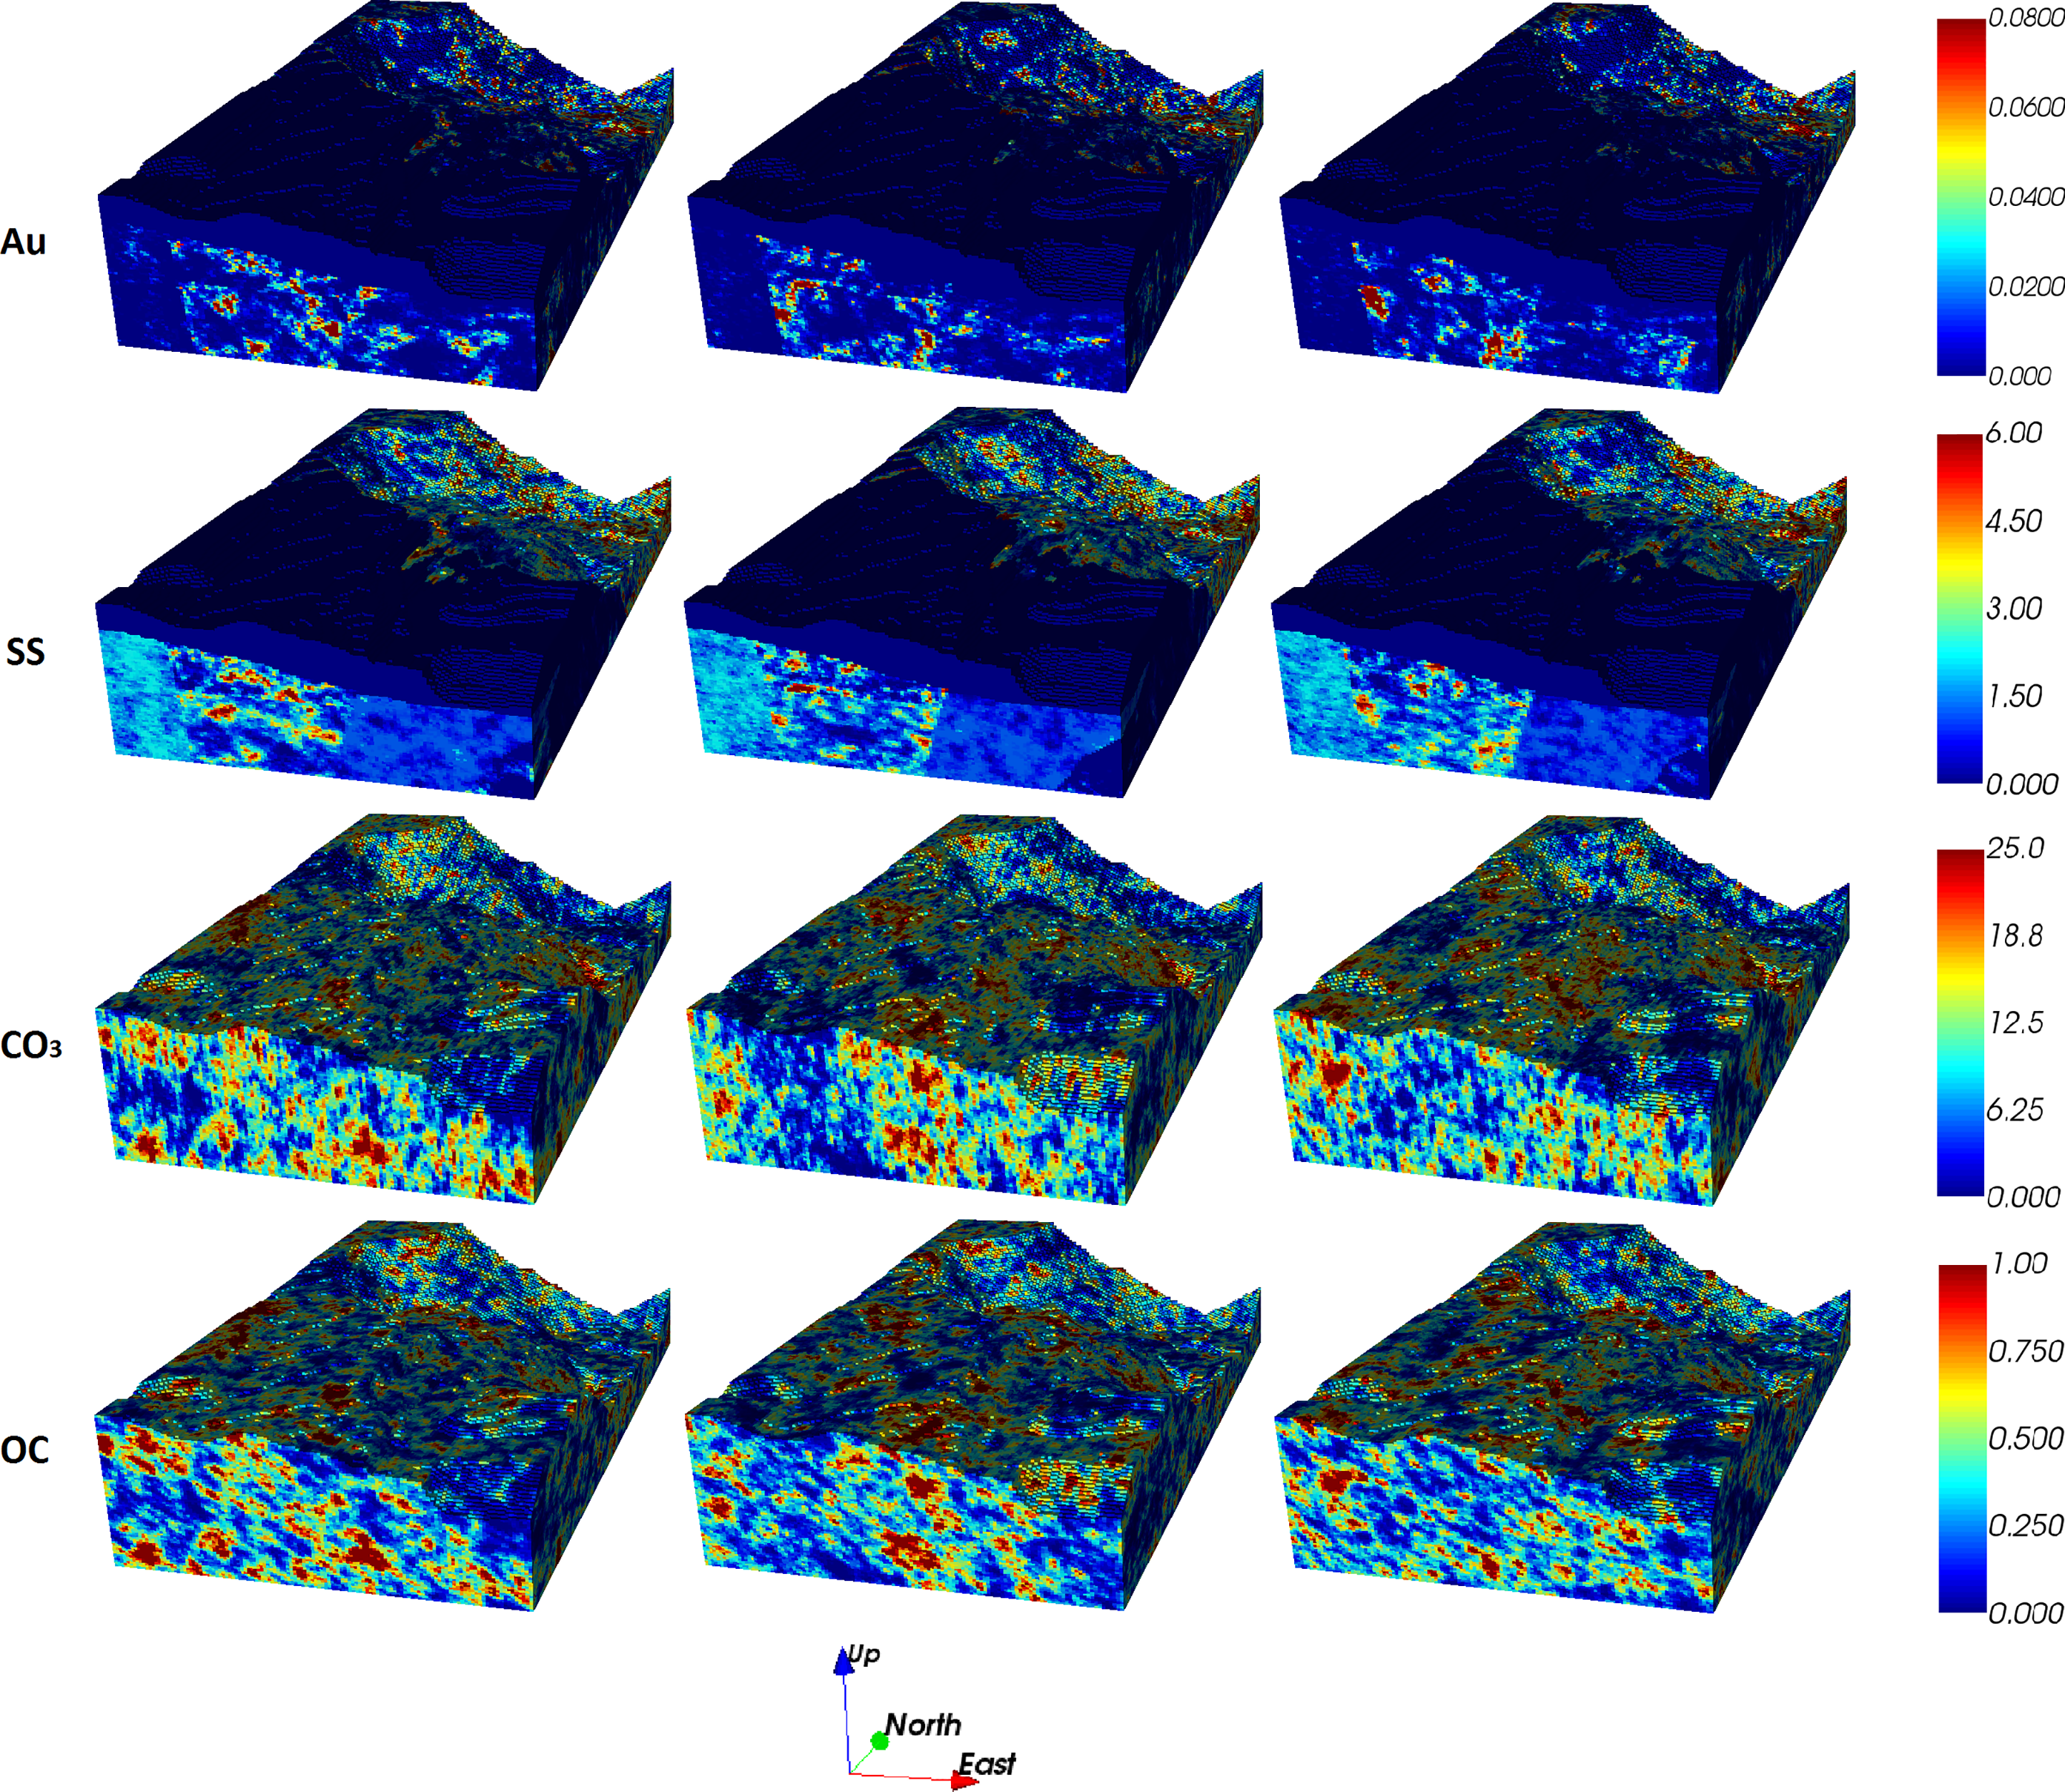
Three orebody simulations of the open-pit
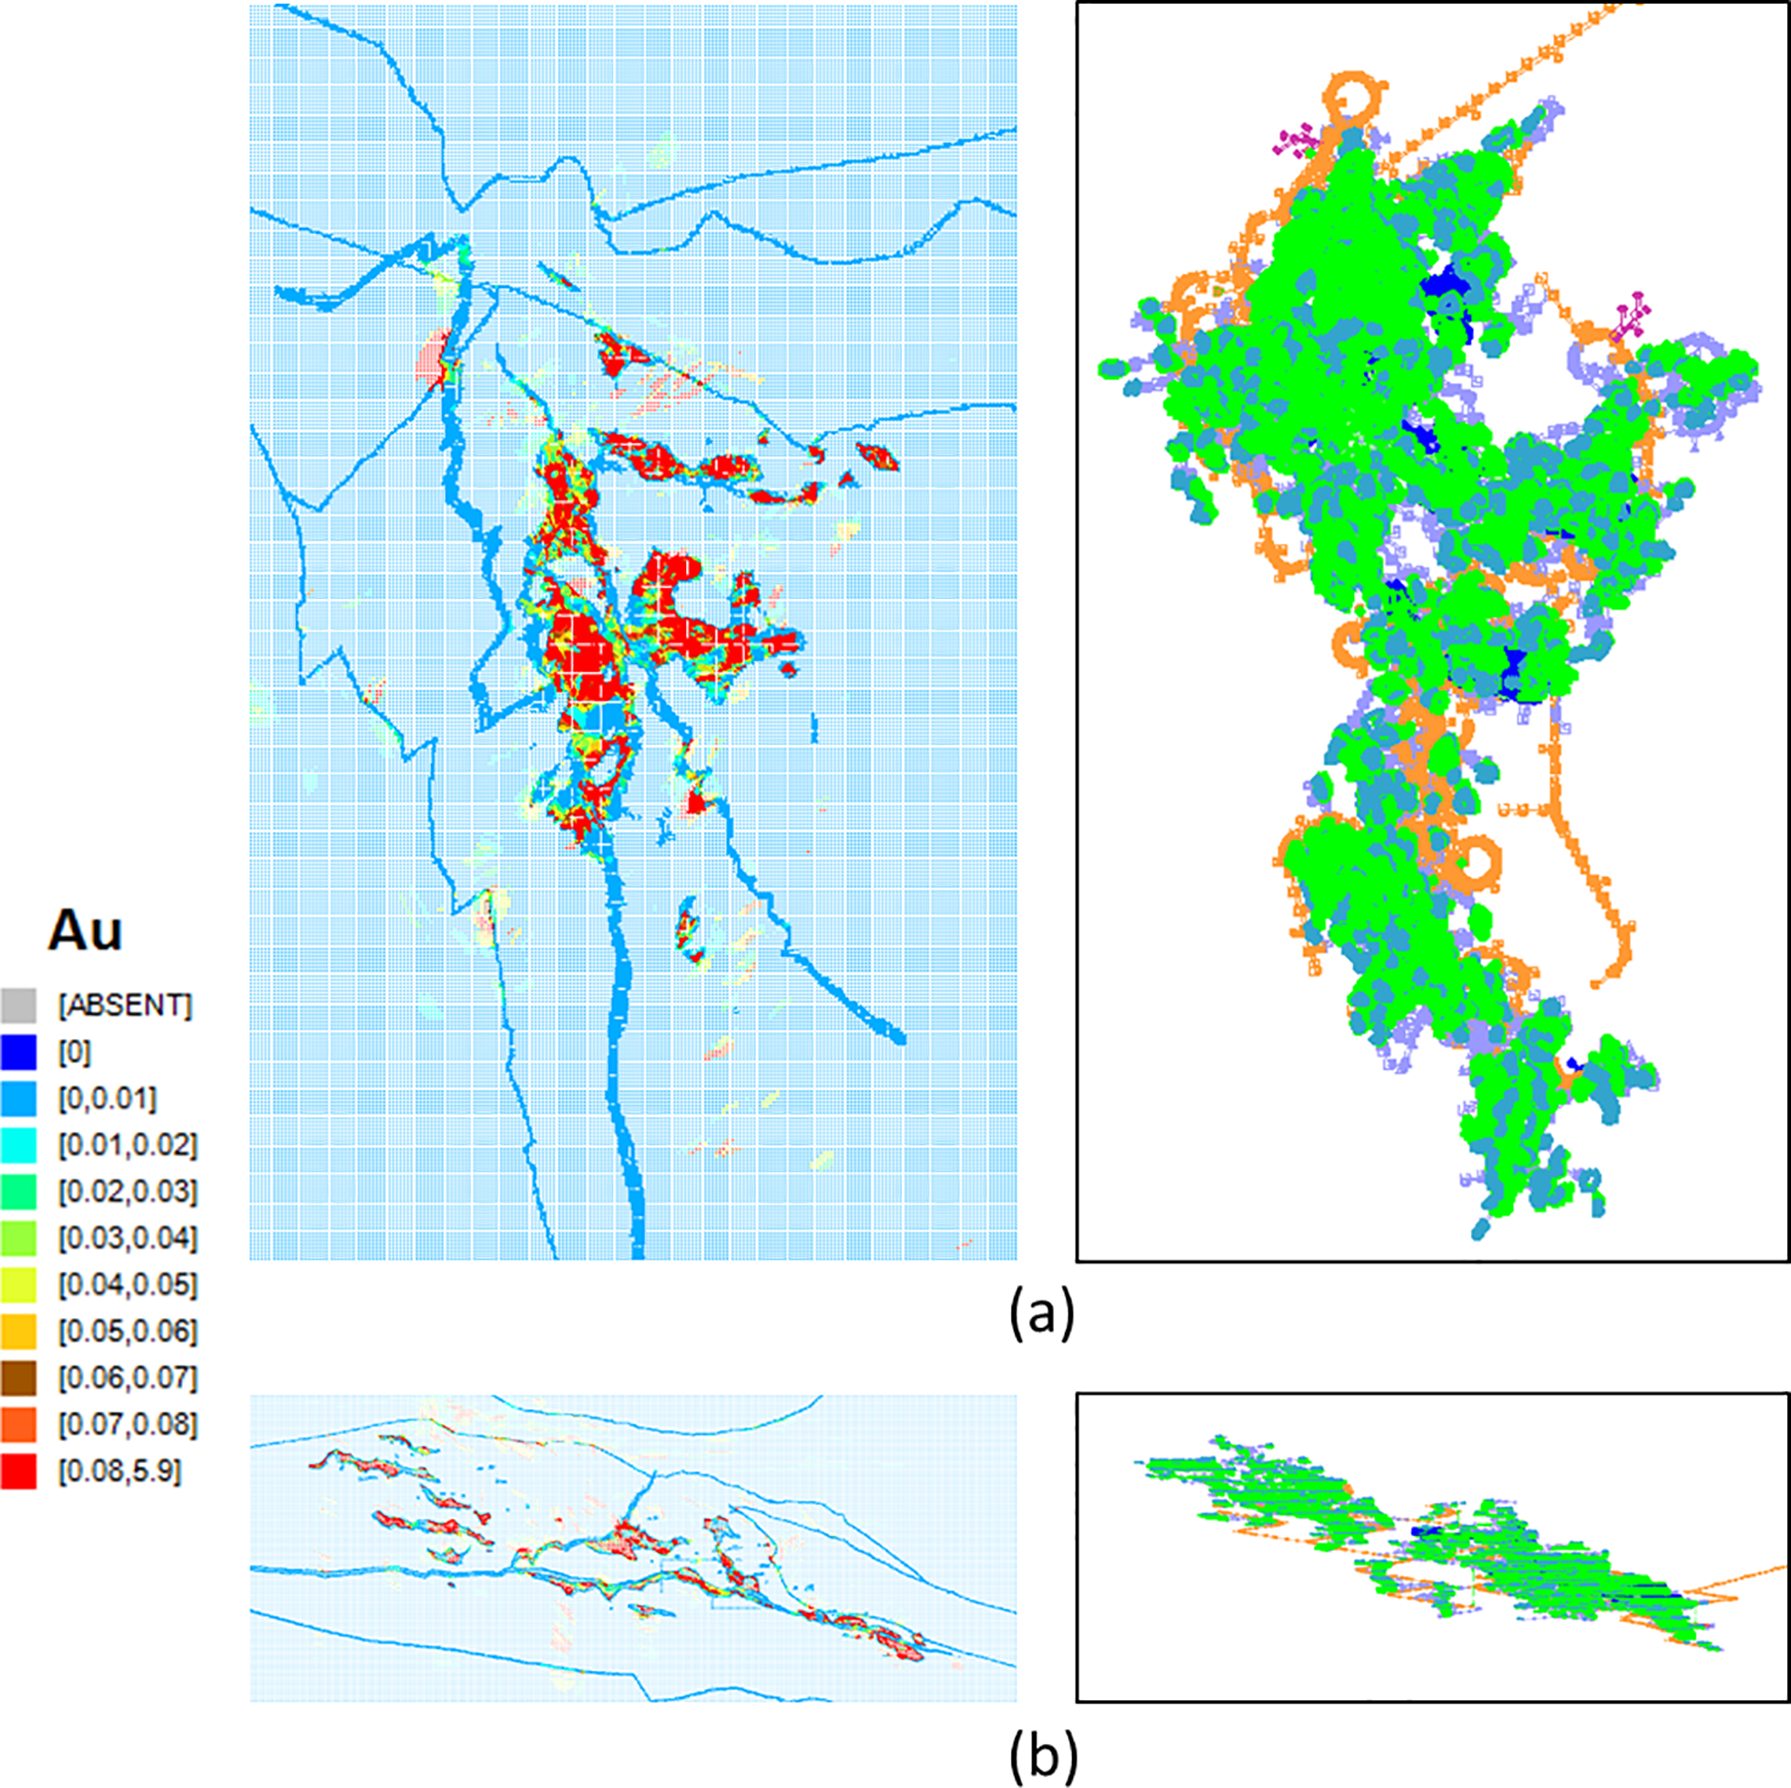
Gold grades (left) and production zones (right) in the underground mine: a plan view and b south–north view
Twenty orebody simulations are generated for the underground deposit using direct block simulation by considering the drillhole data within the mineralised domain (Godoy 2003). Figure 11 shows the validation of the orebody simulations generated. It can be observed that the simulations respect the statistics of the drillhole data as they reproduce its histograms and variograms at the main directions of anisotropy. The simulated values at each unit are calculated by averaging the simulated points that fall inside; that is, given the different shapes and sizes of the underground mining units, there is no single support size as in the open-pits where the mining blocks have the same size. Figure 12 shows three different orebody simulations and the production zones of the mine. The autoclave has tight operating ranges for SS/CO3, SS, CO3 and organic carbon. To help metallurgical blending, concentrates from other plants are added to the process (Fig. 13).
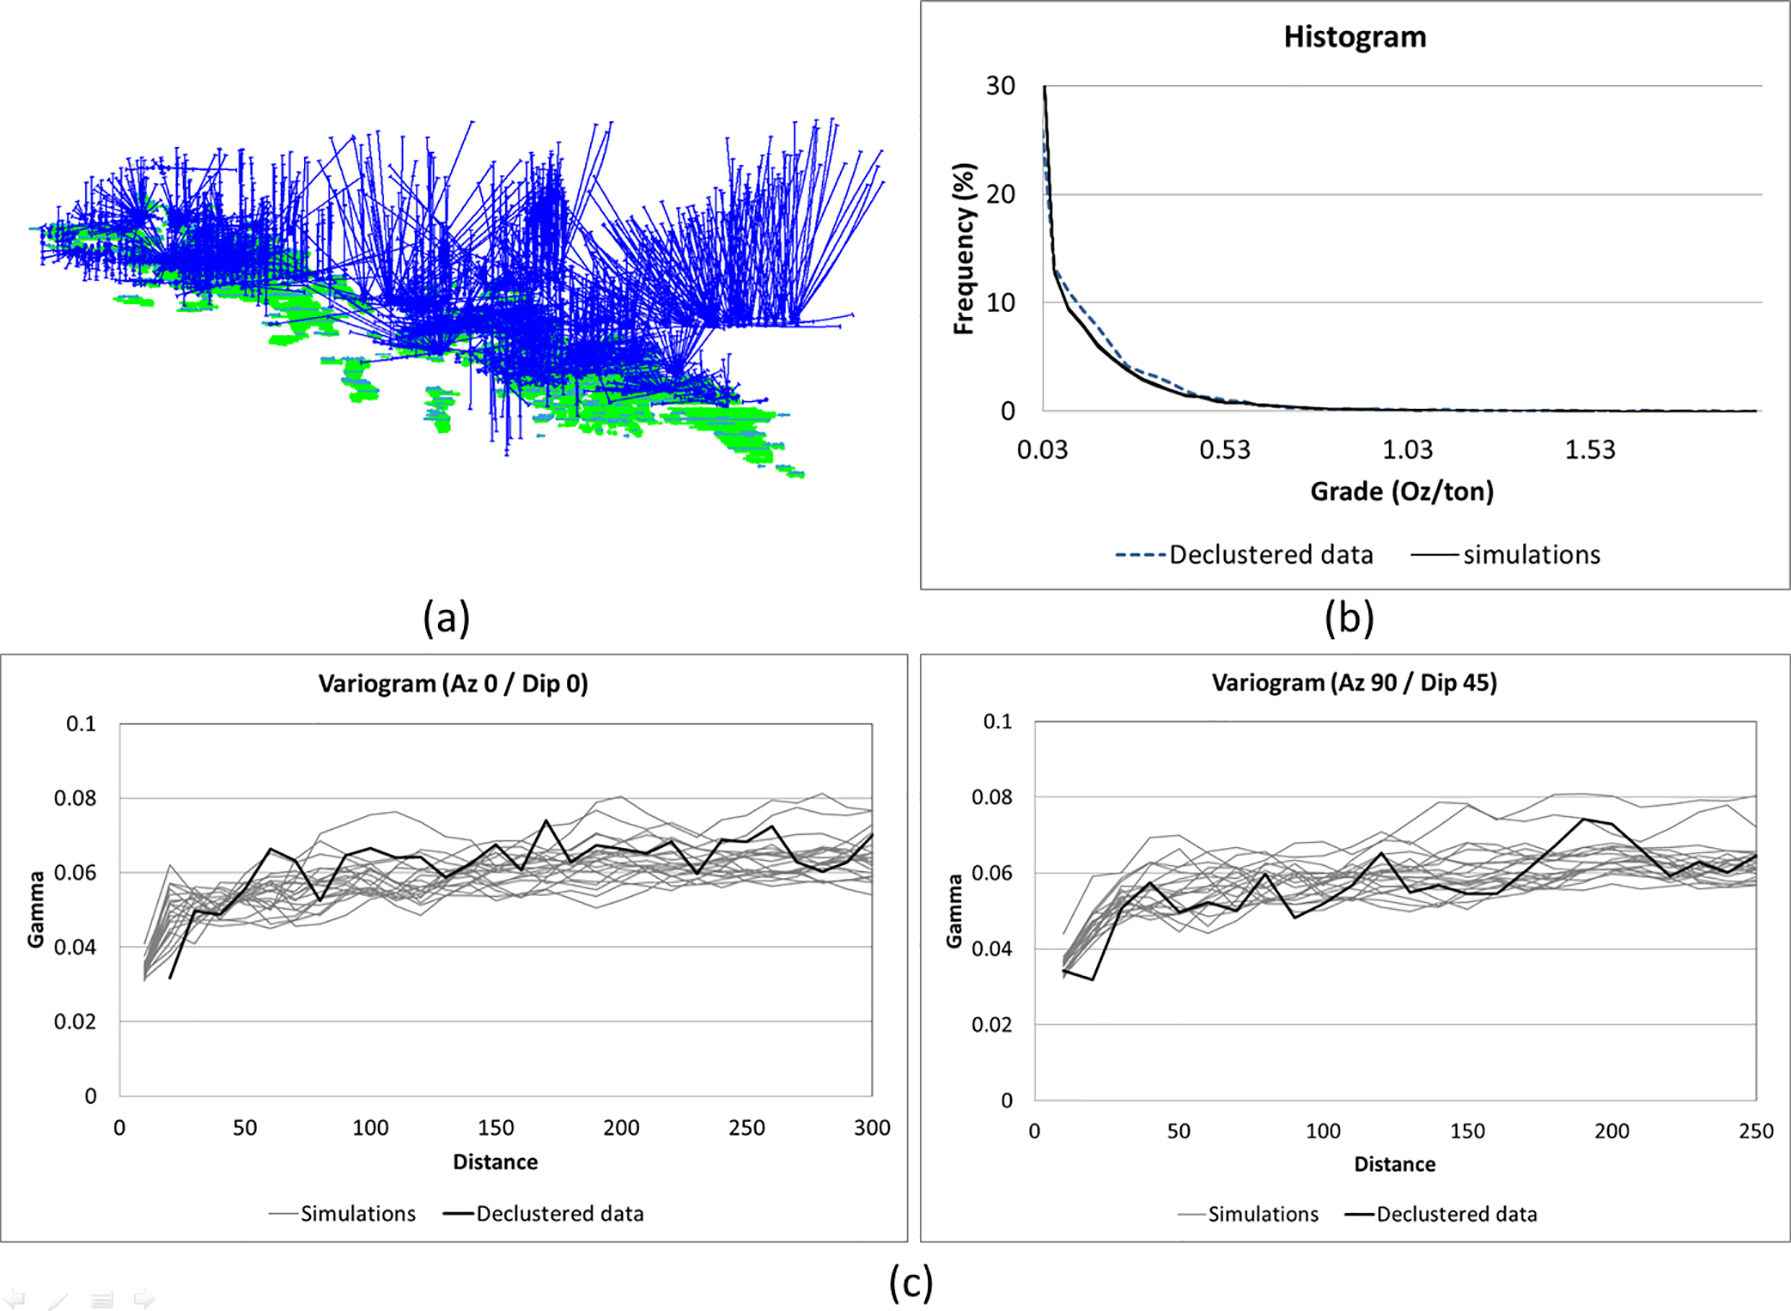
Validation of the simulations in the underground mine: a drillhole data; b histogram reproduction; c variogram reproduction
Orebody simulations and production zones of underground mine
Sources and blending properties in the autoclave
In the three processing destinations, the metallurgical recovery of gold follows non-linear curves. In the autoclave, the recovery curve is a function of the gold grades and the organic carbon, whereas in the oxide mill and the heap leaching plant, the recovery is a function of gold grades only.
Initial solution
An initial solution for the optimisation of the gold complex was generated by: (i) considering the current mining plan in the underground mine that was developed by the mine planners using Enhanced Production Scheduler (EPS) software; (ii) using Milawa scheduler in Whittle software for the open-pit using the average grades of the mining blocks at different simulated realisations.
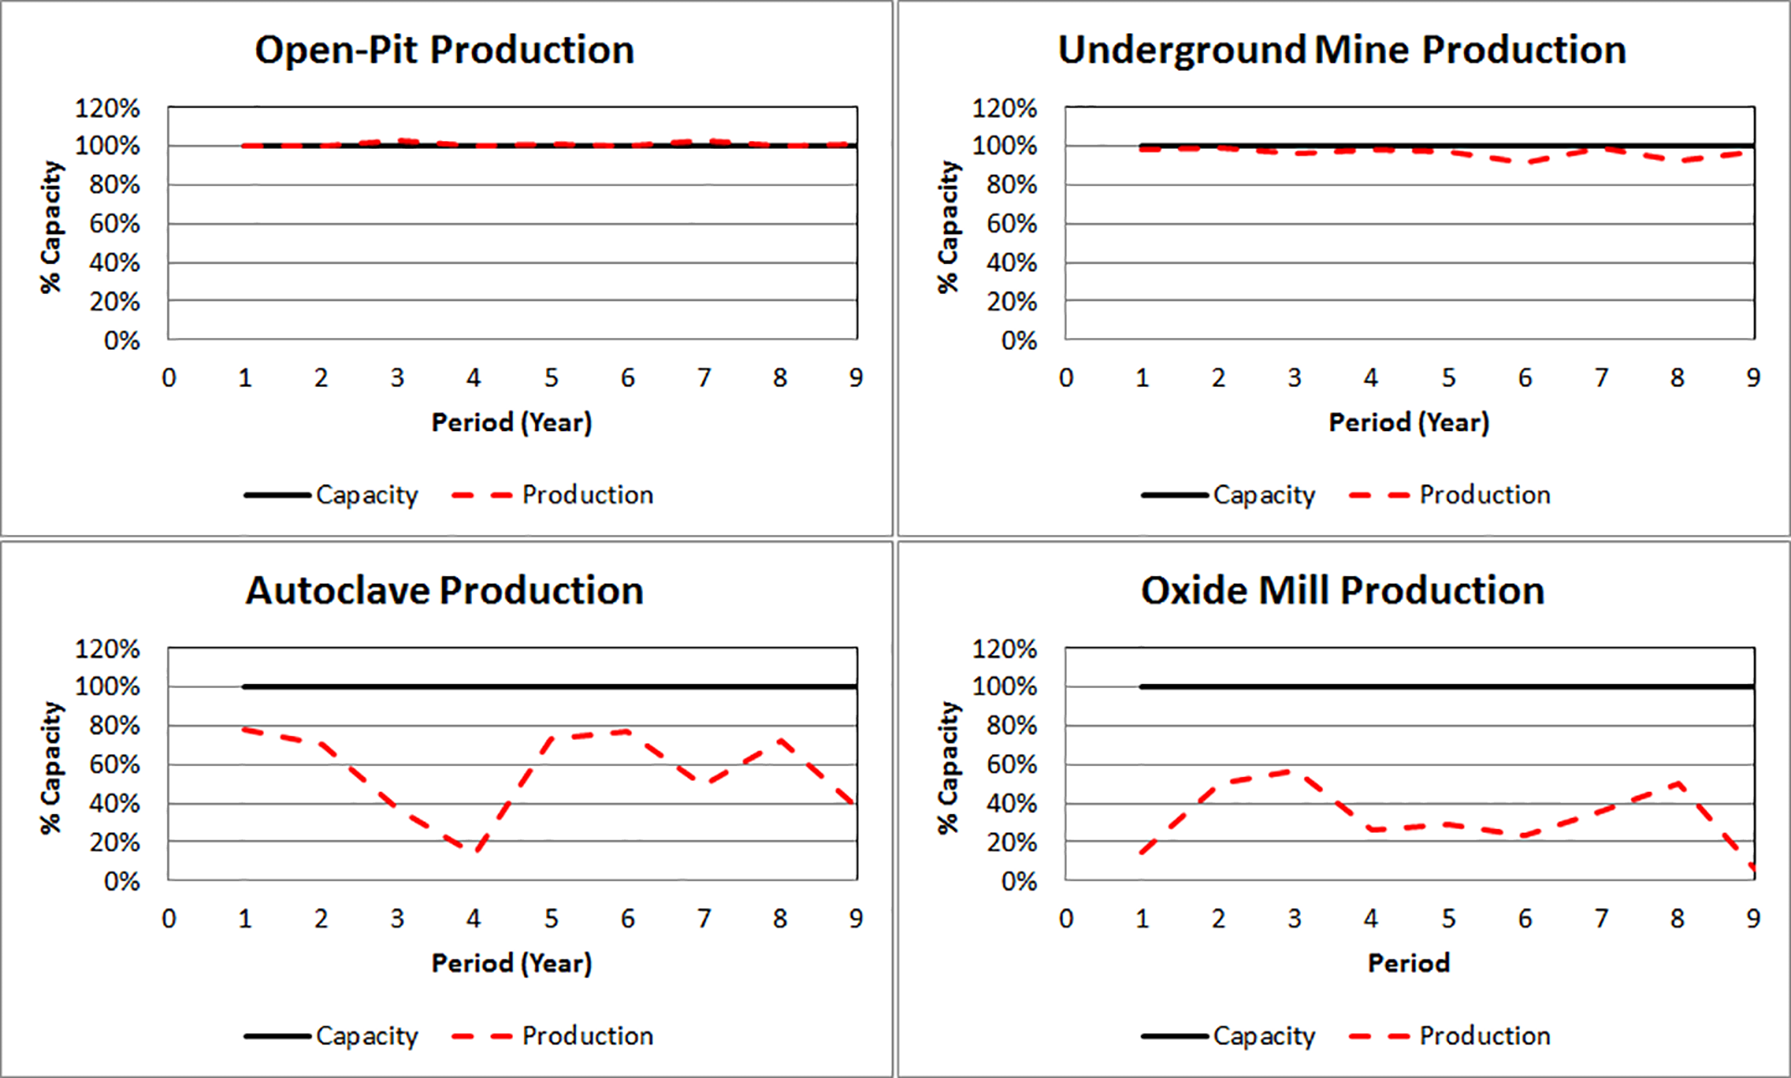
The amount of external blending material used in the autoclave is considered when evaluating the results of the implementation of the initial solution over different scenarios (combinations of orebody simulations of both deposits). The productions of the two mines, the autoclave and the oxide mill, are shown in Fig. 14. It can be observed that the underground mine operates below the capacity, whereas the open-pit operates very close to its capacity until the depletion of the reserves. Although external blending material is added to the autoclave, given the tight blending constraints imposed to this processing destination, the conventional scheduler can only find blended material to fill the capacity in three periods of the life of the mine (LOM). There is a big shortfall in production in the autoclave in year 4, and after year 9, the tonnage sent to this processing destination is very marginal. Regarding the oxide mill, the production is going to be close to the capacity in years 2–4 but deficient production is observed in the rest of the periods of the LOM. However, most of the oxide ore filled to this processing destination comes from another pit that is not considered in this study. The SS is below the operational ranges in most of the years, whereas the SS/CO3 ratio falls below the operational ranges in the last years (Fig. 15). The CO3 increases with time and falls inside the operational ranges in most of the years. The organic carbon is well controlled in all the different scenarios.
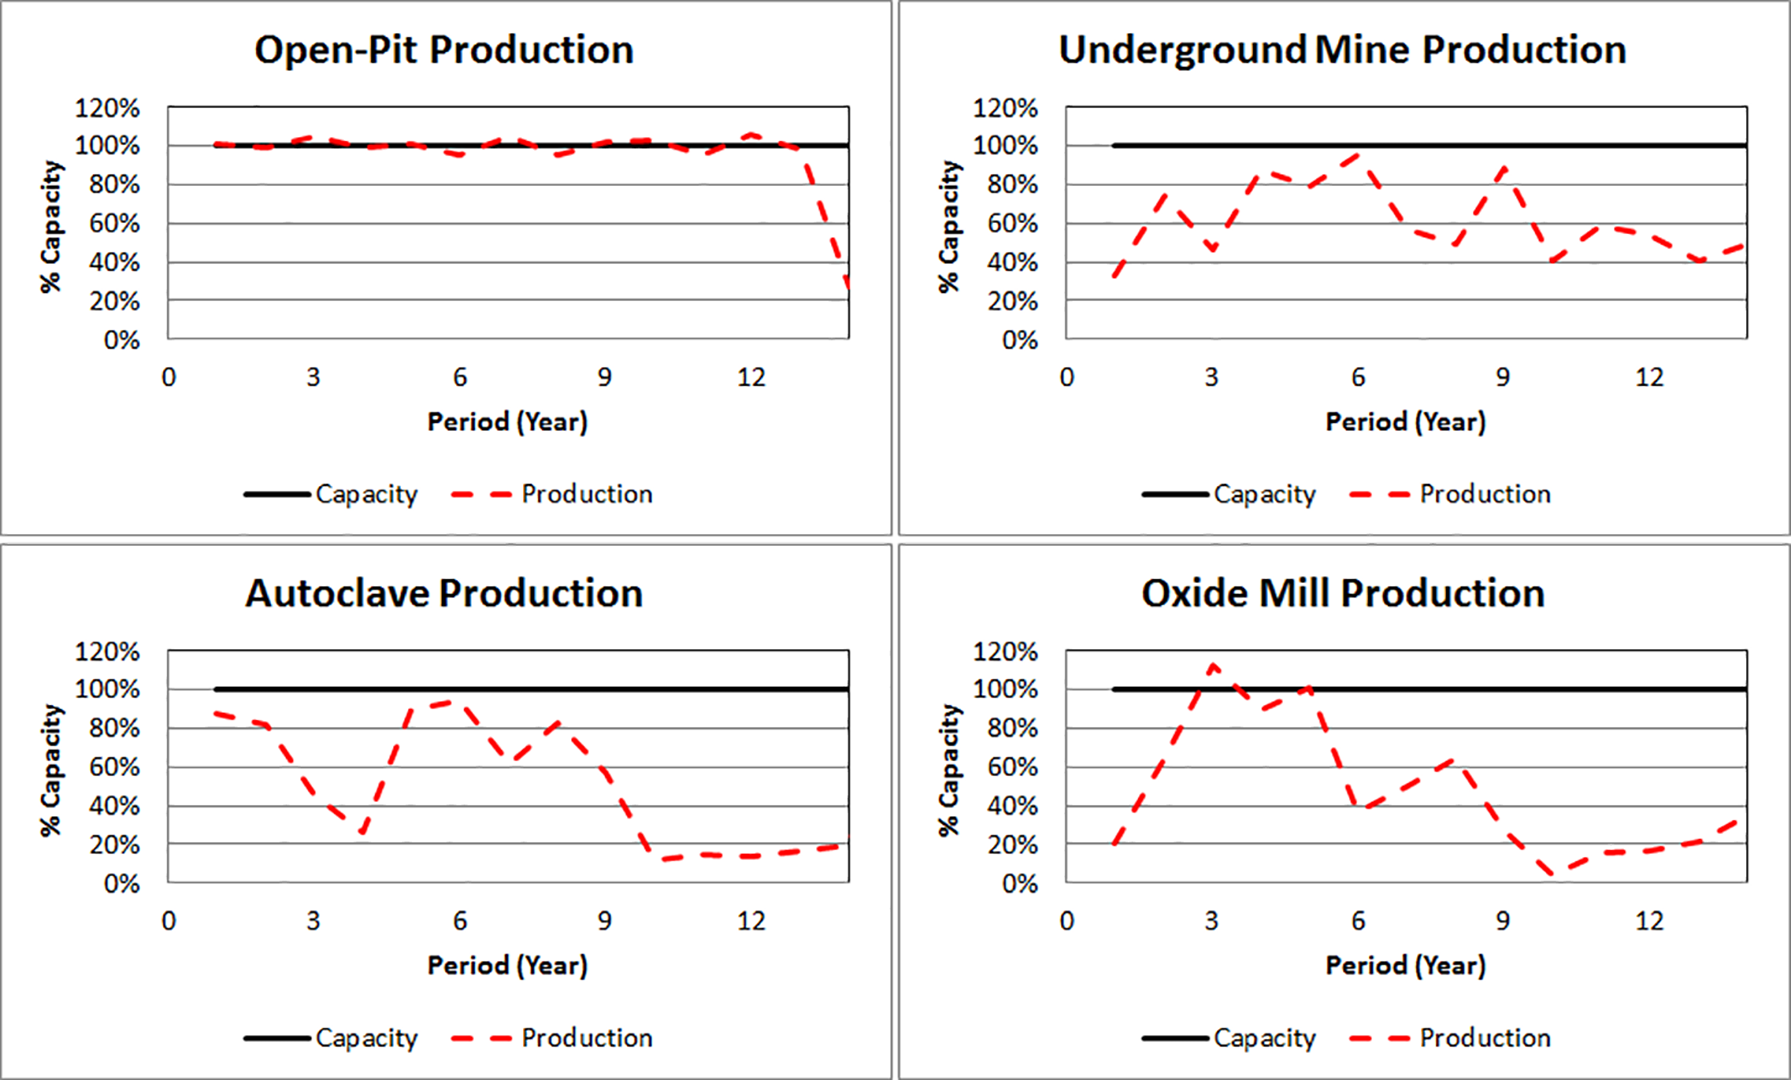
Production of the open-pit, underground mine, autoclave and oxide mill with the initial solution
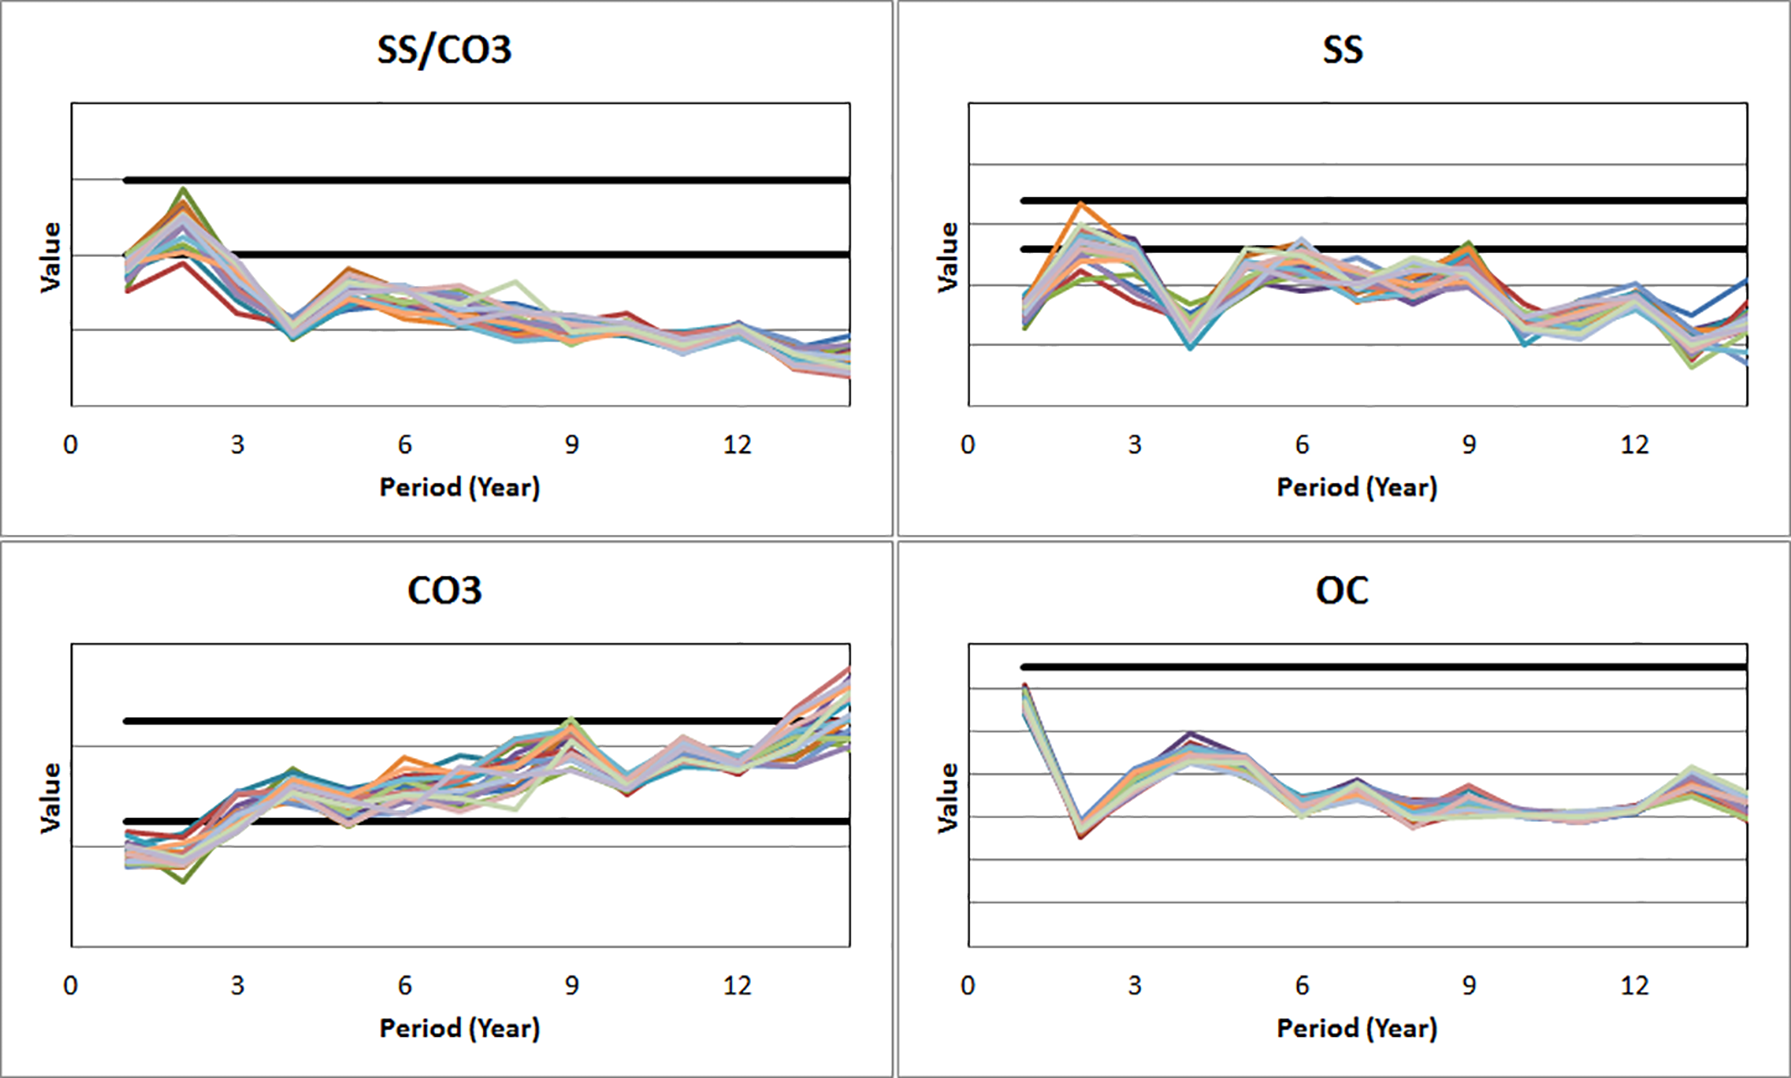
SS/CO3 ratio, SS, CO3 and organic carbon with the initial solution
The risk profile of the NPV is displayed in Fig. 16, where P10, P50 and P90 are the tenth, fiftieth and ninetieth percentiles, respectively. It is observed that after year 9 the cumulative NPV starts to decrease given the marginal tonnage sent to the autoclave. It will be more profitable to stop the operation after year 9. However, there is another pit that is not considered in this study, which can add more years of profitable operation.
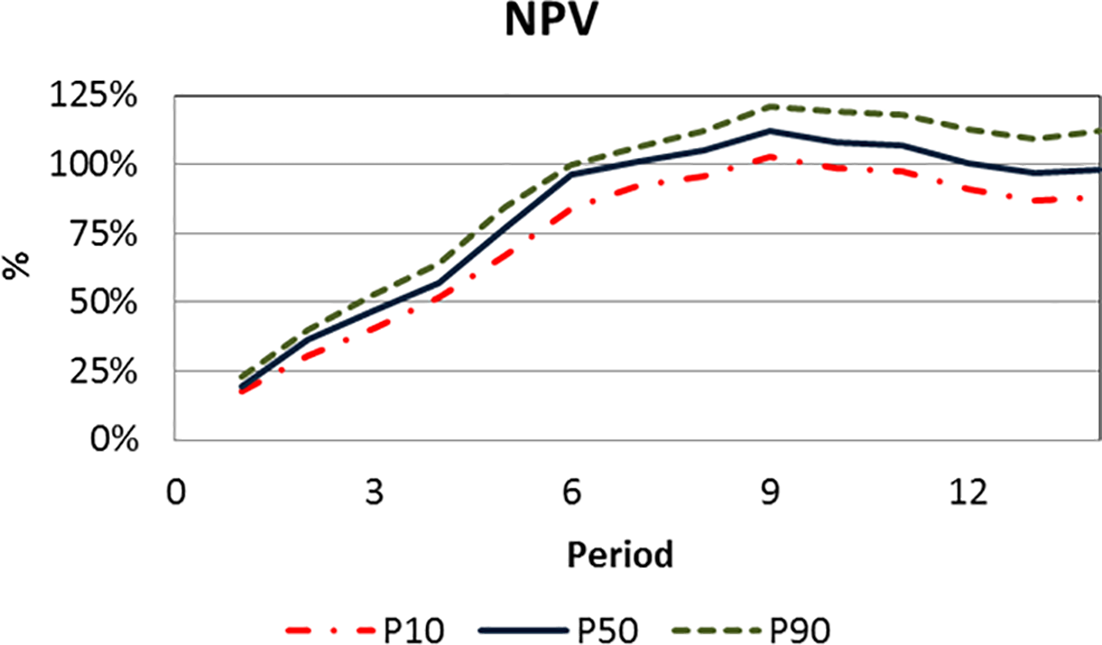
NPV with the initial solution and its risk profile
Optimisation parameters
Different tests are performed to define the optimisation parameters that lead to the largest improvement of the objective value. Different initial temperatures, reducing factors and number of perturbations were evaluated. Figure 17 shows the evolution of the objective value with the number of perturbations for six different initial temperatures. The largest improvement in the objective value is obtained with an initial temperature of the order of 1 million. Other important parameters to define are the per-unit penalty values associated with the targets at different components. The magnitude of the penalties must be defined so as to balance the two terms of the objective function. Too high penalty values will improve the reproduction of the targets ignoring the first term of the objective function generating poor improvement of expected NPV. Conversely, too small penalty values will generate impractical solutions with large and non-realistic NPV forecasts given the large violations of the targets.
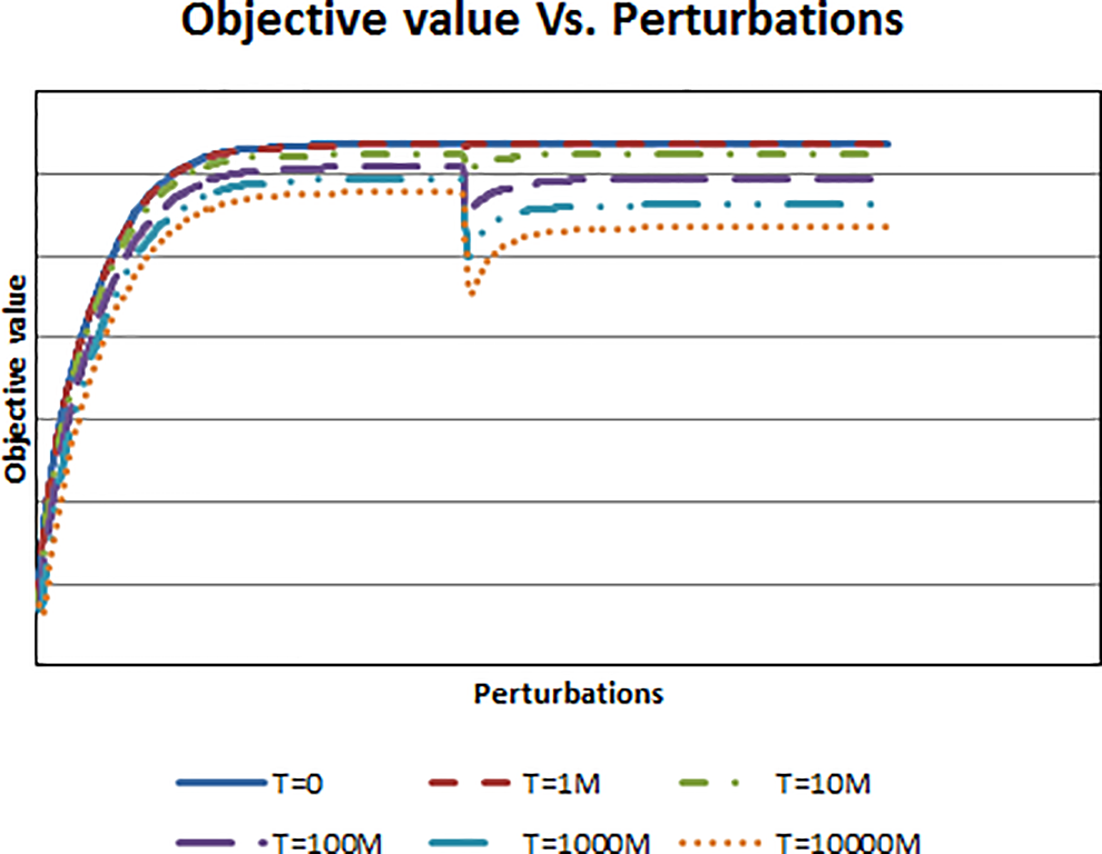
Evolution of the objective value with different temperatures
Stochastic solution
The method is next implemented after setting up the optimisation parameters. The stochastic solution prioritises the extraction of underground material close to the capacity of the underground mine (Fig. 18). The open-pit will also produce close to its capacity along the different years. Even though the open-pit and the underground mine will produce very close to their capacities, the solution presents large shortfalls regarding the capacity of the autoclave. This is originated from the very tight constraints associated with the autoclave regarding SS, CO3, OC and SS/CO3 ratio. As the sulphide ore in the orebody simulations has low SS and high CO3, there is no blending strategy that guarantees feeding the autoclave full capacity with the required quality.
Production of the open-pit, underground mine, autoclave and oxide mill with the stochastic solution
The gold complex has a set of stockpiles that contain material extracted from previous years. A large portion of the material presented in the stockpiles has high SS that helps in the blending operation. The method is now implemented considering the set of initial stockpiles from where material can be reclaimed in order to meet the blending requirements.
The new solution is able to feed the capacity of the autoclave along different production years (Fig. 19). Both mines will operate very close to the capacity along different years except for the third year where there will be a shortfall in the production of the underground mine. Given the capability of the method to blend material from the mines and the initial stockpiles, the new solution obtained guarantees feeding the autoclave while respecting the blending requirements (Fig. 20).
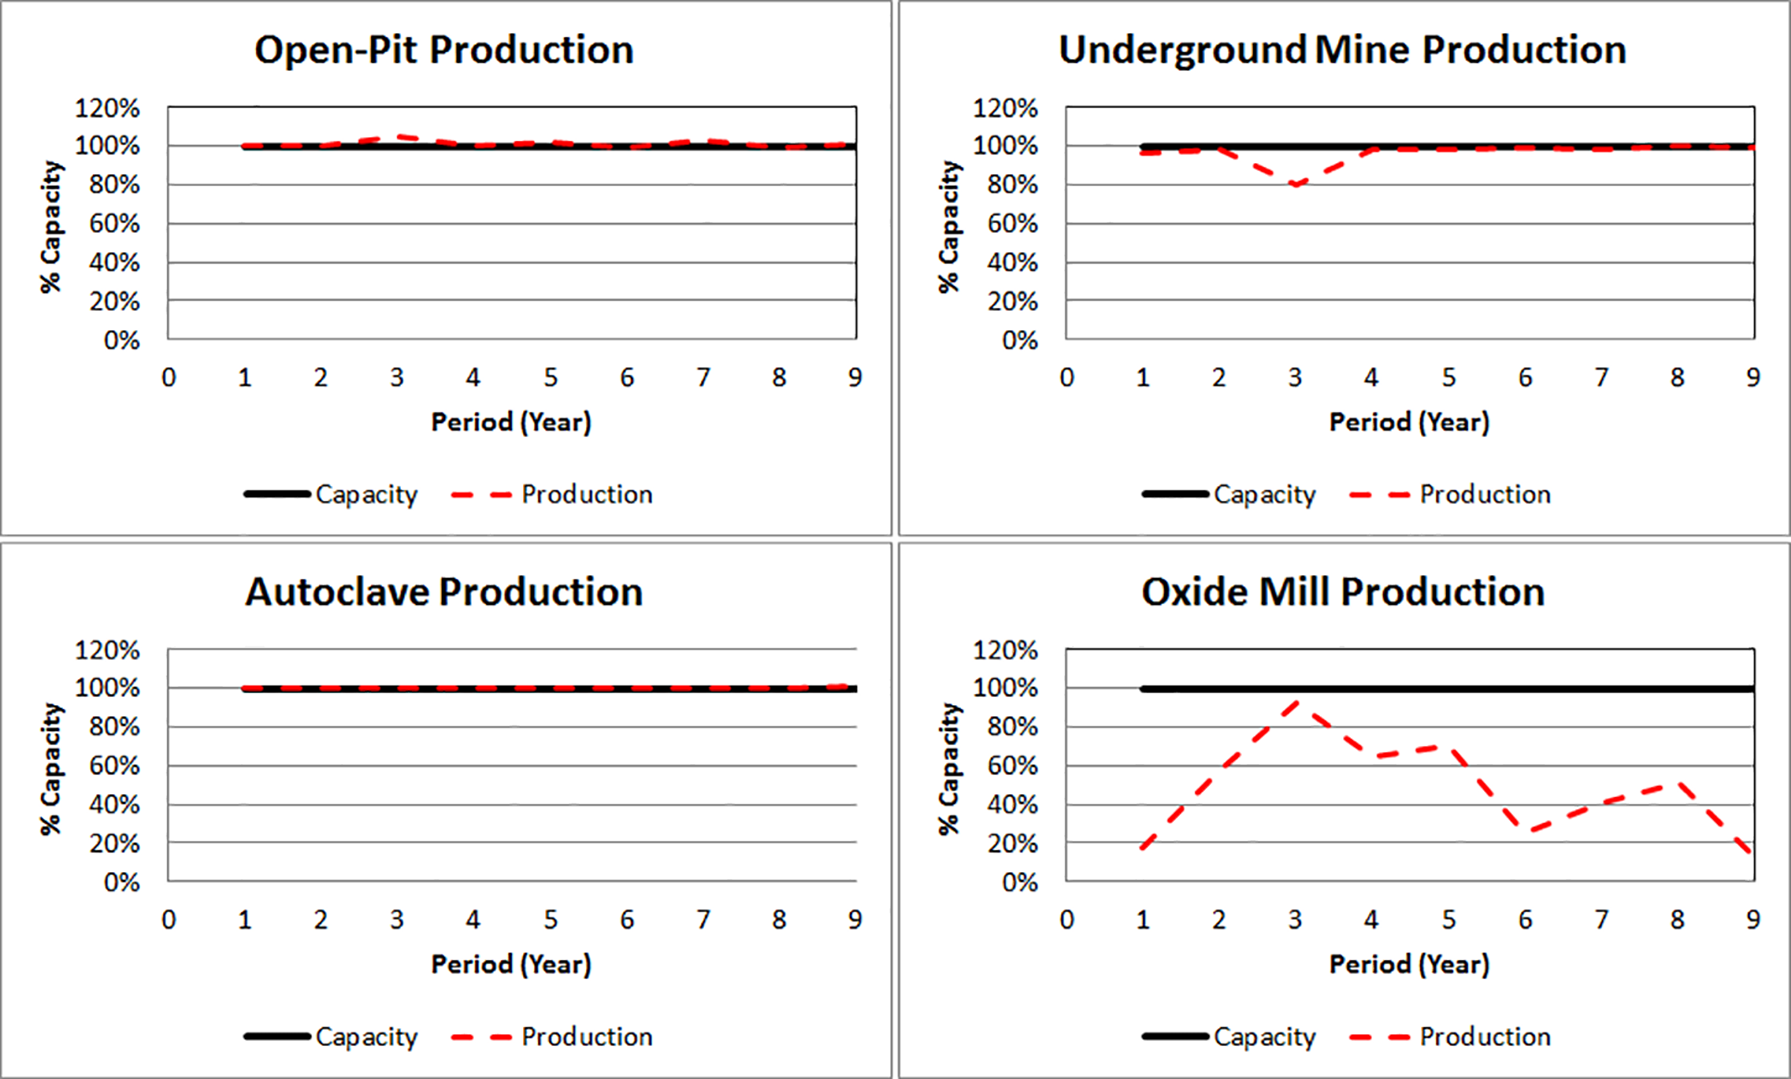
Production of the open-pit, underground mine, autoclave and oxide mill with the stochastic solution that includes initial stockpiles
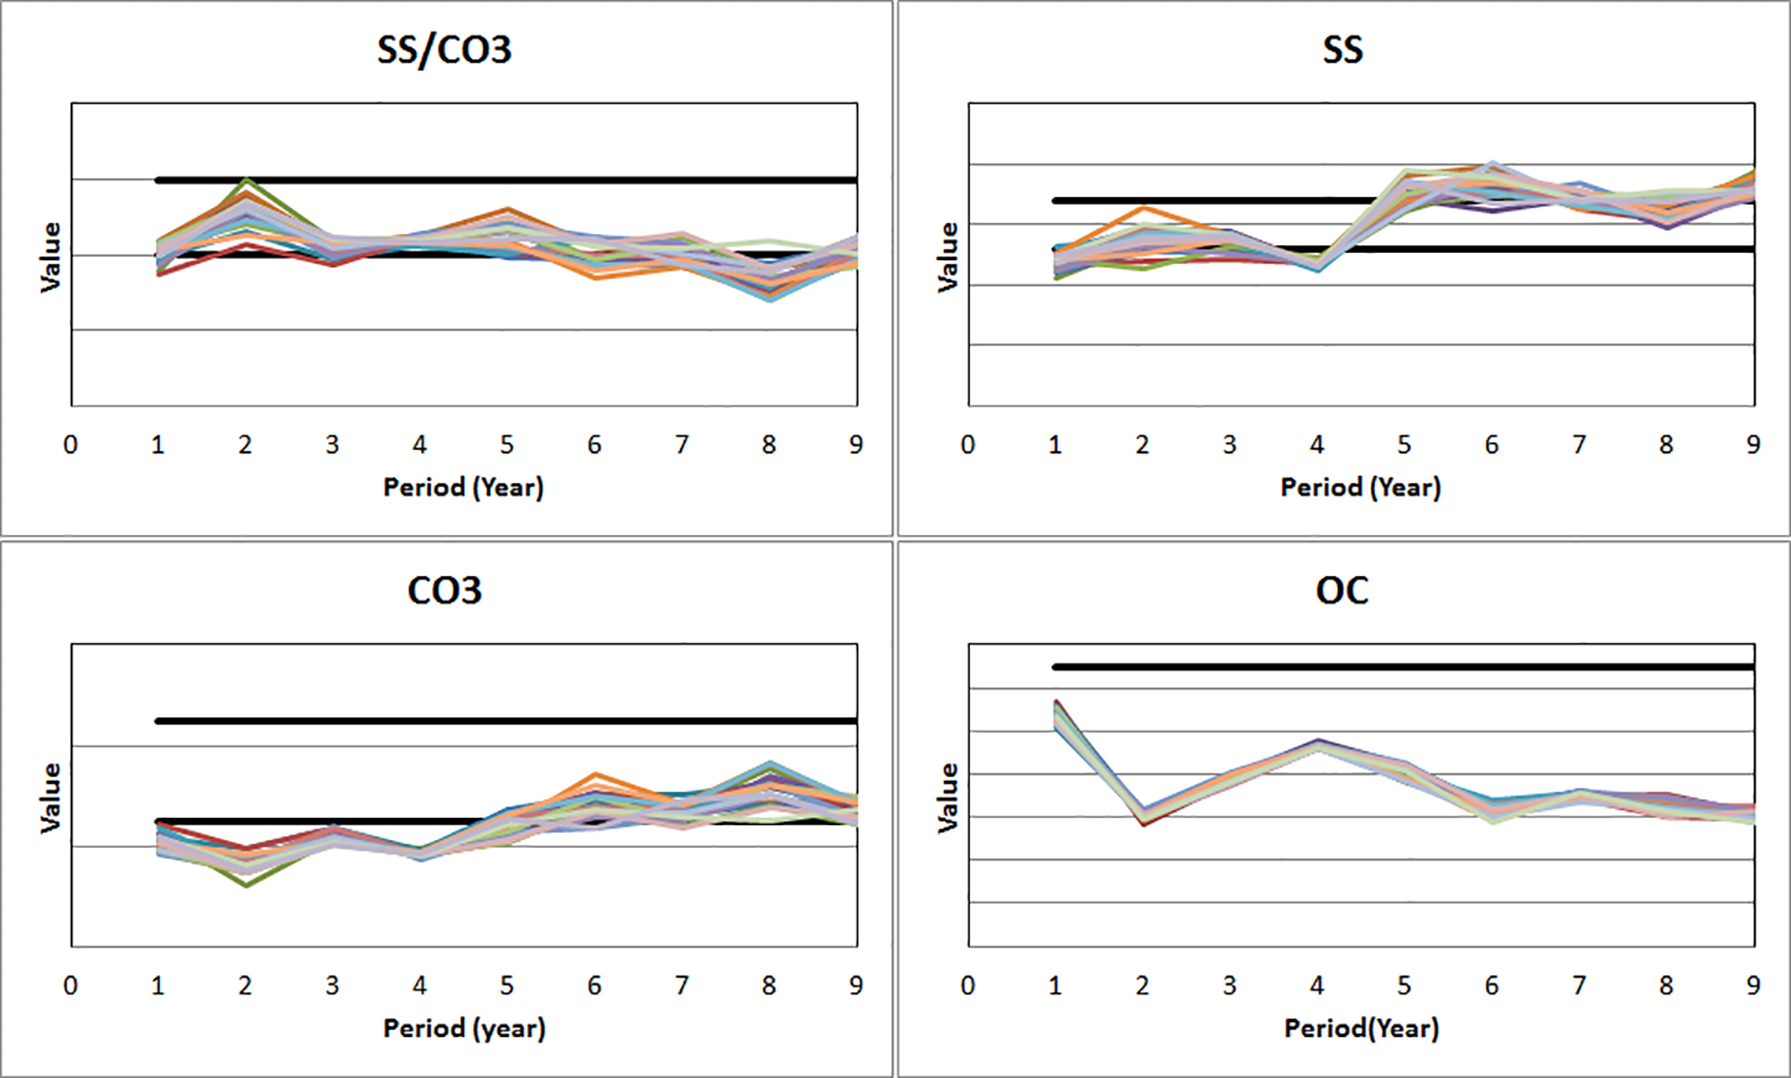
SS/CO3 ratio, SS, CO3 and organic carbon with the stochastic solution that includes initial stockpiles
The SS/CO3 ratio has large probabilities of being inside the operational ranges in all periods except for year 8 where it might be a bit below the lower target value. In the first 4 years, the SS will be close to the lower target value, whereas in the rest of the years, it will be closer to the upper target value. The abrupt change observed between year 4 and 5 is originated from different stockpiles being reclaimed, being the stockpiles used in the last years particularly high in SS. The CO3 is a bit below the targets in the first year but progressively goes towards the targets by the end of the LOM. The OC is well controlled throughout the LOM. The expected NPV is 14% greater than the one obtained with the deterministic initial solution (Fig. 21).
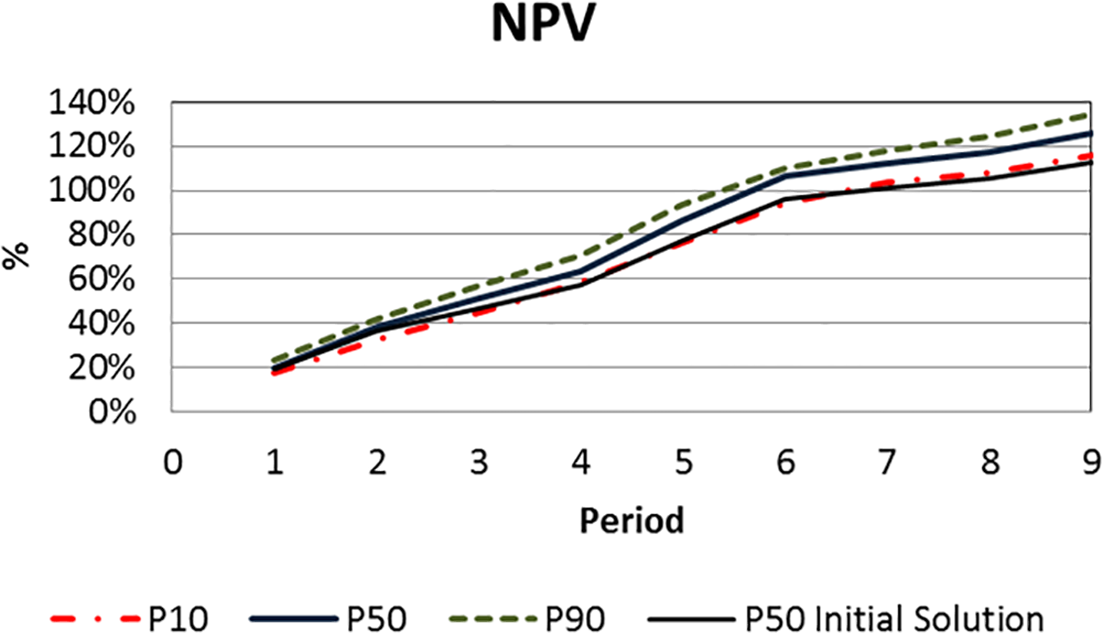
NPV of the new stochastic solution and its risk profile
Conclusions
This paper presents a method to simultaneously optimise different components of mining complexes comprised of open-pits and underground operations. The method can be easily adapted to different underground mining methods. At different processing destinations, the method accounts for operating modes and external sources of material used for blending purposes. The implementation of the method at a gold mining complex shows substantial improvement in expected NPV and in meeting operational targets for the autoclave. The perturbations at operating and transportation decision levels act as a diversification strategy for the unit-based perturbations. However, as in the case study, no operating modes and transportation systems are considered, a stand-alone diversification strategy for the unit-based perturbations must be included to explore better the solution domain.
Future extensions of the method may consider stochastic stockpiles, geotechnical and environmental aspects of the underground activities and the optimal consumption rate of external blending material.
Acknowledgements
The authors thank the organisations and companies who funded this research: NSERC Collaborative Research and Development Grant CRDPJ 411270-10, entitled ‘Developing new global stochastic optimisation and high-order stochastic models for optimising mining complexes with uncertainty’; industry collaborators: AngloGold Ashanti, Barrick Gold, BHP Billiton, De Beers, Newmont Mining and Vale, and NSERC Discovery Grant 239019. Particular thanks to Mern Vatcha from Barrick for his generous contribution.