
Abstract
Ethylene–methyl acrylate copolymer and multiwalled carbon nanotubes (MWNTs) were melt processed in order to determine the structure–property relationship of the resulting nanocomposites. The effect of MWNT loading on the thermomechanical and rheological properties of the nanocomposites is systematically investigated. Morphological characteristics these reinforced were investigated using field emission scanning electron microscopy and high resolution transmission electron microscopy. X-ray diffraction and differential scanning calorimetry studies showed that the MWNTs affect the crystallisation process. Dynamic mechanical analysis revealed that the storage modulus of the composites was significantly increased particularly at high temperatures. Thermogravimetric analysis showed that the MWNTs stabilise the ethylene–methyl acrylate matrix. The influence of concentration of filler was also realised by a frequency sweep experiment. Storage modulus (in dynamic shear) value increases especially at higher frequency levels due to increased polymer–filler interactions. Both the unfilled and filled composites exhibit rheological behaviour of non-Newtonian fluids. The dynamic and steady shear rheological properties register a good correlation in regard to the viscous versus elastic response of such systems.
Introduction
There has been a growing interest in using filler particles having at least one dimension in the nanometre range for producing polymeric nanocomposite materials with remarkably improved properties.1, 2 Carbon nanotubes (CNTs) were popularised by Iijima.3 Since then, CNTs have been intensively studied for applications in polymer composites because of their superior mechanical properties.4–7 However, outstanding properties of CNTs will be little value unless they can be incorporated into a matrix to produce engineering composite materials, as it has been proposed in many works.8–10 Multiwalled carbon nanotubes (MWNTs) also have been expected as attractive fillers for increasing the electrical conductivity of polymers at relatively lower loading as compared to traditionally used conductive fillers, such as carbon blacks.11–14 In addition, it is one of the expectations for CNTs that their incorporation into polymeric matrixes leads to a mechanical reinforcement. However, the efficiency of CNTs to fulfil these tasks depends on a good dispersion within the matrix material.15, 16 In some of the cases, melt mixing is the preferred method of composite preparation, since aggregate formation can be minimised by appropriate application of shear during melt mixing. Melt mixing for the polymer–CNT composites is more convenient than others, and can attain the production on a large scale in the polymer industries.17, 18
The rheological characterisation of polymeric materials is one of the most important steps to resolve various problems encountered in polymer processing. Rheological methods have been widely used to study composites incorporated with fillers, since this can also detect the presence of internal structures.19–21 A very practical and important problem that has received considerable recent attention is the establishment of flow–structure and structure–property relationships with relevance to the melt processing of CNT polymer composites, focusing in particular on the issue of nanotube dispersion.22–26 Huang et al.27 have established working relationships between mixing time and network elasticity for polymer composites containing aggregates of nanotube bundles, while some of the connections between melt rheology and electrical conductivity in percolated CNT networks have also been studied in detail.28–30 The dynamic and steady shear rheological studies can also be useful to judge or predict the final properties including mechanical and electrical properties of the resultant nanocomposites after processing.31–34 Till date, much research has been performed on the rheological behaviour of various polymer–CNT composites.35–37 The rheological properties of ethylene–methyl acrylate (EMA)–MWNTs nanocomposites have not been reported till date. Therefore, it is essential to understand the rheological behaviour for nanocomposites based on EMA filled with MWNTs. Survey also depicts that there is hardly any literature available in the field of methacrylate based nanocomposites which can be potentially more versatile.
This paper describes the thermomechanical and morphological behaviour of the EMA–MWNTs nanocomposites. Nanocomposites prepared by melt processes are characterised in terms of morphology, thermal, dynamic mechanical and rheological properties. Dynamic and steady shear rheological characteristics of various composites have been evaluated to understand shorter and longer range flow properties.
Experimental
Materials
A commercial grade of EMA copolymer (Elvaloy 1125 of Du Pont, Wilmington, DE, USA) with 25 wt-% of methyl acrylate having a melt flow index (ASTM D1238 and ISO 1133 in g/10 min) of 0·4 g/10 min, was purchased in the form of granules. Carbon nanotubes used in this study are MWNTs purchased from Helix Material Solution (Richardson, TX, USA) and used as received. Nanotubes were prepared by the chemical vapour deposition process having a purity of ∼95%; the average diameters of nanotubes were about 40–60 nm and lengths were about 0·5–40 μm and the nanotubes were used as such without further purification.
Preparation of EMA–MWNTs nanocomposite
Ethylene–methyl acrylate and various amounts of MWNTs were melt mixed separately in a HAAKE Rheomix OS (Karlsruhe, Germany) at 120°C for 15 min with a rotor speed of 100 rev min−1 using a fill factor of 75%. The molten mass was passed through a two-roll mill immediately after mixing to achieve a sheet of ∼3 mm thickness. The sheet was cut and pressed (2 mm thick) for 4 min in a compression moulding machine (Moore Press, Birmingham, UK) at 120°C. Teflon sheets were placed between the moulded sheet and the press plates. The sheet was then cooled at room temperature under pressure. The nanocomposite samples so prepared were moulded to obtain ∼2 mm thick sheets. Sample designations are given according to the following: E is the EMA, N is the MWNTs, the number after E is the percentage of methyl acrylate content in EMA and the number after N is the wt-% of MWNTs. Therefore, E25N1·0 denotes a sample of EMA which contains 25% methyl acrylate and 1·0% MWNTs.
Testing procedures
Morphological analysis
Field emission scanning electron microscopy (FESEM) was carried out on the cryofractured samples (in liquid N2) under the Carl Zeiss SUPRA 40 FESEM (Oberkochen, Germany). The fracture surfaces were then coated under vacuum with a thin gold layer.
High resolution transmission electron microscopy (HRTEM) analysis was carried out on JEOL-JEM 2100 make (JEOL Co., Tokyo, Japan), a transmission electron microscope with a lanthanum hexabotate target, operating at 200 kV and beams current of 116 μA to examine the morphology of MWNTs and various composites. Samples were cut to 50 nm thickness using Leica Ultracut EM FCS, ultracryotom. The cut samples were supported on a copper mesh before observation under the microscope.
X-ray diffraction (XRD) study
The XRD patterns of the samples were recorded with a Philips PW1710 X-ray diffractometer using monochromatic Co Kα radiation (wave length 1·97 Å) in the angular range 10–35° (2θ) at an operating voltage of 40 kV with a beam current of 20 mA.
The areas under the crystalline and amorphous portions were determined in arbitrary units and the degree of crystallinity χ was measured using the relation

The crystallite size of pure EMA and its composites were determined from the XRD data using the following equation

Differential scanning calorimetry (DSC) study
Differential scanning calorimetry of the composite samples was performed in a DSC Q100 (TA Instrument Inc., Newcastle, DE, USA) machine in N2 atmosphere from −100 to +150°C at a rate of 10°C min−1.
Dynamic mechanical properties
Dynamic frequency sweep measurements were performed using a dynamic mechanical analysis (DMA) 2980 V17B dynamic mechanical analyser (TA Instrument Inc.) within the linear viscoelastic region under a dynamic tension mode at 30°C under a nitrogen atmosphere from 0·1 to 100 Hz using 0·05% strain. Dynamic temperature sweep experiment of all the nanocomposites was conducted under the dual cantilever mode at the frequency of 1 Hz and at a double strain amplitude of ∼100·0 μm. Rectangular specimens (dimension of 59×12×2 mm) were subjected to sinusoidal stress, and were heated from −70 to 80°C at a heating rate of 2°C min−1 using the same instrument.
Thermogravimetric analysis (TGA) studies
Thermogravimetric analysis measurements were performed with 10–12 mg samples using a TGA Q50 V6·1 (TA Instruments Inc.), under a nitrogen atmosphere from 30 to 600°C operated at a heating rate of 10°C min−1.
Measurement of rheological properties
Rubber process analyser
Dynamic rheological measurements were carried out using the rubber process analyser (RPA2000, Alpha Technologies, Akron, OH, USA).38 The RPA equipped with a parallel plate rheometer that is able to measure the complex modulus of rubber–thermoplastic elastomeric compounds under dynamic shear deformation. The RPA is designed with a range of variable test parameters to enable a wide range of physical properties to be measured. It can be operated in strain and frequency sweep modes in wide ranges of strain amplitudes and temperatures. Nanocomposites are studied by using RPA in frequency sweeps, temperature sweeps and stress relaxation experimental modes. The frequency sweep test was performed where the oscillating frequency was programmed to change in steps from 0·167 to 30 Hz within the linear viscoelastic region (computed by strain sweep experiment, not shown here), at a constant strain amplitude of 3·0% and constant temperatures of 110, 120 and 130°C respectively. The per cent error associated with the dynamic viscosity or storage modulus measurements was within ±1, 1·5 and ±2% at 110, 120 and 130°C respectively.
Monsanto capillary rheometer
The basic limitation of RPA is that it can be operated only at relatively lower shear rates for oscillating shear and at a low frequency of oscillations. Therefore, the measured material functions do not actually conform to the higher deformation rates which are normally applied in processing operations. To overcome this limitation, a capillary rheometer was also used to determine the flow behaviour at steady and higher shear rates. The melt flow properties of the CNT filled EMA composites were examined using a Monsanto processability tester (MPT) (Akron, OH, USA), which is a high pressure capillary rheometer with a barrel radius of 9·53 mm. The test samples were charged into the barrel and preheated for 3 min for uniform temperature distribution. Then the extrusions were performed at 120°C and at six different ram rates 2·54×10−2, 12·7×10−2, 25·4×10−2, 63·5×10−2, 127·0×10−2 and 190·5×10−2 m min−1 (i.e. at six different shear rates in the range of 12·26–919·5 s−1), following the procedure outlined in ‘MPT operation manual’.39 The variation in shear rates was achieved by changing the speed of the plunger automatically. The pressure at the entrance of the capillary was recorded automatically with the help of a pressure transducer. The capillary used had a length to diameter ratio (L/D) of 30∶1 (capillary die used was 30 mm in length and 1 mm in diameter), with a conical entry having multiple cones of 45 and 60° which are known to minimise the pressure drop at the entrance.
Results and discussion
Morphological properties
To understand the dispersion of the nanotubes into the polymer, morphology of cryofractured surfaces of composite films was observed under the Carl Zeiss SUPRA 40 FESEM. The composites containing 1 wt-% MWNTs are found to be better dispersed as shown in Fig. 1a. Aggregation tendency has been observed in the fracture surface when the nanotube content increased to 2·5 wt-% as shown in Fig. 1b. When the nanotube content is increased (beyond 2·5 wt-%), a large scale aggregation and agglomerate of several CNTs (Fig. 1c and d) are observed on the fracture surface. The white region represents the aggregated MWNTs and polymeric debris formed during brittle fracture. It is also shown that nanotubes are pulled out slightly.
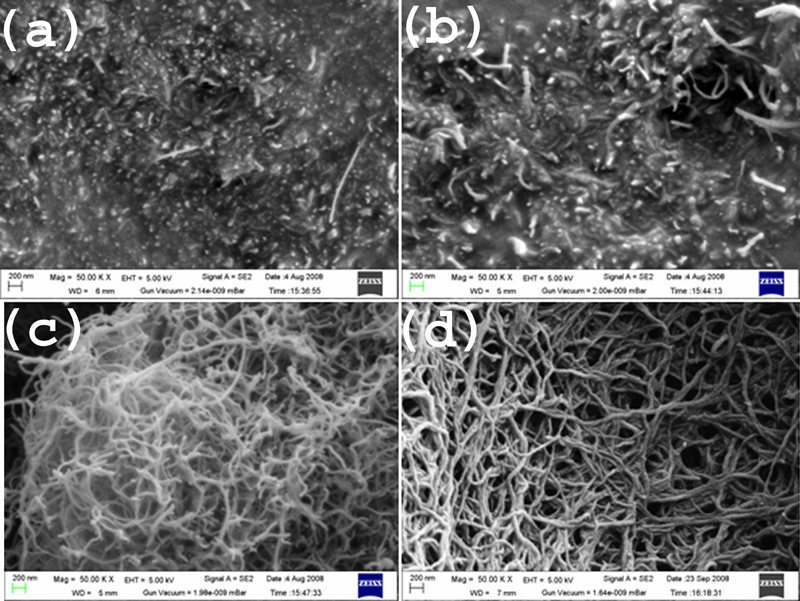
Field emission scanning electron micrograph of MWNT–EMA composites with different concentrations of MWNT
In order to observe the morphology of a localised area, samples were investigated by means of HRTEM. Composites containing 1 wt-% MWNTs (Fig. 2a) are in general more homogeneous with no aggregation of nanotubes. This uniform dispersion occurs by the increased interfacial bonding between the MWNTs and the matrixes are formed by melting process. When the nanotube content increased to 2·5 wt-%, short range aggregation of several CNTs (Fig. 2b) was observed. Further, when the nanotube content increased to 3·5 wt-% or above, large scale aggregation and agglomerate of several CNTs (Fig. 2c and d) were observed. However, limited degrees of breakdown of nanotubes are noticed after the melt processing especially for 3·5 and 5·0 wt-% loaded composites. In all cases the hollow portion of the nanotubes are clearly visible.
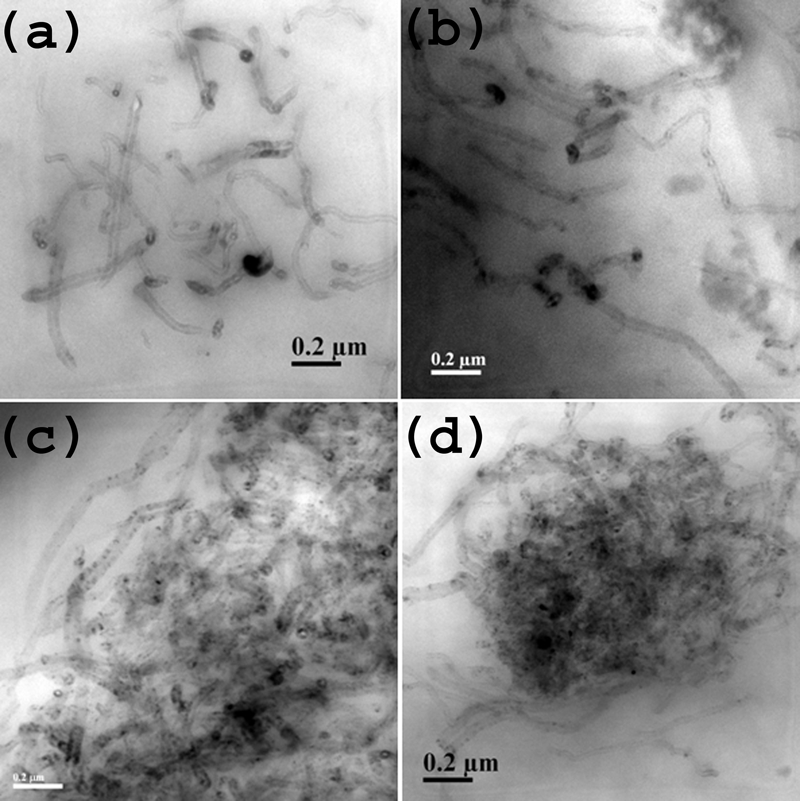
Image (HRTEM) of MWNT–EMA composites with different concentrations of MWNT
X-ray diffraction studies
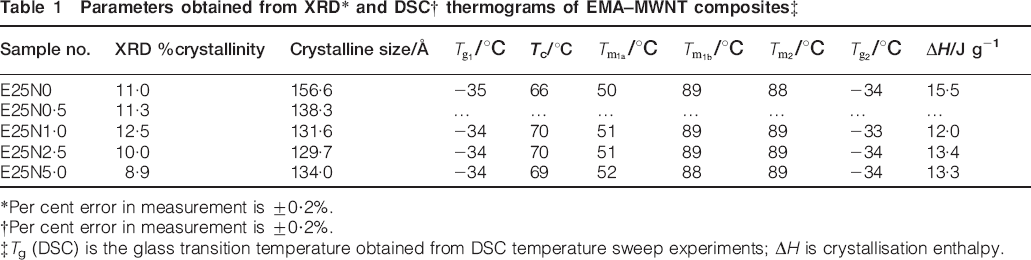
Figure 3 shows the wide angle XRD patterns of the pure EMA and EMA–MWNT composites. The XRD patterns of pure EMA show a broad hallow corresponding to the amorphous part of EMA. For the EMA–MWNT (0·5% versus 5·0%) composites, no additional peaks are obtained. These results indicate that the crystal structure of pristine EMA is preserved in composites. The XRD pattern for EMA–MWNT is reflections with increasing MWNT concentration, indicative of altered amorphous and crystalline phases. From the XRD patterns, per cent crystallinity and crystallite size were calculated for different composites, which are depicted in Table 1. Table 1 shows that the per cent crystallinity increases from 11·0 to 12·5% with increasing concentration of MWNT from 0·5 to 1 wt-%. Crystallite size of the EMA (corresponding to 2θ = 25·1°) in the EMA–MWNT composites reduces from 156·6 to 129·7 Å upon loading. The results prove that MWNT may considerably influence the crystallisation of EMA. Per cent crystallinity and crystallite size both are decreased with further loading. This is probably aggregation effect of nanotubes.
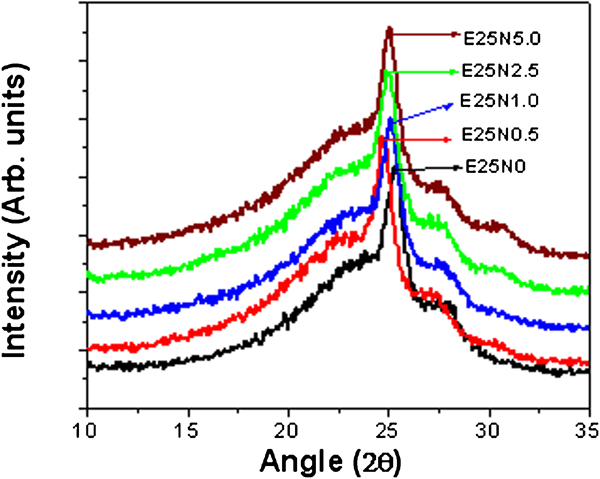
X-ray diffraction patterns of pure EMA and EMA–MWNT composites
Parameters obtained from XRD* and DSC† thermograms of EMA–MWNT composites‡
 /°C
/°C /°C
/°C /°C
/°C /°C
/°C /°C
/°C*Per cent error in measurement is ±0·2%.
†Per cent error in measurement is ±0·2%.
‡Tg (DSC) is the glass transition temperature obtained from DSC temperature sweep experiments; ΔH is crystallisation enthalpy.
Differential scanning calorimetry studies
Figure 4 displays the DSC thermogram of the composites, from which it is observed that Tm and Tg of the composites do not affect much with MWNT content in the composites. A multiple peak crystalline melting
 around 45–50°C and around 88–90°C is observed (data reported in Table 1). Initially it may be due to the deformed crystals or quasicrystals and later possibly due to the more perfect crystals (oriented in more ordered form). The crystallisation temperature of net EMA is 66°C. However, composites register crystallisation peaks at ∼70°C. Therefore, MWNTs noticeably increase the crystallisation temperature Tc of EMA. Table 1 shows the variation of crystallisation enthalpy ΔH (15·5–12·0 J g−1) as a function of the composition. Apparently, the enthalpy of crystallisation decreases gradually with the increase in MWNTs content. It is well known that the crystallinity of the EMA copolymer is provided by the polyethylene sequence of the backbone. Possibly the MWNTs being more interactive to hydrocarbon part of the polymer reduce the quasicrystalline order during the process of crystallisation. The DSC thermograms (third heating cycle) of pure EMA and its composites exhibited a single glass transition temperature
 at about −34°C.
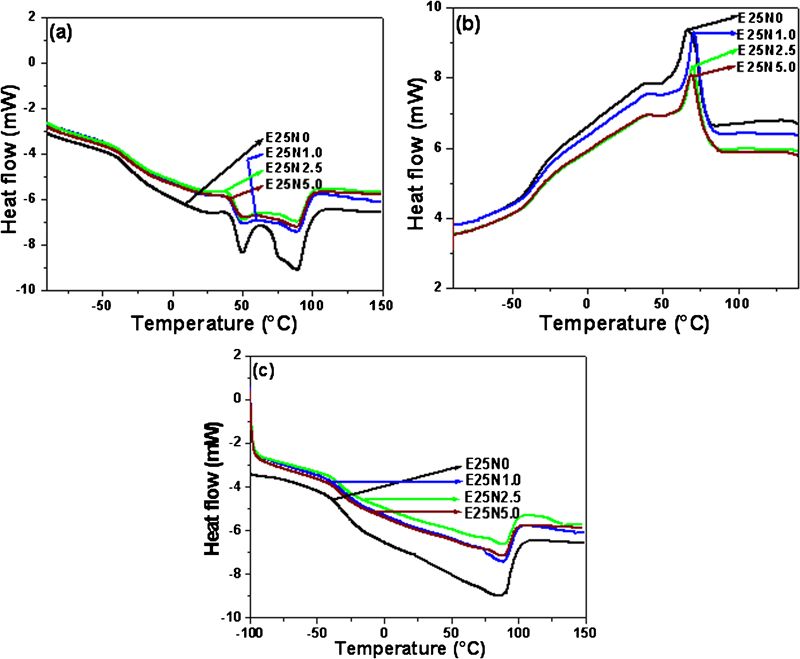
Thermograms (DSC) of pure EMA and various composites
Dynamic mechanical analysis
Dynamic frequency sweep studies
When a sinusoidal strain is imposed on a linear viscoelastic solid, it results in a sinusoidal stress response with a deference of phase factor. Under this condition, the dynamic–mechanical properties depend only on temperature and frequency and are independent of the type or extent of deformation, i.e. constant strain, constant stress or constant energy. However, the frequency dependence changes significantly in the case of non-linear viscoelastic solids, e.g. filler reinforced elastic polymers.
Figure 5a shows that the storage modulus increases with the increase in frequency for the pristine polymers and their nanocomposites. These reflect the near plateau to glass transition features of viscoelastic behaviours. Figure 5b shows that tan δ increases with increasing frequency. A noticeable increase in tan δ for the composites as compared to the respective pristine polymer represents higher loss moduli of the composites. However, E25N5·0 shows remarkably less value of tan δ as compared to other composites over the experimentally accessible range of frequencies. This may be due to the significant decrease in the polymer volume fraction as well as increased polymer–filler contacts those contribute to reduce damping by segmental motion.
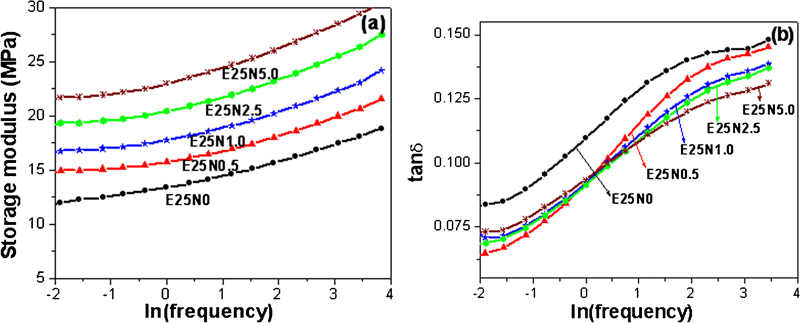
a storage modulus of various composites at different frequencies and b tan δ of various composites at different frequencies
Dynamic temperature sweep studies
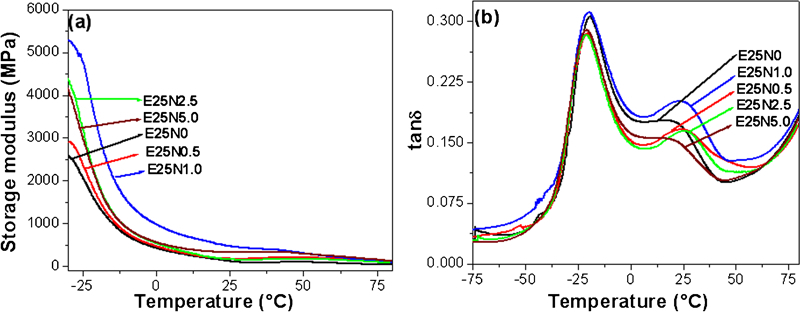
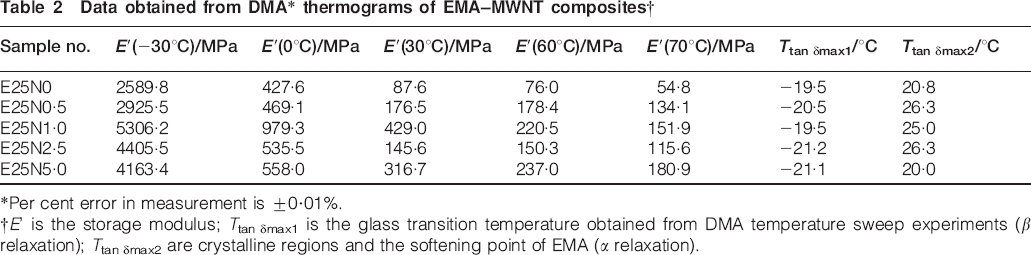
Figure 6a shows the storage moduli of various composites at different temperatures. The storage modulus of composite is increased by the stiffening effect of the nanotubes, which is particularly significant at higher temperatures. In addition, the presence of CNTs also enables the matrix to maintain a high modulus value to higher temperature. The storage modulus of the composites is significantly high particularly at high temperatures for 5·0% composites. In addition, storage modulus values for different compositions at different temperatures are shown in Table 2, which shows the continuously increasing storage modulus at the rubbery plateau with the addition of MWNTs. This becomes possible since the nanotubes have a large effect on raising the modulus above Tg. The storage moduli at 60 and 70°C clearly indicate the positive effect of MWNTs to improve the dynamic modulus of nanocomposites.
Dynamic mechanical analysis temperature sweep experiment
Data obtained from DMA* thermograms of EMA–MWNT composites†
*Per cent error in measurement is ±0·01%.
†E‘ is the storage modulus; Ttan δmax1 is the glass transition temperature obtained from DMA temperature sweep experiments (β relaxation); Ttan δmax2 are crystalline regions and the softening point of EMA (α relaxation).
The variation of tan δ as a function of temperature is reported in Fig. 6b. It reveals that by incorporating the MWNTs, tan δmax is reduced continuously from 1·0 to 5·0 wt-% loading. The peak height is decreasing with the increase in amount of MWNTs, which indicates damping behaviour increasing. The tan δ peak does not shift to higher temperature region with increasing content of nanotubes, showing that the Tg of the composite is unaltered by the addition of nanotubes. The Tg value remains almost unaltered in each case suggesting the possibility of relatively pronounced filler–filler interaction than that of the filler–polymer interaction. Interestingly, a sudden increase in Tg values and second tan δmax for E25N1·0 suggests the greater percentage of crystallinity and more polymer–filler interaction that resists the large scale segmental motion of the polymer chain.
Examining the variation of tan δ curves of the nanocomposites, two relaxations were observed in different magnitudes, identified as α and β, in order of decreasing temperature. The α relaxation recorded at 0 up to 45°C is usually related to the crystalline–amorphous polymer regions and the softening point of EMA, while the β relaxation recorded at −60 up to 0°C corresponds to the Tg of EMA (Fig. 7b). According to these curves, neat EMA exhibited Tg at about −19·5°C. However, in the studied samples the Tg seems to be marginally affected by the addition of the MWNTs, probably due to the small filler loading. It is also noticed that the addition of MWNTs into EMA has no effect on the position of loss tan δ peak.40 This may be due to the preferential aggregation of nanotubes into bundles, which weakens the adhesion of EMA molecules on nanotube surfaces.
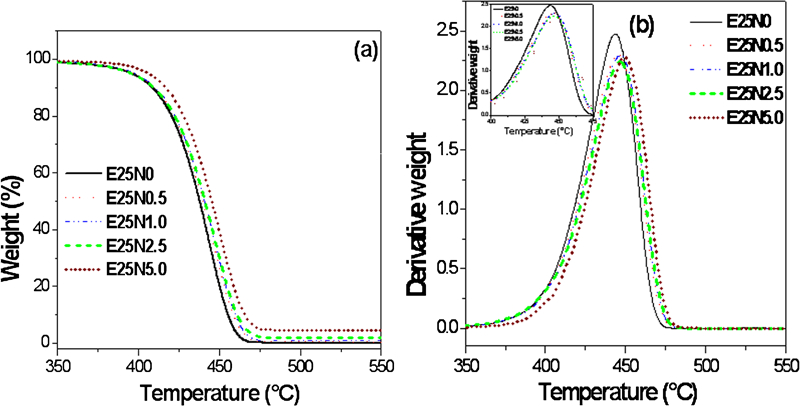
a curves (TGA) for pure EMA and various composites and b derivative thermogravimetric curves for pure EMA and various composites
Wang41 reported that due to polymer–filler interaction, the adsorption of the polymer chains on the filler's surface reduces the mobility of the macromolecular segments. This transition zone surrounding the nanoparticles exhibits higher modulus and Tg, both of which are gradually reduced with increasing distance from the filler surface.
Thermogravimetric analysis studies
Figure 7 shows the TGA thermograms of EMA and various composites. Nanotubes have a major effect on decomposition temperature of EMA. Pure EMA starts to degrade in a nitrogen atmosphere at ∼395°C and is completely degraded at ∼448°C. The random scission of EMA (around 395–430°C) would be initiated by homolytic scission of a methoxycarbonyl side group followed by β scission rather than by main chain scission.42, 43 The methoxycarbonyl side group makes the β C–C scission easier due to its electronic and steric effects in EMA molecules.44 Therefore, the loss of methoxycarbonyl side group is the initial degradation step. Scission in ethylene chain is the major degradation step. The E25N1·0 composites start to degrade at 398°C, whereas for the incorporation of MWNTs into EMA offers a stabilising effect since the onset of degradation occurs at higher temperatures, i.e. 397·5 and 406°C for E25N2·5 and E25N5·0 composites, which are 2·5 and 11°C higher respectively than those for pure EMA. A closer look into the thermograms reveals that the maximum weight loss Tmax for pure EMA occurs at 444°C. Table 3 shows the Tmax of the composites. The peak shifts to a higher temperature with increasing nanotube content, showing the Tmax of the composites raised by the addition of MWNTs.
Results of TGA* experiment
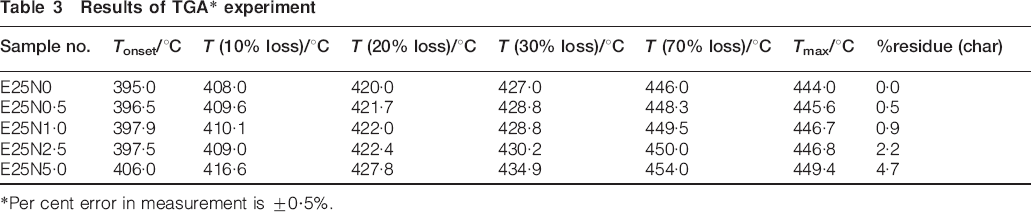
*Per cent error in measurement is ±0·5%.
From Table 3 it is found the temperature corresponding to the percentage of weight loss always increasing for all composites. The incorporation of MWNTs into EMA offers a stabilising effect since the onset of degradation occurs at a higher temperature. The weights of the composites remain fairly constant at the temperature beyond 480°C, indicating that the EMA matrix has degraded completely and the residue contains mainly the nanotubes.
Rheological studies
Dynamic rheological studies using RPA
The dependence of complex viscosities η* on the oscillatory frequency ω of the EMA–MWNT composites and neat EMA at different temperatures is shown in Fig. 8a–c. It is obvious that nanotubes have a major effect on the rheological behaviours of the polymer composites. Clearly, both unfilled and filled samples exhibit rheological behaviour of non-Newtonian fluids (initial Newtonian regions were not prominent), as indicated by the decrease in their η* and with increasing frequency. It can be seen that the η* decreases with increasing temperature for both the neat EMA and the EMA–MWNT composites. At these temperatures, EMA exists in the molten state along with distributed MWNTs. The dependence of η* on the temperature can be interpreted by a free volume concept: an increase in temperature allows more thermal motion of macromolecules and greater free volume in the polymer, which leads to a decrease in intermolecular or intramolecular resistances associated with flow. The η* increases with increasing MWNT content. E25N5·0 shows maximum viscosity among the all composites. It also exhibits less temperature dependence. This difference indicates that more MWNT loadings result in more obvious solid-like behaviours of the composites. For pure EMA and composites, η* decreases with frequency. Decrease in viscosity with the increase in frequency for all filled composites may be due to the preferential adsorption of higher molecular mass fraction of the composites at the filler surface.45 At low shear rates, the network structure of the filler is not disrupted; however, at increasing shear rates, the secondary forces may be broken, and the viscosity decreases dramatically. It is well known that the presence of fillers in polymer melts not only increases their shear viscosity but also affects their shear rate dependence.46 Therefore, the state of dispersion (longer range) can be monitored through measuring the dynamic rheological behaviours of the composites at a given loading. The higher the viscosity of a composite system becomes, the weaker sensitivity of η* on temperature is obvious.
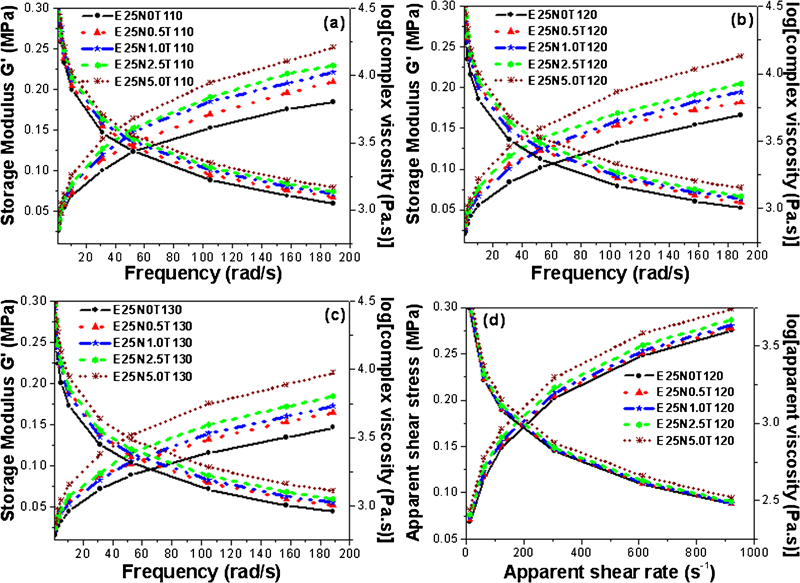
a–c variation of storage modulus and complex viscosity of various composites with increasing frequency in dynamic frequency sweep experiment at 2·0% strain and d variation of apparent shear stress and apparent viscosity of various composites with increasing apparent shear rate in MPT study. Number after T is the temperature at which rheological measurement is carried out
It is observed that all composites with various loading of MWNTs display an increase in elastic response G′ with increasing frequency. A monotonous increase in G′ is observed with the increase in frequency. This elastic response improves with the increase in particle loading in the samples. This can be attributed to a decrease in time available for molecular relaxation (flow). In the frequency sweep test, the shear strain (2%) is very small. At a low frequency there is a sufficient time available to allow polymer chains to relax fully leading to the flow rather than an elastic deformation process. At a higher frequency, the storage modulus G′ exceeds the viscous modulus G″ signifying that the elastic effect is predominant. This is because there is an insufficient time at a higher shear rate to allow the polymer chain to relax, which contributed to an increase in the elastic nature of the polymer melt. Multiwalled carbon nanotubes have only a modest effect on lower frequency response. However, it exerts a substantial influence at higher frequency response. These results indicate that the nanotubes influence the polymer relaxation dynamics at length scales longer than the entanglement distance.37 The alignment and dispersion of the nanotubes in EMA matrix have a strong influence on the rheological behaviour of the nanocomposites. Improved nanotube dispersion, less alignment of the nanotubes, and longer polymer chains result in more restraint on the mobility of the polymer chains. Direct evidence for the above has been obtained by HRTEM observation as discussed in the earlier section.
Steady shear flow–MPT studies
Melt viscosity (capillary flow)
From processing and application points of view, the rheological results at wider ranges of shear rates of a material are very important. In this regard, steady shear viscosity measurements were performed. Figure 8d show the plot of τapp versus
 app and log (ηapp) versus
 app respectively for pristine EMA and its various composites at 120°C. At lower shear rates, the shear viscosity does not exhibit a Newtonian plateau. τapp of the composites increases with increasing
 app, and ηapp decreases with increasing
 app indicating the pseudoplastic behaviour of the composites. From the MPT experiment, it is also observed that τapp and ηapp increases with the addition of MWNTs into matrix polymer. E25N5·0 displays the highest shear stress values while other composites register lower values at all shear rates. However, the difference of shear stresses between E25N5·0 and E25N3·5 at low to high shear rates is much less. The shear viscosities are higher at a lower shear rate region and exhibit a large dependence on the shear rate. At a higher shear rate, the viscosity drastically reduced possibly due to the disruption of structural networks. Lower viscosity at high shear rates are due to a shear thinning effect of the composites. As MWNTs loading is increased, both τapp and ηapp are increased, indicating the improvements in the melt strength. The sample shows the predominance of viscous and elastic behaviour at low and high shear rate regions respectively. Increased interfacial interaction and uniform dispersion are more effective at a higher MWNT content relative to the lower MWNT content. The immobilisations of polymer chain are mostly presumed due to the secondary interactions.
Conclusions
In conclusion, melt blending offers a simple and effective means to fabricate EMA–MWNTs composites. X-ray diffraction studies show that interaction exists between the crystalline components of EMA chains and MWNTs. Differential scanning calorimetry studies show that nanotubes can act as nucleating agents and, hence, noticeably increase the crystallisation temperature of EMA. However, it affects adversely to reduce the pseudocrystalline orders. Long range network structure that presents in 5·0 wt-% MWNTs loaded composite as observed in FESEM and HRTEM images. Therefore, the morphological snap shots represent the gross composite morphologies. The storage modulus of the polymer is significantly increased particularly at high temperatures. The nanotubes delay the onset of thermal degradation of EMA as observed from TGA. The decomposition temperature is higher for 5·0 wt-% MWNTs loaded composite. Both unfilled and filled composites exhibit rheological behaviour of non-Newtonian fluids. Rheological investigations showed that nanocomposites register a shear thinning behaviour. The melt viscosity increases with increase in the MWNTs filler loading in the composites which subsequently decreases with an increase in temperature and shear rate or frequency. Capillary rheological studies also confirm the pseudoplastic nature of these composites.
Footnotes
Acknowledgements
The authors gratefully acknowledge the support from the research grants of the Department of Atomic Energy (DAE) (Mumbai, India) and Council of Scientific and Industrial Research (CSIR) (New Delhi, India).