
Abstract
The present study is concerned with the reliability and effectiveness of innovative non-destructive techniques for damage characterisation and evaluation of aerospace materials and structures. Infrared thermography (IrT) was used with the aim of assessing the integrity of bonded repair on aluminium substrates. For this purpose, artificial damage of various dimensions was introduced in composite laminates. These defects were successfully monitored with IrT using different imaging techniques. IrT was also employed for the online monitoring of the loaded structure. The real time evolution of progressive debonding owing to fatigue loading was monitored. No external thermal stimulation was necessary as the cyclic loading provided thermal excitation on the system. The experimental results provided evidence that the innovative technique was capable of qualitatively and quantitatively assessing the integrity of patched repairs. In other words, this technique can be efficiently employed for damage identification and quantification.
Introduction
The increasing age of the European and worldwide aircraft fleet imposes the need for new maintenance methodologies that will secure the airworthiness of aging aerostructures. With respect to the repair application, the aircraft industry is in dire need for reliable and cost efficient in-field repair technologies that will facilitate patch application and reduce depot service time for aircrafts. Thus, the overall operational cost can be considerably reduced. In order to assess the repair efficiency, health monitoring is required during the service life of the repaired system.
Carbon fibre reinforced plastics (CFRPs) are currently the most attractive high performance structural material for aircrafts, together with hybrid composites (fibre reinforced metal laminates) and advanced aluminium alloys. As is obvious, the development of new materials requires effective non-destructive techniques in order to detect defect nucleation and propagation either at an incipient stage during fabrication or in service. The requirements for non-destructive evaluation (NDE) are driven by the need for low cost methods and instruments with great reliability, sensitivity, user friendliness and high operational speed as well for applicability to increasingly complex materials and structures.1
The present study focuses on the comparative evaluation of thermographic techniques [pulsed thermography (PT), pulsed phase thermography (PPT) and lock-in thermography (LT)] for the NDE and repair integrity monitoring of aerospace materials. For the purpose of this work, typical aerospace materials, i.e. CFRPs, were employed to patch aluminium substrates. Artificial defects were introduced in the interface between the composite patch and the mother structure (Al) via the insertion of polytetrafluoroethylene (PTFE) tapes. PTFE was cut in certain dimensions and placed in certain locations in order to simulate delamination and critical patch failure. It prevents patch sealing with the mother structure and allows the initiation of damage. The detection of a PTFE insert simulating a delamination is often questioned since the thermal variations detected by thermography result rather from the different material of the substrate than from the actual disbond. The artificial defects were identified using thermographic imaging in order to evaluate the efficiency of the method.
Finally, the efficiency of bonded composite laminates was tested online using LT under fatigue loading. The debonding process was successfully monitored as a function of the loading cycles. In this case, the thermal stimulation of the specimen was provided via mechanical loading. To the authors’ knowledge, the use of the aforementioned method for the real time monitoring of the structural integrity of the composite structure under fatigue loading is reported for the first time.
Thermography fundamentals
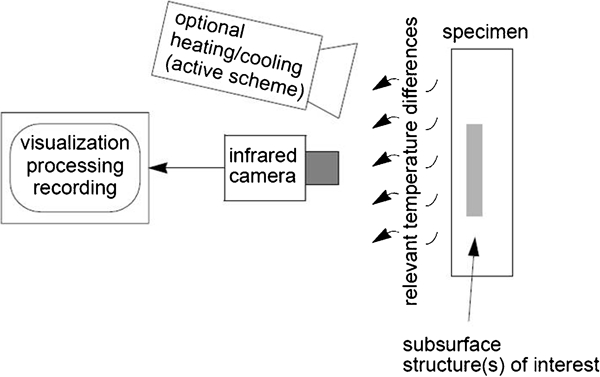
Infrared thermography (IrT) is one of the most promising techniques used for the NDE of materials and structures in the aerospace sector. IrT is usually employed for the identification of subsurface defects and features. Subsurface features are invisible to the naked eye, but they create a thermal gradient at the near surface region when they are subjected to thermal stimulation. This thermal gradient is identified by IrT because defects act as heat traps within the material. This causes a relative delay of the local cooling process compared to the defect free areas of the laminate. IrT monitoring is based on two fundamental concepts (Fig. 1), i.e. active2 and passive3 thermography.
Infrared thermography for NDE
In the active approach, thermal stimulation is necessary to create relevant thermal differences at the surface of the material/structure.2 The passive approach is used to inspect materials and structures that are naturally at higher temperature than the surrounding area.3
Pulsed thermography
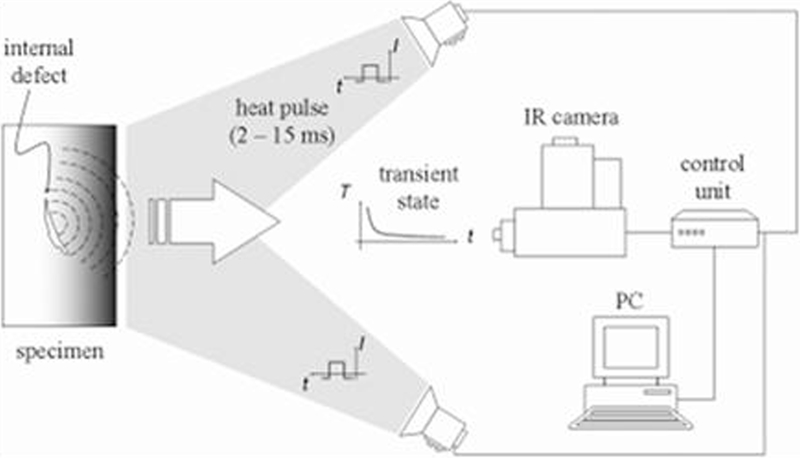
PT is based on the active thermography principle, where the surface under investigation is heated using a square heat pulse. It is a widely used technique for the NDE of aeronautic materials and structures. PT has already been established as an efficient method for delamination and disbond detection in aircraft structures and components.4–7 As is obvious, there is a large span of pulse heating periods, starting from some milliseconds for good heat conductors up to a few seconds for materials with poor heat conduction properties (Fig. 2).
Pulsed thermography
In order to explore the interior region of the tested material, thermal, spectral and other properties of the material under investigation must be taken into consideration. Vavilov and Taylor8 presented the capability of PT for extracting quantitative information about invisible defects, porosity and delaminations. Thereafter, other research groups also employed IrT as a non-destructive technique for the assessment of the integrity of laminated composites. 9 , 10
Pulsed phase thermography
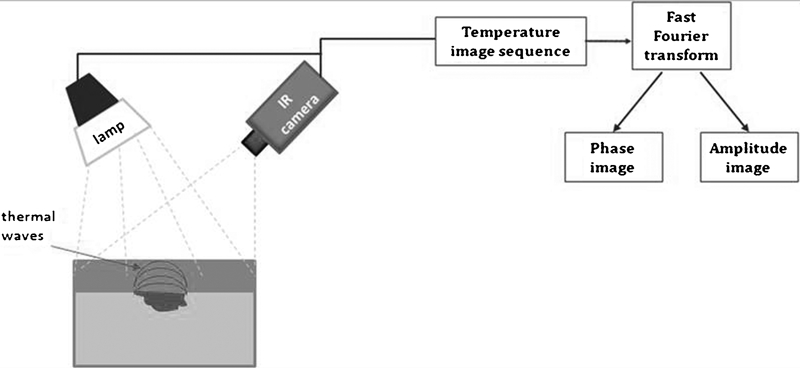
PPT has been thoroughly investigated as it uses the fast Fourier transform (FFT) to provide phase together with amplitude images. In particular, PPT is a combination of PT and LT,3 which will be well defined in the next paragraph.
In this configuration, the specimen is heated via a square heat pulse as in PT (Fig. 3), and the mix of frequencies of the thermal waves generated into the material under investigation is analysed via FFT on a pixel by pixel basis. As a result, phase and amplitude images are acquired.11–15
Pulsed phase thermography
Lock-in thermography
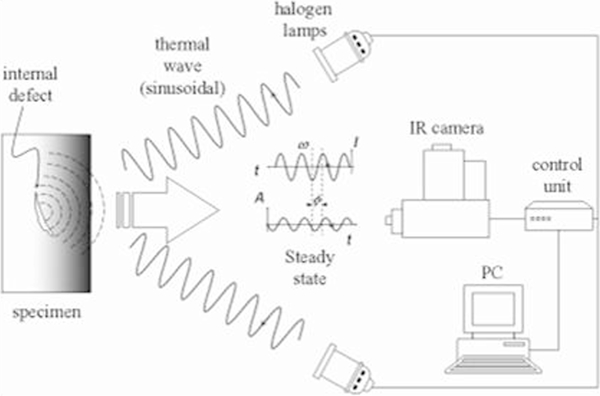
LT is a technique where the specimen under investigation is heated periodically. As is known, owing to the thermal stimulation, thermal waves at the near surface region of the tested structure are created. LT evaluation is based on these thermal waves,16 whose intensities may be assumed to change sinusoidally (Fig. 4).
Lock-in thermography
The principle of LT (Fig. 5) is based on the synchronisation of the acquisition device with the source of heating. This source can be optical excitation, ultrasound, cyclic loading of the material, etc. In the case of a specimen undergoing cyclic loading, heat waves are generated, and the resulting oscillating temperature field in the stationary regime is recorded remotely through infrared emission. The modulation frequency varies with the nature, size and shape of the defects to be detected. Using this method, the influence of emissivity and non-uniform heating on the temperature measurement is reduced, and the inspection of large areas of samples with high repeatability and sensitivity is feasible.17
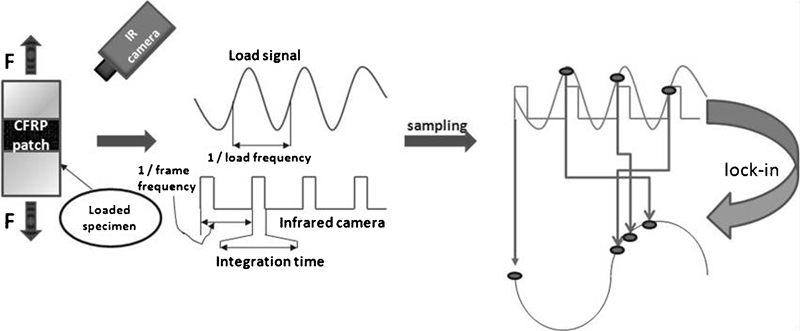
Principle of LT
As in the case of PPT, the LT mode provides the ability of amplitude and phase images, which are dependent on thermal diffusivity. The advantage of LT is the phase image which is relatively independent of surface particularities and properties.14–16
Experimental
Specimen manufacturing
The manufacturing of the CFRP patches on Al 2024 substrate is described below. All patch components were manufactured using the hand lay-up technique. The matrix was a cold curing epoxy system Araldite LY 5052/Aradur 5052 (Huntsman Ltd), and the reinforcement was a biaxial carbon fabric 160 g m−2 (Twill weave). Aluminium 2024 T3 was used as a substrate. The substrate was ground with emery cloth to promote adhesion. A PTFE tape was introduced between the patch and the substrate to simulate defects/delaminations. Figure 6a depicts the Al substrate, while in Fig. 6b, the CFRP patch on the Al substrate can be seen. Figure 6c and d show the patch configuration and the location of the simulated debondings. In more detail:
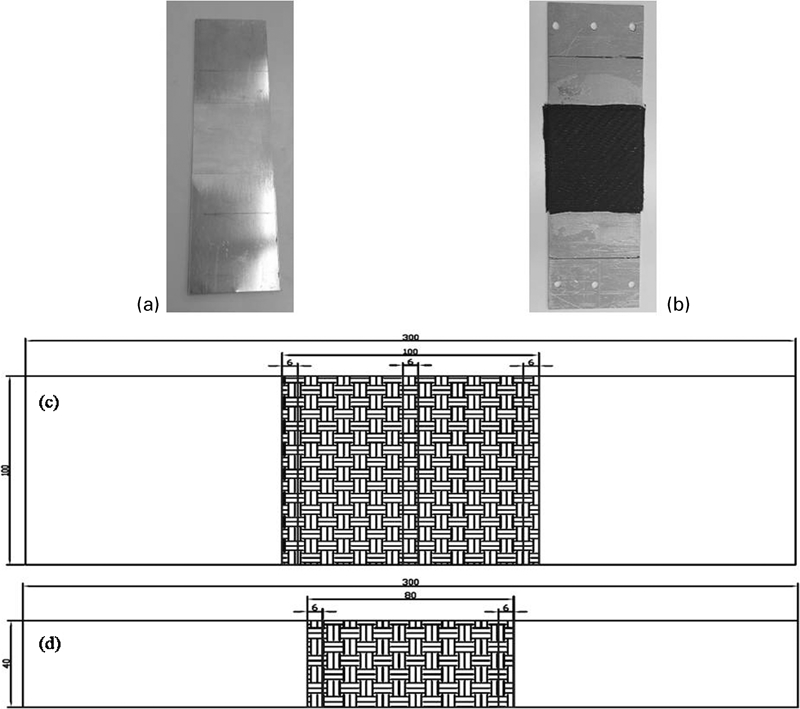
a Al substrate, b CFRP patch on Al substrate, c, d CFRP patch and artificial defect dimensions and location for offline monitoring and e, f CFRP patch and artificial defect dimensions and location for online monitoring
CFRP patches with dimensions of 100×100×1·29 mm and orientation [0]5 were positioned on the aluminium substrate, which was cut in dimensions of 300×100×1·22 mm3. PTFE inserts were placed at the edges of the patch and in the centre, as shown in Fig. 6c (100×6×0·075 mm3). These specimens were used for damage inspection using offline monitoring
CFRP patches with dimensions of 80×40×1·03 mm3 and orientation [0]4 were positioned on the aluminium substrate, which was cut in dimensions of 300×40×1·22 mm3. PTFE inserts were placed at the edges of the composite patch (Fig. 6d) (40×6×0·075 mm3). These specimens were used for damage inspection using online monitoring.
Testing
Offline inspection
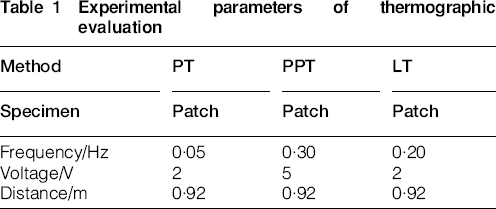
The experimental set-up comprised a heat source (four lamps, 1 kW), a medium wave infrared camera Jade 510 (CEDIP) and a specimen holder. The infrared camera uses a cooled indium antimonide detector (3–5 μm) with a frame rate of 50 Hz and a focal plane array pixel format of 320 (H)×240 (V). The position of the lamps and the infrared camera depended on the minimum focal length of the employed lens and on the desired field of view. Initially, for offline thermographic inspection, PT was employed. Subsequently, PPT and LT were used. Various combinations of frequency voltage and distance were used in order to experimentally define the optimum configuration. The experimental parameters that were finally employed for the thermographic evaluation are shown in Table 1.
Experimental parameters of thermographic evaluation
Online inspection
Thermographic online inspection was performed via LT under fatigue loading. LT was employed in situ in order to monitor the structural debonding process as a function of the loading cycles for varying bonding degrees. The infrared camera was placed at ∼50 cm distance from the specimen, where the entire surface of the patch was visible (Fig. 7). The camera was connected with the lock-in amplifier, and the amplifier was connected with the main servohydraulic controller (Fig. 7). Synchronisation of the acquisition frequency and the testing machine could be achieved through the lock-in amplifier, so that constant phase IrT images during fatigue testing were acquired. The patched specimens were tested in 5 Hz tension–tension fatigue (R = 0·1) on a servohydraulic machine (Instron 8801) (Fig. 7).
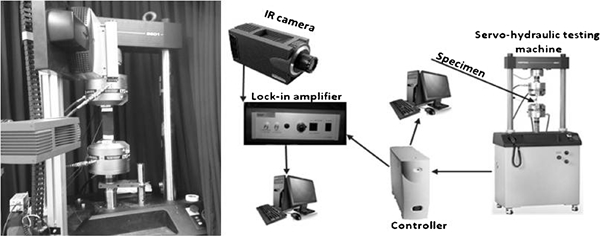
Experimental set-up
Initially, fatigue tests with increasing tension–tension load levels [5–80% of the ultimate tensile strength σuts of aluminium (∼483 MPa)] were performed so as to determine the level of load where debonding initiated and propagated in a stable manner and not catastrophically. At ∼30% of the σuts, the debonding of the patch from the substrate was evolving in a stable manner, starting from the edges of the patch where the PTFE tapes acted as initiators.
Results and discussion
Pulsed thermography (offline)
The surface of the investigated specimen was heated with a square heat pulse, and thermal images were recorded during the cooling down process. The efficiency of the methodology was evaluated by following a trajectory on the thermal image of the specimen, along which the temperature variations in the specimens were recorded. This trajectory is the straight line shown in Fig. 8a. The same methodology was employed in all the other configurations used for the offline inspection.
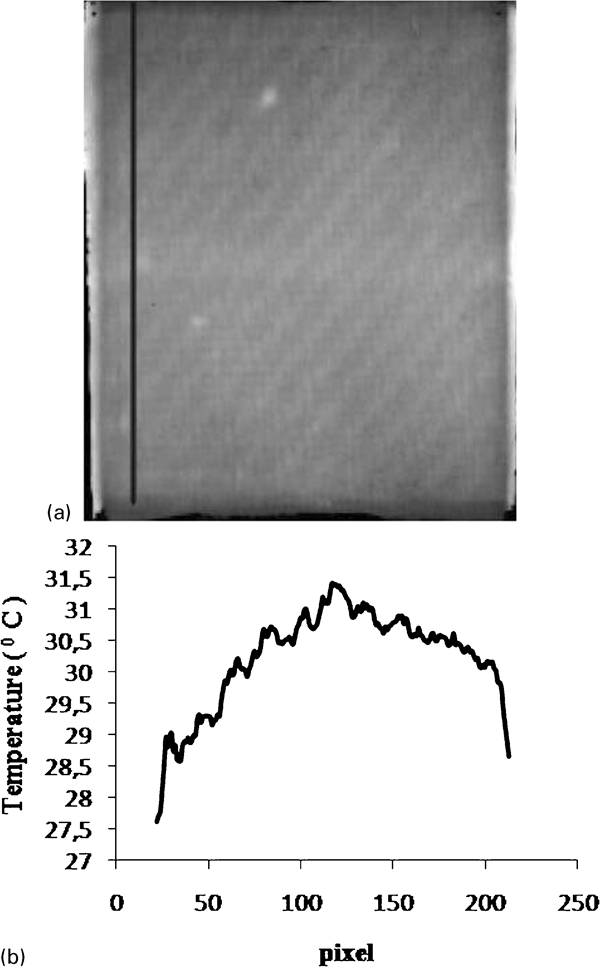
a thermal image and b temperature–pixel plot for CFRP patch on Al substrate
Figure 8b depicts the temperature versus pixel distance plot for the CFRP patch specimen. As aforementioned, the plot corresponds to the straight line seen in Fig. 8a. Thus, when the straight line crosses a defect, this is clearly shown as a step increase in temperature in the respective plot. This essentially means that the introduced defects have higher temperature than the surrounding area or act as heat traps.
As can be seen in the above thermal image (Fig. 8a), all the introduced defects are barely visible. However, the inserts at the edges of the patch are totally invisible or within the noise of the system (Fig. 8b). The pulsed thermography thermal images are also blurred. In order to improve the detection resolution, PPT and LT were subsequently utilised.
Pulsed phase thermography (offline)
As aforementioned, in PPT, the specimen is pulse heated as in the case of PT, and through FFT, phase images are available.
In Fig. 9a, all defects are clearly distinguished. This can be established from Fig. 9b, in which phase angle versus pixel distance plots are presented. In this graph (Fig. 9b), the phase angle difference where the defects (PTFE) are located is clearly higher than the noise of the curve. The plot shows a distinct step when the straight line (Fig. 9a) meets a defect.
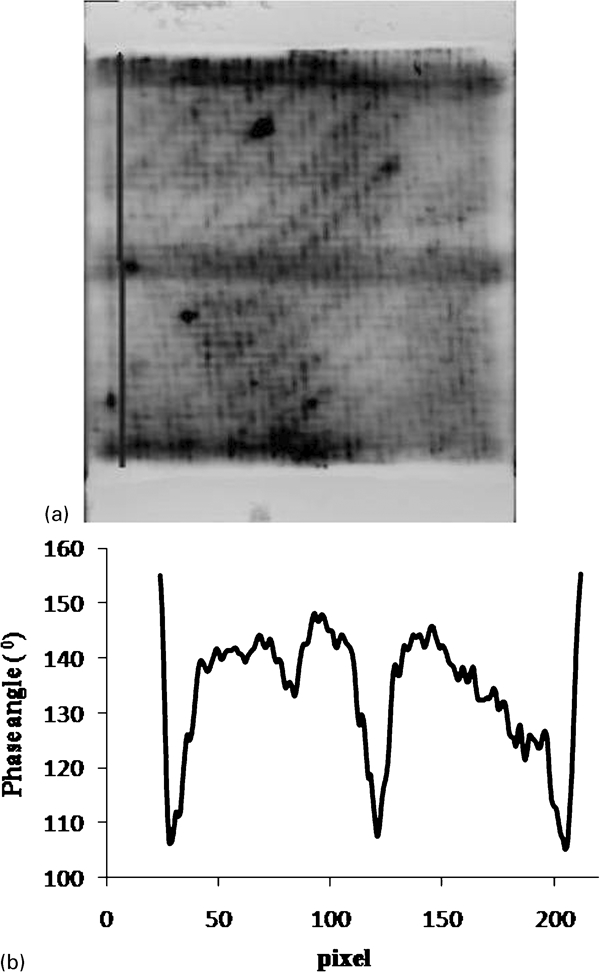
a phase image and b phase angle–pixel plots for CFRP patch on Al substrate
Lock-in thermography (offline)
The synchronisation of the camera with the heat source (optical excitation with lamps) resulted in the following phase image.
LT image of the CFRP patch is shown in Fig. 10a. Figure 10b depicts the phase angle–pixel variation along the straight line shown in Fig. 10a. A direct comparison with Fig. 9b indicates that although the signal/noise ratio is not improved, the resolving power of the method is better, as manifested by the shape and width of the defect trace in Fig. 10b.
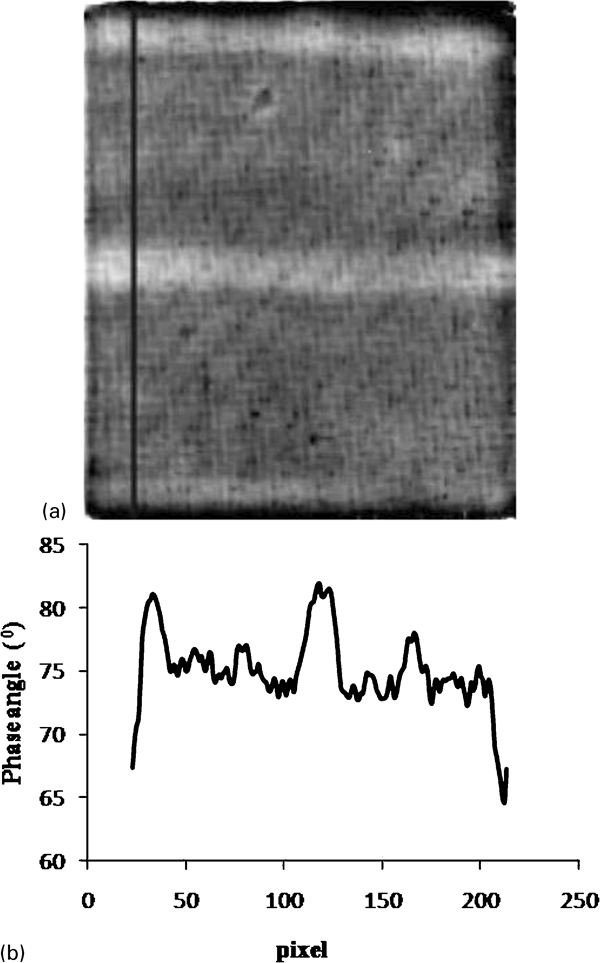
a phase image and b phase angle–pixel plots for CFRP patch on Al substrate
Lock-in thermography (online)
In the case of the online monitoring, no external heat source was employed. The cyclic mechanical loading served simultaneously for the thermal excitation of the specimen.
Thermographic images at specific fatigue cycles are presented in Fig. 11. Because of the low contrast, the debonding trace is delineated on the images in order to assist the reader. The arrows indicated the direction of damage propagation. PTFE inserts are presented with parallelograms. As is obvious, the debonding propagation is a two-dimensional process, and as a result, the trajectory method employed in the case of the offline monitoring cannot be applied. The delineated trace indicates a step change in the image intensity, which corresponds to the transition between the well bonded and debonded regions.
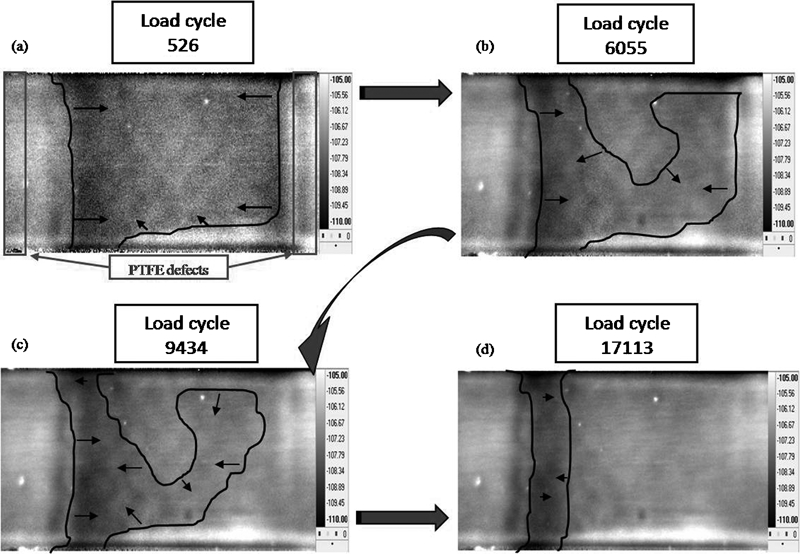
Critical failure of patch during fatigue loading
Figure 11 illustrates the sequence of the debonding process. At ∼526 cycles, the image is becoming lighter next to the inserts, which indicated the initiation of critical failure of the patch. The well bonded region remains dark. As fatigue loading continues, the image becomes brighter at the debonding front, i.e. after the starting crack (PTFE tape) and the edges of the specimen. At ∼17 000 cycles, only a small vertical dark region is present in the image. Further fatigue loading did not bring any change in the observed pattern. This is due to the fact that the bonded length is not enough to build up the shear stresses in order to further propagate the damage.
Conclusions
The objective of the present paper was to assess IrT as an effective non-destructive technique for the off- and online monitoring of the structural integrity of patched structures. The method was used for detecting artificial defects, which simulated debondings on composite structures, and for monitoring debonding or damage propagation during loading.
Good detection efficiency was achieved for all the specimens interrogated in this study, as all simulated delaminations were detected. Lock-in thermography performed best in the detection of the simulated disbonds in the CFRP patch system. In the case of PT, the PTFE inserts could not be seen clearly. Thus, PPT and LT were employed. From PT to PPT and then to LT method, one can observe the following: increase the detection capabilities of the method; interrogate deeper in the composite material with less energy; increase the resolution of the method.
Areas with defects exhibited higher temperatures than the defect free areas owing to a slower cooling down rate in the vicinity of the defect.
LT proved to be a reliable and efficient tool for the online monitoring of the integrity of the bonded repair. In this case, PTFE inserts were employed as debonding initiators. Well bonded areas appeared darker than debonded ones, and thus, the critical failure process could be monitored. As a result, the debonding process could be visualised as a bright front propagating for the edges of the specimen. At ∼17 000 cycles, no further damage was propagated. A small dark strip transverse to the loading axis indicated the well bonded region. This was due to the fact that the bonded CFRP patch length could not build up the necessary shear stresses to further propagate the separation. All the investigated specimens exhibited similar results.
To summarise, online LT was successfully employed to detect CFRP patch separation from Al substrates. The monitoring of the structure was performed in real time fatigue loading, which simultaneously served for the thermal excitation of the specimen. This demonstrates that IrT possesses a large potential as a method for the monitoring of the repair efficiency in aircraft structures as it provides a wide field, non-contact NDE methodology that can easily be applied on site.
Footnotes
Acknowledgements
The financial support from the EU (IAPETUS project, grant agreement no. ACP8-GA-2009-234333) is acknowledged.
This paper is part of a special issue on Latest developments in research on composite materials