
Abstract
A procedure is described for preparing polyamide-6 (PA-6) reinforced with cellulose nanofibres. The cellulose nanofibres were obtained from flax and microcrystalline cellulose (MCC) using combinations of acid hydrolysis, ball milling and ultrasound, then characterised by transmission electron microscopy (TEM) in order to determine their size and geometry. The nanofibres produced from the different feedstock sources were of a similar order with lengths ranging from 21 to 300 nm and diameters between 2 and 22 nm. PA-6 nanocomposite films were subsequently prepared from these nanofibres using a solution casting technique. Their chemical and physical structure was analysed using Fourier transform infrared analysis (FTIR) and TEM. Differential scanning calorimetry (DSC) and thermogravimetric analysis (TGA) were also applied to compare their thermal properties with unfilled polymer. Dynamic mechanical thermal analysis and tensile measurements demonstrated a significant enhancement in mechanical properties was possible with a low addition of cellulose nanofibres to the polymer matrix.
Introduction
This study considers the preparation of polyamide 6 (PA-6) composites reinforced with cellulose nanofibres. There have been many reports considering the determination of cellulose crystal modulus, which is generally stated to be in excess of 100 GPa. Tashiro and Kobayashi, for example, have obtained a theoretical elastic modulus of 167·5 GPa.1 In view of this exceptional property, their high aspect ratio and their large specific surface area, cellulose nanofibres have significant potential for the preparation of polymer composites. To this end, it has previously been established that cellulose nanofibres can give significant reinforcing effects in a range of polymers, including polyvinyl alcohol,2–4 polylactic acid,5 cellulose acetate butyrate,6 hydroxypropyl cellulose,7 starch8 and polysulfone.9 However, there are currently particular difficulties associated with effectively dispersing these nanoreinforcements into thermoplastics by melt mixing, due to their tendency to reagglomerate and their inherent thermal instability.10
There are also a number of different routes for preparing cellulose nanofibres from plant materials involving chemical and mechanical means or a combination of both.11 High shear mechanical processing tends to produce higher aspect ratio fibres than can be obtained by acid hydrolysis.12
In this work, cellulose nanofibres have been prepared by combination of methods involving ball milling, acid hydrolysis and ultrasound. The use of acid hydrolysis was first developed by Rånby and Ribi 13 , 14 who prepared stable suspensions of colloidal sized cellulose nanocrystals from cotton and wood using sulphuric acid. When cellulosic fibre is subjected to strong acid hydrolysis, the fibres break down to nanometre dimensions without weight loss. The sulphuric acid used also introduces negatively charged sulphate groups onto their surface by esterification.15 However, by contrast, use of hydrochloric acid yields minimal surface charge on the cellulose nanofibres. 16 , 17
Stable suspensions of cellulose nanofibres have been obtained in water, in N,N-dimethy-acetamide/lithium chloride, in dimethyl sulphoxide/paraformaldehyde and in N,N-dimethylformamide. 12 18 12,18,19 However, in the present study, formic acid was selected as the medium for nanofibre suspension because it is also a good solvent for PA-6. Furthermore, since formic acid functions as a protic solvent, it can disrupt the hydrogen bonding in aggregated cellulose whiskers more effectively dispersing them. Berg has also investigated cellulose nanofibre films produced from formic acid and found that formic acid resulted in esterification of the cellulose hydroxyl moieties.20
Cellulose nanofibres are distinctive from other nanoreinforcing fillers such as clay, carbon nanotubes and silica, being rod-like, hydrophilic, polar and temperature sensitive. This restricts the range of host polymers to which they can be added. Hence, in this investigation, PA-6 composite films were prepared using a solution casting technique and their morphology, structure, thermal and mechanical properties subsequently examined.
Experimental
Materials
Cellulose nanofibres were prepared from microcrystalline cellulose (MCC) (Asahi Kasei Chemical Corporation, Tokyo, Japan) and flax rovings (Linavabrik, Estonia). PA-6 (Capron BR30HS) was supplied by BASF. Formic (98%) and sulphuric acids (95–97%) were obtained from Fisher Scientific UK Ltd and Sigma-Aldrich Chemie GmbH respectively.
Preparation of cellulose nanofibres and reinforced PA-6 composites
Cellulose nanofibres derived from flax fibre and MCC were prepared using a combination of ball milling, acid hydrolysis and ultrasonic techniques. Decorticated flax fibres were first cut manually to lengths between 20 and 30 mm and then ground at 60 rev min−1 for 2 h in a planetary ball mill (PM100, Retsch UK). The MCC and flax fibres were then hydrolysed in sulphuric acid at 60°C for 50 min using the conditions listed in Table 1. Ultrasonic energy was applied to the mixture using a model 150T 150-W ultrasonic cleaner (VWR International, UK) for 30 min. The suspension was then centrifuged five times to remove excess acid (10 min at 9500 rev min−1) and the supernatant was removed from sediments and replaced by distilled water to retard further hydrolysis. Centrifugation was repeated until the supernatant became turbid followed by transfer into dialysis membrane tubes, with a molecular weight cutoff of 8000 Da and dialysed against tap water for 2 days until the pH of the suspension reached 7. This was then passed through Whatman Grade 41 quantitative filter paper to remove any remaining microparticles. The concentration of the dilute suspension was increased to 1 wt-% using a rotary evaporator (Bibby RE200; Sterillin Ltd, UK) for ∼1 h at 40°C.
Process conditions for preparation of cellulose nanofibres
*Sulphuric acid concentration in weight per cent (acid hydrolysis).
†Reaction temperature (acid hydrolysis).
‡Reaction time (acid hydrolysis).
§The ratio of acid to fibre pulp (acid hydrolysis).
¶Ball milling process.
#Ultrasonic treatment.
To prepare a PA-6 films, water was first added to dilute formic acid from 98 to 90 wt-%. A solution of 10% PA-6 in formic acid was then prepared and stirred for 1 h at 30°C. A 5 wt-% aqueous suspension of the cellulose nanofibres was then added to the PA-6 solution and stirred for a further 30 min. The final mixture was then cast onto a Petri disc and initially left in a vacuum oven at 85°C for 1 h to evaporate the solvent. Subsequently, the films formed were dried further in an oven at 50°C for 2 days and then stored at 23°C and 50% relative humidity before characterisation.
Morphology
The morphology of the cellulose nanofibres and PA-6 composites was studied using a Philips CM100 transmission electron microscope at an acceleration voltage of 100 kV. Firstly, a droplet of cellulose nanofibre suspension was put onto a copper grid coated with a thin carbon film and stained with a 1 wt-% solution of uranyl acetate for 30 s. The sample was then dipped in distilled water for 2 s to remove excess uranyl acetate.
The PA-6 composite films were cut into small strips (∼5 mm2) and embedded into epoxy resin, which was cured for 1 day at 60°C. Thin sections were then cut for analysis using an Ultracut-E Reichert-Jung ultramicrotome (Reichert, Austria).
Fourier transform infrared analysis (FTIR)
FTIR spectra of the composite films produced were obtained in transmission using a PerkinElmer Spectrum 1000 spectrometer (PerkinElmer Life and Analytical Sciences, Italy) using 64 scans over a frequency range between 500 and 4000 cm−1.
Mechanical properties
Tensile strength, modulus and elongation at break of the composite films were determined using an Instron 4411 universal testing machine (Instron, UK) fitted with a 2 kN load cell. The tests were carried out at 23°C using a crosshead speed of 50 mm min−1 according to ISO 527. At least 10 samples were taken for each determination after storage at 50% relative humidity (23°C).
Dynamic mechanical analysis (DMA)
Dynamic mechanical analysis of the unreinforced PA-6 and PA-6 nanocomposites films was undertaken in the tensile mode using a Triton DMA 2000 (Freiberg, Germany). For this purpose, the samples were prepared by cutting strips from the films with a width of 5 mm, followed by storage in an oven for 2 days at 55°C. Measurements were carried out between 30 and 160°C at a constant frequency of 1 Hz with 1 N preload, strain amplitude of 0·1%, heating rate of 5°C min−1 and gap distance of 5 mm.
Thermogravimetric analysis (TGA)
Dried cellulose samples were ground to a powder and tested using a Mettler Toledo STA 851e thermogravimetric analyser at a heating rate of 20°C min−1. The tests were carried out between 30 and 600°C in a nitrogen environment.
Differential scanning calorimetry (DSC)
Thermal properties of films produced were measured using a Perkin Elmer DSC 6 Modular Thermal Analyser (Wellesley, MA, USA). The samples were heated from 30 to 250°C, held for 2 min at this temperature, then cooled to 30°C, all at a rate of 10°C min−1.
Results and discussion
Morphology
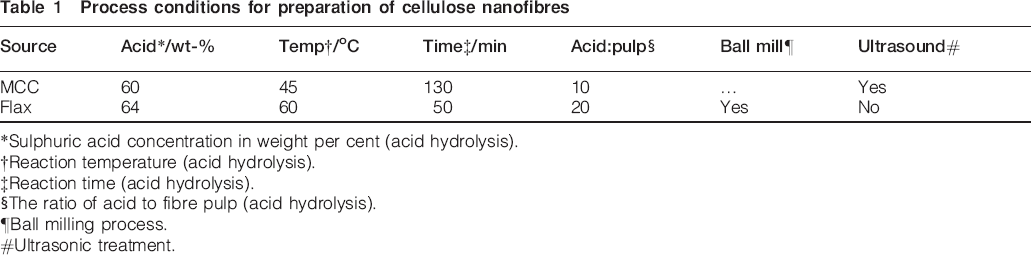
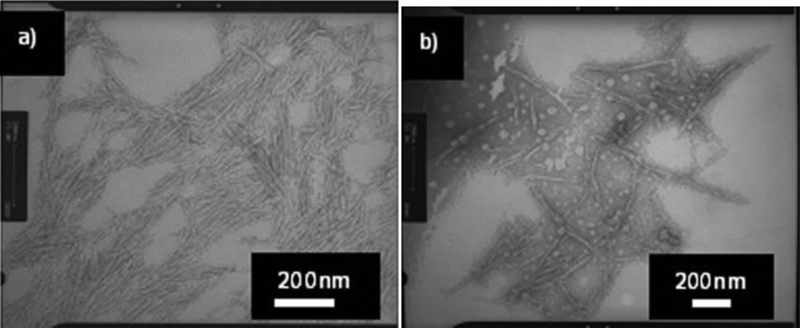
Figure 1 shows transmission electron microscopy (TEM) images of cellulose nanofibres prepared from MCC and decorticated flax fibres. Approximately 700 fibres were examined from representative TEM images and their size distributions were measured using image analysis software.12 For the MCC and flax nanofibres, lengths ranged from 21 to 350 nm and diameters were between 2 and 50 nm. The composite films produced retained transparency with the addition of 5 wt-% cellulose nanofibres to PA-6 (Fig. 2). This is indicative of their size being less than the wavelength of visible light and their good dispersion in the PA-6 matrix.7 The lack of fibre agglomeration and uniform fibre distribution is also verified in the TEM image shown in Fig. 3 for the PA-6/MMC nanofibre combination. However, analysis of fibre length distribution in the composite proved particularly challenging due to the lack of contrast between the nanofibre and PA-6 matrix and their random projection in this image.
Micrographs (TEM) of nanofibres made from a microcrystalline cellulose and b flax fibres
Transparency of films
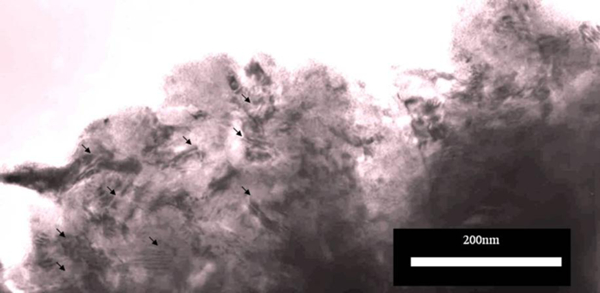
Micrographs (TEM) of PA-6/MCC nanofibres (arrows depict cellulose nanofibres)
FTIR analysis
FTIR spectra of PA-6 and PA-6 nanocomposite films are shown in Fig. 4 with the characteristic peaks labelled and principal absorptions summarised in Table 2. The PA-6 films show absorptions at 3303 cm−1 (stretching vibration of N–H), 2935 cm−1 (antisymmetric stretching vibration of CH2), 2860 cm−1 (symmetric stretching vibration of CH2), 1635 cm−1 (stretching vibration of C = O), 1539 cm−1 (in-plane deformation N–H and stretching vibration of C–N), 1465 cm−1 (in-plane deformation of CH2), 1276 cm−1 (in-plane deformation N–H and stretching vibration of C–N), 1200 cm−1 (wagging vibration of N–H and twisting vibration of CH2) and 690 cm−1 (out-of-plane deformation N–H and C = O).21
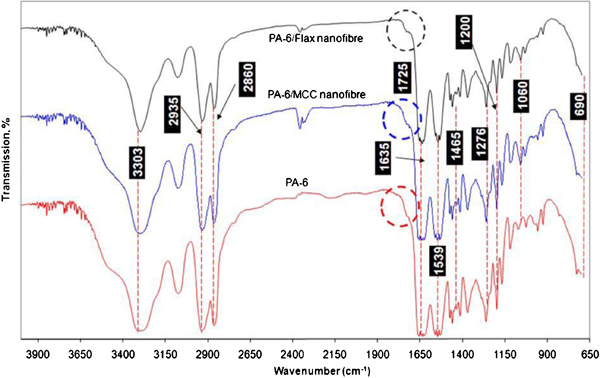
FTIR spectra of PA-6 and PA-6/nanocomposite films
Characteristic FTIR peaks for PA-6 films and PA-6/nanocomposites
ν: vibration; νa: antisymmetric stretching vibration; νs: symmetric stretching vibration; ω: wagging vibration; δ: in-plane deformation; γ: out-of-plane deformation; τ: twisting vibration.
The intensity of the peaks at ∼1060 cm−1 is significantly increased even at a low addition level of cellulose nanofibres in the PA-6 composite, resulting from the cellulose C–O stretching vibration. The shoulder at 1725 cm−1 corresponds to a C = O stretching vibration, which may result from a small degree of esterification of cellulose hydroxyl groups, as has been previously reported.20
DSC analysis
The melting behaviour and crystallisation temperature of the composite samples, processed PA-6 film and virgin PA-6 powder, were characterised by DSC, with results shown in Fig. 5 and principal thermal events summarised in Table 3. The presence of two distinct melting peaks displayed in the PA-6 film (Fig. 5a), corresponds to melting of γ and α phase crystals.22 These melting peaks have been designated as Tm,1 and Tm,2 respectively. The hydrogen bonded sheets are known to be parallel to each other in the γ phase and antiparallel in the α phase.23 It is also established that hydrogen bonding between chains in the antiparallel sheets makes the α phase the more thermodynamically stable crystalline form with melting occurring between 220 and 229°C. Melting of the less stable γ phase takes place between 195 and 219°C and is generally formed under particular circumstances, such as from fast cooling melts.24 In this work, the formation of the γ phase in the PA-6 film resulted from evaporation of formic acid, since rapid solvent loss prevents anti-parallel packing of hydrogen bonded sheets, leading to the formation of this metastable crystalline morphology. A mixture of α and γ phases was found in PA-6 and PA-6 nanocomposite films, but the γ melting peak became more distinct with the addition of cellulose nanofibre to the polymer. Previous reports have shown that filler particles with nanodimensions, including organoclay 25 , 26 and silica,27 can also promote the formation of γ crystals.
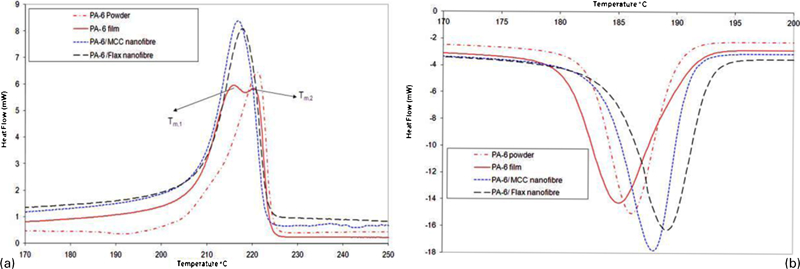
DSC thermograms of PA-6 samples
Summary of DSC results
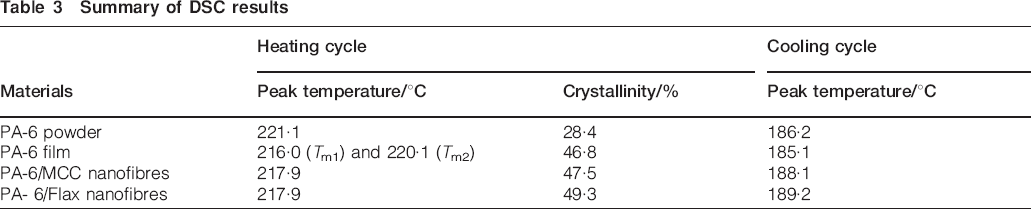
On cooling, the unmodified PA-6 film had a peak crystallisation temperature at 185°C, whereas with the PA-6 containing MCC and flax nanofibres, this occurred at 188 and 189°C respectively. This slightly increased crystallisation temperature is attributed to enhanced nucleation by the cellulose nanofibre. This is supported by the observation that crystal morphology of the PA-6 became much finer in the presence of cellulose nanofibre.12 Furthermore, inclusion of cellulose nanofibre results in a slight increase in overall crystallinity of the PA-6 composite (Table 3).
TGA
The influence of the cellulose nanofibre on thermal stability of the PA-6 was characterised by TGA in a nitrogen atmosphere. A single degradation stage was observed in the TG curve, which is illustrated more clearly in the corresponding DTG curve (Fig. 6). At ∼5% weight loss, the rate of decomposition of the PA-6 nanocomposites increased significantly, preceding unfilled PA-6 by ∼45°C. Furthermore broad DTG peaks from decomposition of cellulose nanofibres are located at 300 and 220°C. During degradation, cellulose releases many combustible volatiles including: acetaldehyde, propenal, methanol, butanedione and acetic acid, which contribute to the increase in decomposition rate seen in the composites.28 It is also possible that the presence of such volatiles may prodegrade the polymer.
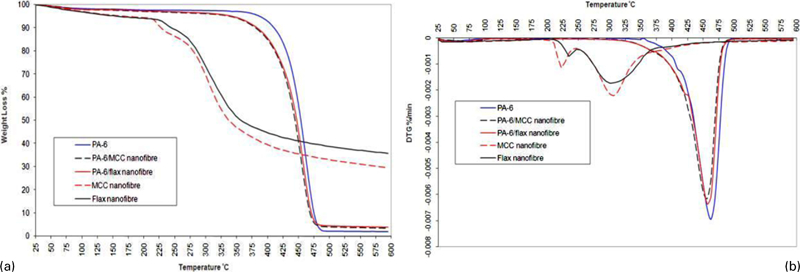
TGA curves (a) and DTG curves (b) for PA-6 films and PA-6 nanocomposites (under nitrogen)
Table 4 shows the residual water content, char residue at 550°C, decomposition onset temperature and the maximum temperature of the derivative thermogravimetric (DTG) curves. There is an increase in char residue observed in the nanocomposites compared to unfilled PA-6, resulting from the char forming qualities of cellulose and in particular the high surface area of the nanofibres.29–31 This was further verified in DTG curves, as seen in Fig. 6b. The first degradation peak of cellulose nanofibre was located at the region of 220°C, which is much lower than the decomposition peak of a typical PA-6, at ∼464°C.
Summary of TGA data
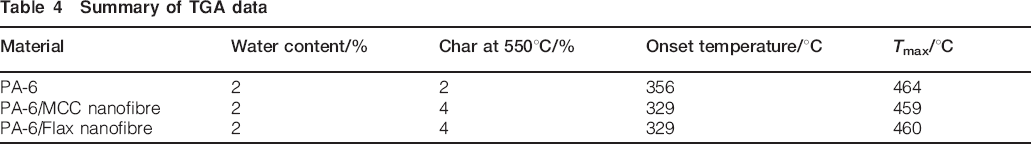
The DTG results confirm the deleterious effects of the cellulose nanofibre on thermal stability of the PA-6 composites discussed above. The PA-6 film showed an onset decomposition temperature at 356°C, whereas both the PA-6 composites began decomposition at ∼329°C. Furthermore, the main DTG peak for PA-6 occurred at 464°C, whereas for the PA-6/MCC and PA-6/Flax nanofibres, this was apparent at 459 and 460°C respectively.
Mechanical properties
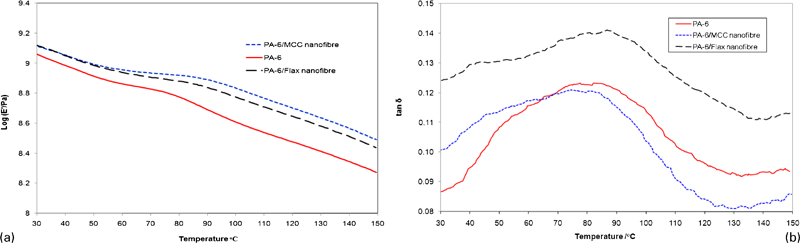
Figure 7 shows the temperature dependency, between 30 and 150°C, of storage modulus E′ and tan δ for the unmodified PA-6, and its composites containing 5 wt-%MCC and flax nanofibres. Results obtained at specific temperatures are also compared in Table 5.
DMA results of PA-6 composites films containing 5 wt-% of cellulose nanofibres (acid hydrolysis): samples are tested after drying
DMA results of PA-6 composites containing 5 wt-% of cellulose nanofibres (acid hydrolysis)
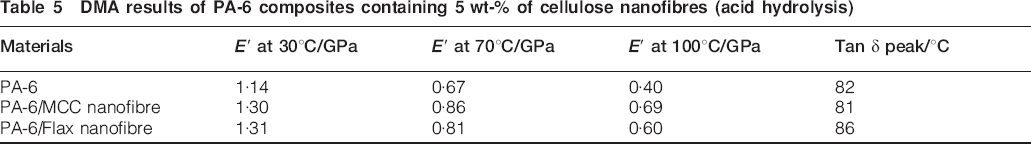
Compared to the unreinforced PA-6, E′ for the PA-6 composites was significantly enhanced within the selected temperature range. This supports the assertion discussed previously ( Figure 2 Figs. 2 and 3) that the cellulose nanofibres are homogeneously dispersed in the polymer, and suggests strong interfacial bonding and effective load transfer between the matrix and reinforcement. Enhanced interaction, through hydrogen bonding, would be expected between these polar phases.32
The glass transition temperature Tg for the PA-6 film occurs at ∼82°C, which is consistent with a previous report.26 However, the tan δ curves show that the Tg did not change significantly in PA-6 with the addition of cellulose nanofibres. This may be related to the preferential formation of the less stable γ structure in PA-6 nanocomposites, as discussed earlier in relation to the DSC results.
It was observed that the PA-6 composites gave only a slight increase in their storage modulus at a temperature below their Tg. At 30°C, the PA-6/MCC and PA-6/flax nanofibre composites showed only a 14 and 15% improvement, compared to the PA-6 control. However, at 100°C above the Tg, this increased to 73 and 50% for PA-6/MCC nanofibre and PA-6/flax nanofibre respectively. This effect is considered to result from the dominant effect of a three-dimensional cellulose nanofibrous network present in the rubbery matrix.33
The tensile strength and modulus of the various PA-6 films are compared in Fig. 8. It is evident that the tensile strength at break strength of PA-6 nanocomposites is improved by ∼100% with addition of only 5 wt-% cellulose nanofibres. Again, this is attributed to the uniform dispersion and high surface area of the fibres and strong interaction between the cellulose nanofibres and PA-6, promoting effective stress transfer. The tensile modulus shows a corresponding improvement of ∼30% with addition of nanofibres. However, these results may also be influenced by the formation of the metastable, γ crystalline structure in the PA-6 composites films. As reported previously, the PA-6 contains more α crystal phase, which would be expected to yield better mechanical properties.22
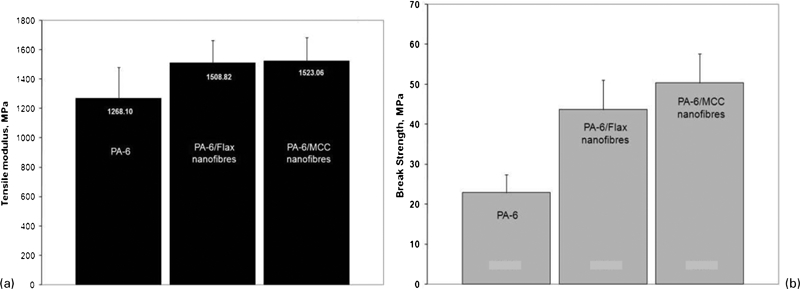
Tensile properties of PA-6 composites films with addition of 5 wt-% nanofibres: a tensile modulus; b tensile strength at break
Conclusions
This study has demonstrated the viability of casting PA-6 nanocomposites using aqueous suspensions of MCC and flax nanofibres fibres in combination with a solution of PA-6 in formic acid. MCC and flax nanofibres made using an acid hydrolysis procedure had lengths ranging from 21 to 350 nm and diameters between 2 and 50 nm. Direct observation by TEM and the high transparency of the composite films demonstrated effective dispersion of the nanofibres in the PA-6 matrix. DSC results showed that the presence of the nanofibre promotes the formation of γ crystals, an increase in crystal nucleation rate and overall crystallinity of the PA-6. A substantial improvement in mechanical properties was seen by incorporation of only 5 wt-% of either nanofibre to the PA-6, both at room and elevated temperatures, but inclusion of these additives reduced the overall thermal stability of the composite.
Footnotes
Acknowledgements
The authors are grateful to Professor S. Sharma and Dr. G. Lyons from the Agri-Food and Bioscience Institute, Belfast, UK, for provision of the flax feedstock used in this study and for their helpful suggestions during the course of this work.
This paper is part of a special issue on Latest developments in research on composite materials