
Abstract
Life extension of aging aircraft with adhesively bonded repair patches has received significant interest over the last 10–15 years. This repair method has several advantages over riveted patches since it introduces lower stresses in the repaired area and reduces weight. It is a promising repair technique, which can be also applied to composites, where the load transfer paths through mechanical fasteners can cause local damage. However, patch debonding might occur when the structure is loaded, and the damage might continue propagating in the substrate. As a result, a robust structural health monitoring system needs to be designed and implemented in order to continuously assess the integrity of the repaired area. This paper illustrates the non-destructive inspection with Lamb waves of a repaired aluminium flat plate with a bonded external patch. The damage developed was assessed with outlier analysis, which is a pattern recognition method.
Keywords
Introduction
Composite repair patches
Research for composite repair patches as a repair method in many industries, such as aerospace, automotive and marine, has received considerable interest. In the aircraft industry, bonded composite patches are being increasingly used to ensure the extension of the operational life especially of aging aircrafts.1 It is estimated that currently ∼30% of the worldwide fleet is over 15 years in age, which highlights the importance of new aircraft maintenance methodologies in order to avoid catastrophic failures caused most commonly by fatigue and corrosion damage.
Composite bonded repair patches offer many advantages over traditional mechanically fastened doubler and provide a more reliable and cost effective repair method. Especially when considering composite structures (A380, Boeing 787), mechanical fastening can cut fibres and cause further damage due to the undesirable stress concentration. In addition, low velocity impact in composite airframes can introduce internal damage in the form of resin cracking and delamination that is difficult to detect. This type of damage is generally referred to as barely visible impact damage. As illustrated in Fig. 1, four areas of no adhesion were introduced between the substrate and the first patch ply in a five-ply patch, which was impregnated and cured on a composite substrate. As it is clearly observed from the picture of the repaired configuration, no visible damage can be detected. However, ultrasonic C-scan testing was performed, which confirmed the extensive damaged areas underneath the surface.
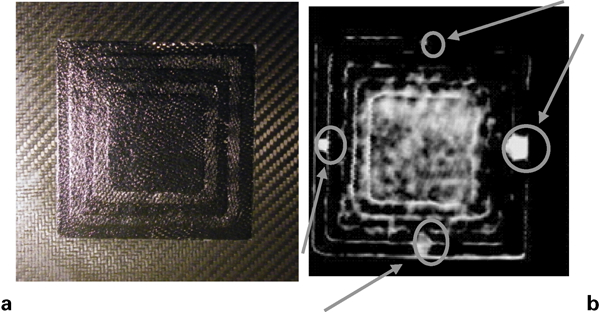
Composite patch bonded on composite substrate with preintroduced damage
According to Baker and Jones,2 the contribution of composite patches to structural integrity leads to increased stiffness, less stress intensity and improved tolerance. Moreover, composite patches are suitable for temporary repair (emergency or field repair), which ensures the life extension of the aircraft until a permanent repair can be carried out.3 The damaged area is removed, the surface is properly prepared and the patch is bonded. Two techniques are used to ensure the increase in fatigue life: double sided repair and single sided repair. For the current research, single sided repair was considered. So far, boron–epoxy bonded patches have been extensively used by the researchers to repair cracks and to reinforce weak points.4
In recent years, researchers have become increasingly interested in problems related to repair patches, such as the high risk of debonding between the patch and the substrate,4 which might occur if the ultimate shear strain of the adhesive is exceeded. Moreover, the rate at which the stress intensity factor of the crack tip increases under loading might exceed the threshold, resulting in failure. In addition, failure might be caused by the peel stresses introduced at the ends of the patch. The thickness of the patch is of high importance since it can fail under bending stresses if it is too thin. Finally, surface preparation before bonding should ensure an efficient bond, which will be able to carry the loads efficiently. Extensive research on the design and performance of external composite patch repairs has been carried out by Soutis et al.3,5–7
Recent interest has been focused on the continuous life cycle health monitoring of the repaired site, which will ensure the reliability of the repair and will avoid any unexpected failure. A key point that makes such health monitoring systems necessary in this repair methodology is the increase in portability, which will eliminate any restrictions like the removal of parts for laboratory testing. Health monitoring systems that involve smart layers inserted into a patch at different plies are becoming a rather promising method for in service health monitoring. In a recent work,7 two smart layers with an embedded network of piezoelectric actuators/sensors were inserted into a boron–epoxy laminated patch at different ply locations to monitor successfully crack growth via Lamb wave excitation.
Non-destructive inspection with Lamb waves
Inspection with Lamb waves is currently considered to be one of the most promising structural health monitoring (SHM) techniques for aluminium and composite structures in comparison with the more traditional non-destructive techniques, which are more difficult to be applied in complex configurations. 8 , 9 One of its great advantages is that Lamb waves can propagate through long distances. The whole thickness of the structure can be excited by small and light transducers, which require little power. Those can be wireless, targeting online continuous health monitoring. A comprehensive review of the basic concept of Lamb waves can be found in the literature.10 A brief summary will be given here.
Lamb waves are elastic perturbations propagating in solid plates with free boundaries. Those perturbations are a combination of both longitudinal and shear motion waves. Longitudinal waves propagate parallel to the direction of the particle's motion, whereas shear (transverse) waves propagate perpendicular to the particle's motion. Lamb waves propagate in two fundamental propagation modes: the symmetric Sn and the antisymmetric An (Fig. 2).
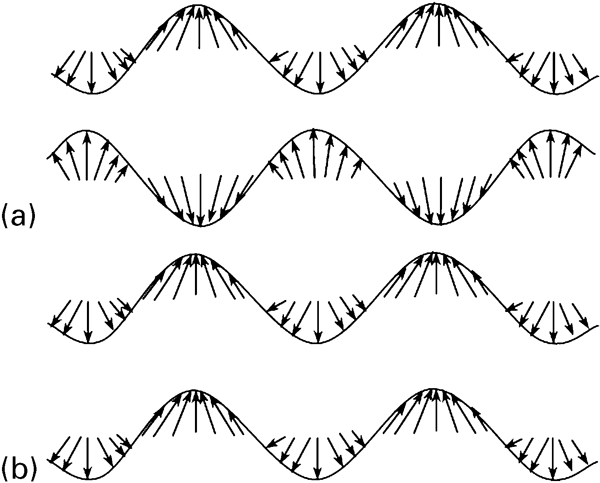
Lamb wave modes11
The fundamental principle of guided and bulky waves is that they are described by the same partial differential equations. The only basic difference is that the equations of the guided waves should satisfy the boundary conditions, which makes it very difficult to solve analytically.
The mathematical model on which the fundamental concepts of Lamb waves are established is based on the following geometry (Fig. 3): a solid medium bounded by two parallel planes at distance 2d apart.12 The direction of the propagation is assumed to be along the x direction. From this model, the equations of the symmetric and antisymmetric modes can be derived. The symmetric solutions are given by the in plane displacement u, which is an even function of z, i.e. u(z) = u(−z). The antisymmetric solutions are given by the displacement u, which is an odd function of z, i.e. u(−z) = −u(z).
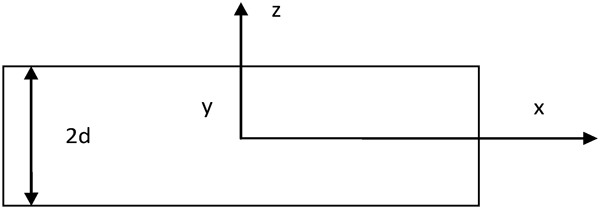
Coordinate system for Lamb waves in plate12
Symmetric modes


If we take into consideration that σxz = σzz = 0 when z = ±d/2, then equations (1)–(4) only have non-trivial solutions if two characteristic solutions are satisfied12
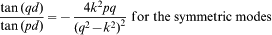
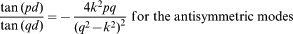
The second observation is that equations (6) and (7) are transcendental, and as the value of the frequency–thickness product increases, the two equations might have any number of real solutions.14 Each different velocity corresponds to different modes. Therefore, a large number of modes can be excited with Lamb waves. This is undesirable especially when considering complex structures because it can make the acquired data difficult to interpret. Each mode travels in the structure with a different velocity, and as a result, the obtained response signal will arrive at different times. For this reason, in SHM applications with Lamb waves, it is attempted to isolate only the two fundamental excitation modes A0 and S0 (one symmetrical and one antisymmetrical). Those modes can be excited in low frequencies under a certain threshold, which is referred to as cutoff frequency. In practice, this can be accomplished with a wedge transducer. This transducer excites a desired wavelength of Lamb waves of a given phase velocity at the frequency of excitation.15 The angle of the transducer is calculated according to the phase velocity. Figure 4 illustrates the excitation of Lamb waves with specific phase velocity by a wedge transducer, which is placed on the tested surface with a specific angle.
Wedge transducer: excitation of Lamb waves in real structures
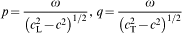
The incident angle given the longitudinal velocity of the propagating Lamb wave can be calculated by the following expression

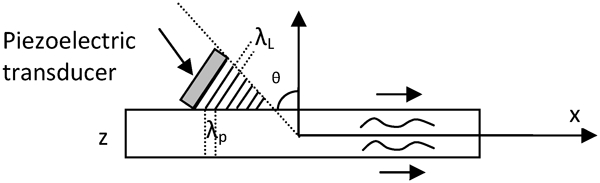
The phase and group velocities are two fundamental characteristics of Lamb waves, and damage can be detected by means of variation in these velocities. The phase velocity is perhaps the most important variable for Lamb waves since when this velocity is known, then the wave number can be determined, and stresses and displacements in the Lamb wave at any point can be calculated.10 In other words, the phase velocity is referred to as the velocity of a wave with a single frequency (Fig. 5).
Phase velocity of aluminium
In reality, this is highly impossible since the excitation signal is a wave packet (transient signal in the form of a pulse), which includes a spectrum of frequencies. In order to approach this problem, the group velocity is introduced (Fig. 6). The group velocity is the speed with which the amplitude of the wavelength travels in the structure. It can be derived from the phase velocity c and the wavelength λ by the following equation

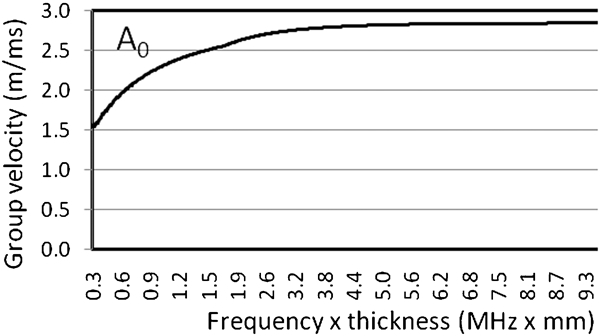
Group velocity of aluminium
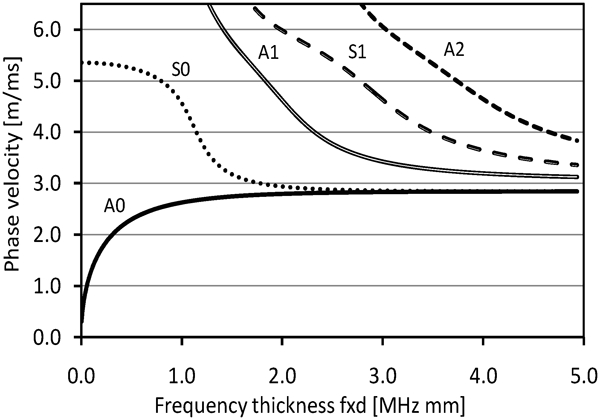
Dispersion curves for aluminium for given longitudinal (6·42 m ms−1) and transversal (3·04 m ms−1) velocities (numerical data generated with Vallen dispersion)18
The selection of the excitation signal in Lamb waves is a rather challenging task because of the dispersive behaviour of the Lamb waves and the excitation of multiple modes. However, there is a procedure that can ensure the selection of the excitation signal that can give clearer results. First of all, to ensure the excitation of just the two fundamental modes A0 and S0, the excitation frequency should be below the cutoff frequency, limit above which higher order modes start propagating, as shown in Fig. 7. Moreover, in order to minimise the dispersion behaviour of the waves, the limitation of the excitation bandwidth is significantly important. To achieve this, a method that is called windowing is applied. Windowing has two important applications: one is to reduce the magnitude of the undesired sidelobes, and the other is to increase the magnitude of the main lobe.
Damage assessment with outlier analysis
Outlier analysis is an algorithm that, for the SHM cases, is applied to the data obtained from the monitored system and statistically determines whether the system belongs to a damaged state or not. The aim of the method is to detect possible outliers. Outliers are values that come from the data and that seem to be very different from the rest of it. As a result, it is assumed that they might indicate damage. Outlier analysis can be implemented both for univariate and multivariate data. The procedure followed could be summarised in the following steps:16
first of all, data from the normal condition of the system are obtained, and the features of interest are extracted (univariate or multivariate)
then, Gaussian distributions are generated for the obtained data. For univariate data, calculation of the mean value and the standard deviation value is required (
 and s respectively). For multivariate data, calculation of the mean value and the covariance matrix is required (
 and S respectively)
training data are obtained from the system, and the same features are extracted as for the normal condition
the discordancy value is calculated, and its value is compared with a statistically calculated threshold. If the discordancy value is higher than the threshold, then the observation is an outlier, which means that damage is present.
Equation (10) represents the discordancy value distance for univariate data in which
 is the mean value of the normal data, s is the value of the standard deviation of the normal data and xζ is the value of the potential outlier


 is the mean value of the normal data, S is the covariance matrix value and xζ is the value of the potential outlier.17
This method has a significant advantage over the other pattern recognition methods because it can be implemented with unsupervised learning. This means that only readings from the normal condition are required and not for all damage classes. This method is very promising and easy to implement. However, it has not been systematically established for damage detection purposes yet.16
Objective and outline
The scope of the current work was the inspection of an aluminium plate repaired configuration with Lamb waves, which provides a good understanding of the mechanisms taking place while damage is growing under loading. This is the first step of a continuing research on health monitoring in composite repaired structures, which will set the benchmark of the applied methods’ efficiency in a more simplistic version. The steps that were followed were, first, the introduction of damage on an aircraft aluminium specimen, then the repair of the damage with an aluminium patch and finally cycling of the repaired structure in order to evaluate its structural integrity. The experiment was divided into two parts. The aim of the first part was the detection of a hole drilled in the middle of the specimen and notches, which were introduced at either side of the hole. These were considered as a primer level of damage, while the tested specimen was under static loading. At the same time, outlier analysis was selected as a proper pattern recognition method in order to detect the different levels of damage.
After this step and after the evaluation of Lamb waves and outlier analysis as inspection and pattern recognition methods respectively for this simple damaged case, the aluminium patch was bonded on the structure, thus simulating the promising repair method of bonded repair patches on aircraft structures. Then, the structure was cycled until a significant level of damage was observed. Two cracks propagated across the specimen width at either side of the hole (Fig. 8), and considerable debonding of the repair patch took place.
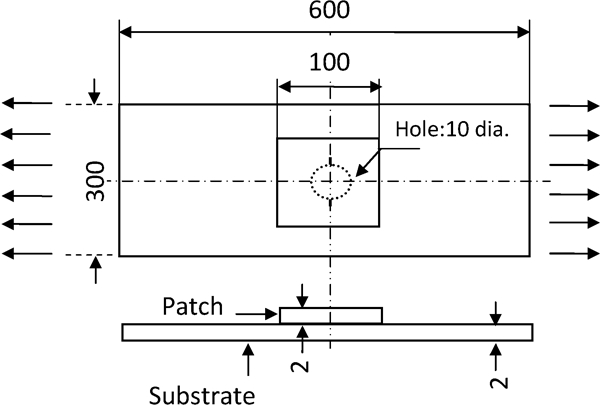
Geometry of repaired structure: dimensions in mm
Experimental
Experimental apparatus
For the purpose of the experiment, piezoelectric transducers (PZTs) were selected. These sensors can operate as both transmitters and receivers by converting electrical energy into mechanical energy and vice versa, and it has been shown that they can successfully excite the desirable modes of Lamb waves.19 When they operate as transducers, the electrical energy generates strains on the specimen surface due to the coupling of the element to the structure, and forces and moments are induced in the bonded area of the structure, generating elastic waves.20 When they operate as receivers, the strains and stresses of the specimen generate voltage on the piezoelectric element.
The PZTs supplied by Ceram Tec AG (Germany) were used for the generation and reception of Lamb waves (diameter, 10 mm; thickness, 1 mm). The PZTs were mounted on the surface of the specimen with instant glue, operating in pitch catch mode. Overall, eight PZTs were bonded on the plate, four of which operated as actuators and the rest as sensors/receivers. The position of the transducers was decided to be as close as possible to the patch, forming 16 propagation paths, as illustrated in Fig. 9. The input signal was generated by a TTi TGA1230 30 MHz wave generator. The data acquisition was performed by a LeCroy LT224 oscilloscope.
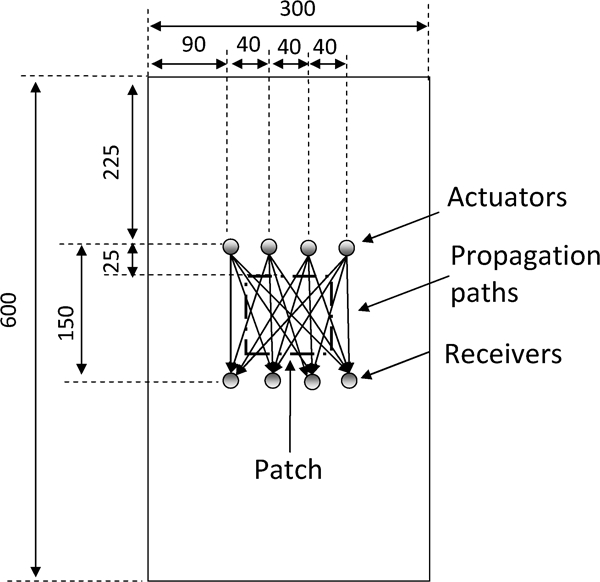
Geometry with bonded transducers: dimensions in mm
The material selected for the experiment was aircraft aluminium 2024-0. The purpose of this experiment was to approach as much as possible the actual behaviour of aircraft materials. As a result, aluminium 2024-0 was selected. The dimensions of the aluminium specimen were 600×300×2 mm. For Lamb waves to exhibit less dispersive behaviour, large dimensions are required. At the same time, the dimensions should not exceed the size restrictions of the fatigue machine for cycling. Therefore, a combination of the sufficient size for Lamb wave inspection and of the fatigue machine restrictions was selected. The hole and notches introduced to the plate were 10 and 2 mm respectively. The patch that was bonded on the hole was of the same type of aluminium, and its dimensions were 100×100×2 mm, as illustrated in Fig. 8. The glue used for the bonding of the patch was Araldite Precision of 24 mL, distributed by Bostik Limited, UK.
Mode selection and input signal
For the excitation of the Lamb waves, a five-cycle sine burst signal was selected. The input signal was modulated with a Hanning window in order to achieve a narrowband frequency spectrum. The peak to peak amplitude of the input signal was 10 V, and the sampling frequency was 10 MS s−1. The dispersion curves for aluminium were derived (Fig. 7) in order to ensure that the excitation frequency would be below the cutoff frequency and that only the two fundamental modes S0 and A0 would be excited. The excitation frequency was 240 kHz.
Pattern recognition
For outlier analysis, seven features that corresponded to different parts of the waveform were extracted and then compared. The mean vector and the covariance matrix were calculated from the undamaged set of data. For this purpose, 100 readings were taken for all the propagation paths. Of those readings, the first 10 were used for validation purposes of the plot, and the rest were used for the calculation of the mean vector and covariance matrix. For each damage set of data, 10 readings were taken. The threshold value for a 100-observation 50-dimensional problem was calculated with the Monte Carlo method16 and was found to be 426 (99·9%).
Results and discussion
Static experiment
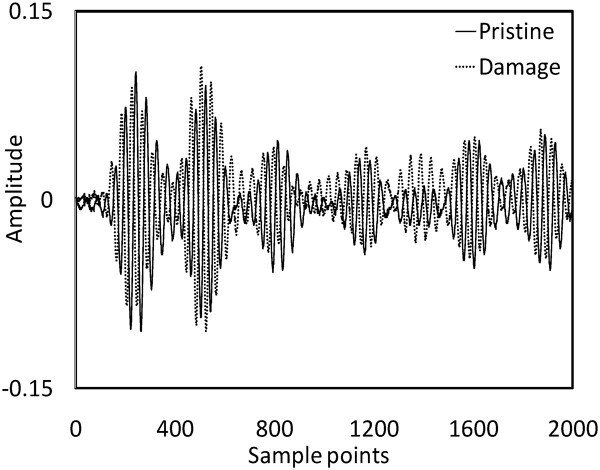
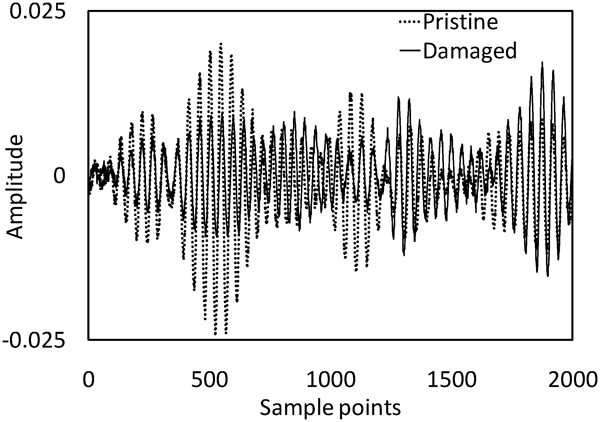
The excitation signal and a typical response signal are illustrated in Fig. 10. In this figure, the S0 and A0 modes are also illustrated. The S0 mode travels faster than A0, so it is assumed that the first wave packet corresponds to S0, whereas the second one corresponds to A0. In Fig. 11, the differences in the response signal between the pristine and damaged structures are illustrated. The differences in amplitude and slight phase change are clearly observed as a result of the signal energy dissipation over the damage.
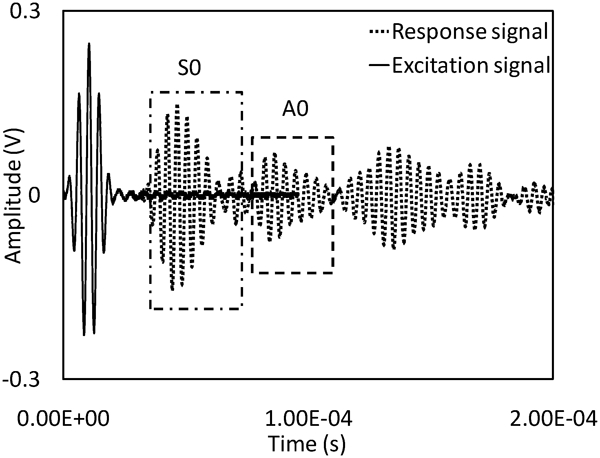
Comparison between excitation signal (properly scaled 1∶30) and response signal of pristine specimen
Response of unrepaired structure with hole in middle of plate
In Fig. 12, the outlier analysis results are shown for feature 1. As it can be observed, all the undamaged set points are labelled as inliers, and the damaged set points are labelled as outliers. The discordancy value of the damaged set with the hole is considerably higher than the threshold, as expected, and the discordancy value of the set data with the hole and the set data with the hole–notches does not differ significantly.
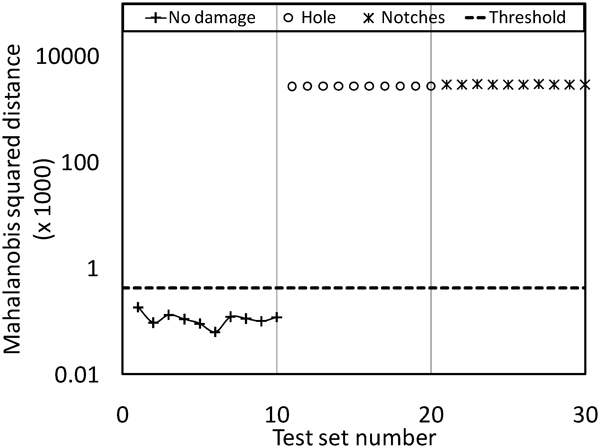
Outlier analysis results for static loading (first damage case)
Cycling experiment
In the second part of the current work, the repaired structure was cycled up to 70 655 cycles, as illustrated in Fig. 13. The reason why the number of cycles did not go up to higher values was purely due to the rapid crack growth rate that was observed after 70 000 cycles and that would eventually lead to rapid complete failure. For the fatigue test, the specimen was constantly under pretension of 40 kN, and the cycling load was 10–70 kN. Figure 14
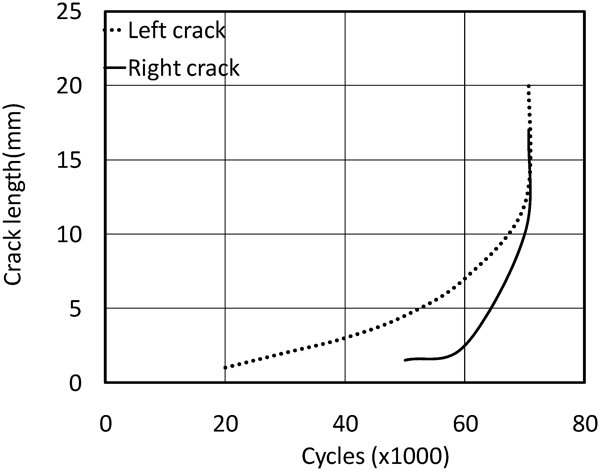
Crack propagation curve of aluminium substrate
Response of repaired structure after 20 000 cycles
The frequency of the cyclic loading was 3 Hz. After 20 000 cycles, a crack initiated at the side of the left notch and started propagating along the specimen. After 50 000 cycles, a second crack initiated at the side of the right notch, as illustrated in Fig. 13. In Fig. 14, the response of the repaired structure after 20 000 cycles is illustrated. The change in the response signal due to damage initiation is observed (mainly changes of amplitude in the first wave packages).
Final damage state due to crack propagation as captured at back side of specimen (cracks propagating on substrate below patch)
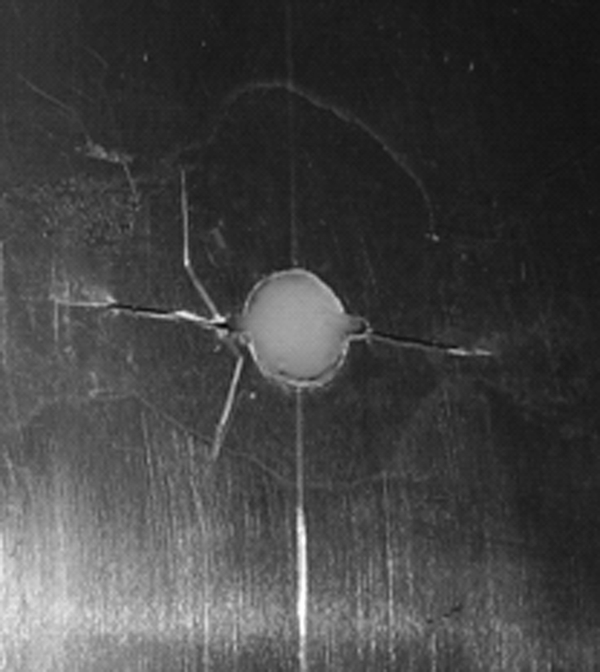
As mentioned in the ‘Introduction’, the aim of the project was to detect the increasing damage of the structure under cycling. For the current experimental set-up, a microscope was used as monitoring equipment. The first observation after visual inspection was that slight cracks initiated on the adhesive around the patch after 20 000 cycles. As the number of cycles increased, cracks that initiated around the tips of the notches further propagated resulting in extensive damage on the substrate as illustrated in Fig. 15. After 60 000 cycles, debonding was observed at one side of the patch (Fig. 16). The basic assumption is that this debonding was a result of cycling along with crack propagation in the adhesive with simultaneous propagation of cracks underneath the patch.
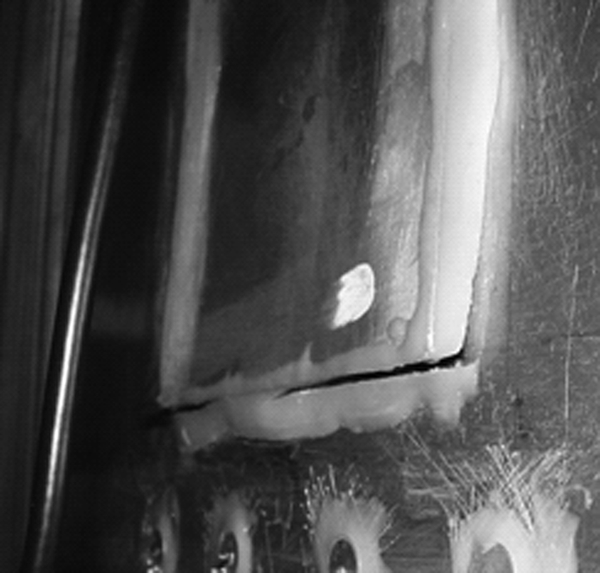
Final damage state due to debonding
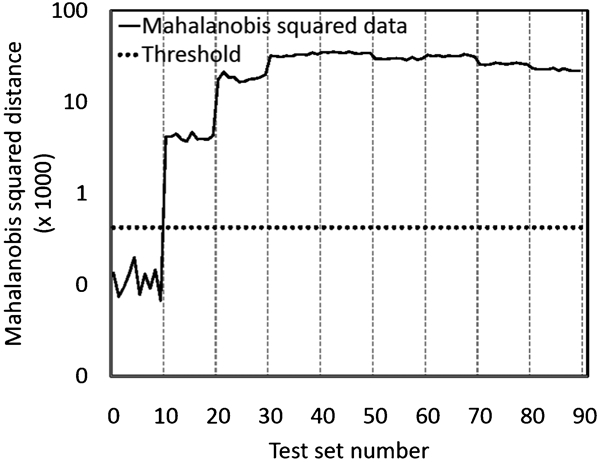
According to Fig. 17, all the damage cases that correspond to the introduced damage after every set of cycling were successfully labelled as outliers, and the normal condition data were labelled as inliers. In general, an increase in the value of the Mahalanobis distance is observed as the number of fatigue cycles increases. It is important to mention at this point that every set of test numbers corresponds to a different cycling number, as illustrated in Table 1.
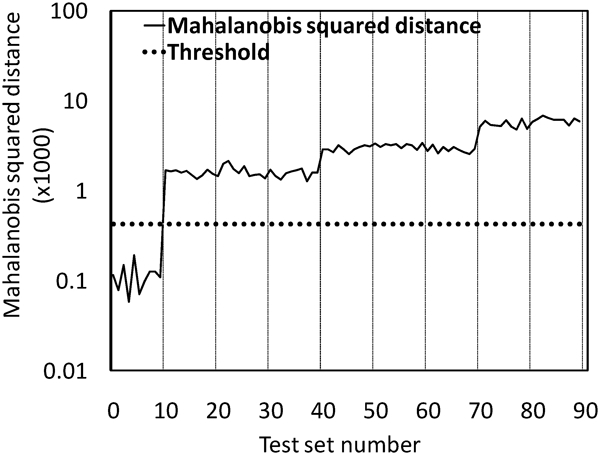
Outlier analysis results for different sets of cycling
Test set numbers and cycles
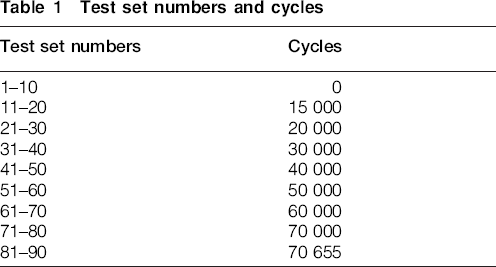
It is important to point out that in some combinations of propagation paths and tested features, there was a slight decrease in the value of the Mahalanobis squared distance after 70 000 cycles, as illustrated in Fig. 18. This is attributed to the significant damage that is taking place after this number of cycles, which in turn results in multiple Lamb wave reflections by the boundaries of the propagating damage. The effect of these modes on the response signal is a considerable phase shift, which, in some cases, makes the damage signal to shift by a whole cycle and in the end to oscillate in phase with the undamaged one (Fig. 19). In this case, the outlier analysis algorithm recognises the signal as closer to the undamaged condition, the deviation value of this specific test set from the mean value of the undamaged data decreases and, as a result, the Mahalanobis distance drops.
Decrease in Mahalanobis squared distance after extensive damage due to phase shift
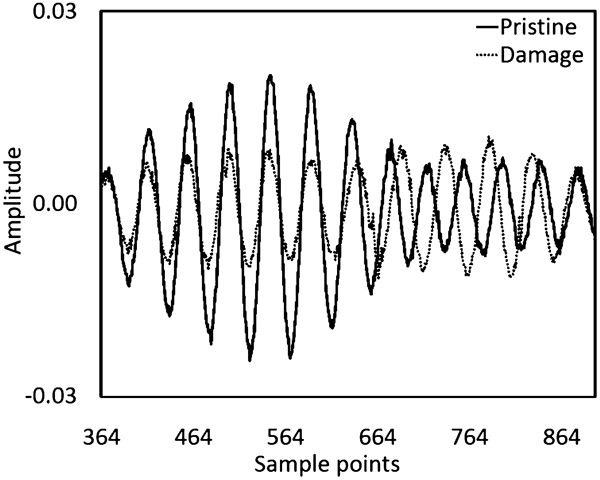
Phase shift after 70 655 cycles
Overall, almost all the different features and propagation paths showed consistent results with some slight differences, which could be due to various reasons, such as noise and environmental interference with the response signal. Outlier analysis is successful in detecting that there is a damage developing in the structure, but it fails to locate the exact type and size. Moreover, it can be considered as a reliable tool for the very early stages of damage growth before multiple modes start propagating through the tested structure. It is an easy to implement algorithm, which can provide reliable first information of the structural integrity.
Conclusions
The aim of the present work was to study the detection of damage in a patch repaired aluminium plate using Lamb waves that can also be applied to composite bonded repairs. The work consisted of two parts. The first part introduced a first level of damage in the structure, which was further subjected to static loading. In the second part, the repair patch was bonded on the damage, and the specimen was subjected to low frequency tension–tension cyclic loading until a considerable debonding was observed. The Lamb waves were generated by PZTs for damage monitoring. The response signals were properly processed for all the propagation paths, and different features were selected. Outlier analysis was chosen as an appropriate damage assessment algorithm, which was performed for all the different features.
The results showed that the Lamb waves propagated through the structure and excited signals, which were easy to interpret and absolutely consistent with the introduced damage. Moreover, all the propagation paths proved to be damage sensitive, making the reduction in the number of transducers possible. Outlier analysis showed that all the damage points were labelled as outliers and all the undamaged state points were labelled as inliers. This work highlighted the challenges involved in designing monitoring systems for complicated structures and the importance in examining the behaviour of repair patches under loading since its application on aircraft structures is becoming increasingly important. Other damage inspection methods that could be applied to composite structures can be found in a recent review paper by Soutis et al.21
Future research will focus on more elaborate methods of signal processing analysis, which will exploit the instantaneous properties of the response signals for all the damage cases, and the results will be correlated with the current analysis.
Footnotes
Acknowledgements
The authors would like to acknowledge the financial support from the EU seventh Framework Programme (grant no. ACP8-GA-2009-234333), innovative repair of aerospace structures with curing optimisation and life cycle monitoring abilities (IAPETUS).
This paper is part of a special issue on Durability of composite systems