
Abstract
A simple method for locating optimal positions for UV lamps used in the curing of curvilinear composite components manufactured with the resin infusion between double flexible tooling process is proposed. A multivariate optimisation model, consisting of continuously differentiable and two-dimensional integral domain parts, was developed. This model has UV lamp positions, dimensions of the manufactured composite component and UV power source as input parameters. The optimum positions of the UV lamps are the output. The two-dimensional integration yields the difference between the required and actual intensities that the composite component receives. A Gauss quadrature numerical integration method was used to numerically evaluate the surface integral, and the Davidon–Fletcher–Powell algorithm was used for predicting optimum positions for the lamps. The mechanical and rheological properties of the UV cured laminates were compared with catalytically cured laminates. Ultraviolet cured components compared well with the catalytic cured composites.
Introduction
Ultraviolet curing, also known as photocuring, reduces the curing time of composite materials from hours to minutes. It was first patented in 1947 and commercialised in 1960 within the furniture industry.1 It provides a consistent and controlled process as compared to the classical catalyst method for composite curing, whose resulting product will vary according to the humidity and temperature of the curing environment. As such, the UV curing market has grown at double digit rates in the last decade.2 Curing of polymer matrixes by UV may be applicable to any composite manufacturing process provided the UV rays can directly illuminate the component or, in cases where the component is enclosed in a vacuum bag or membrane, the membrane should be transparent to UV rays.
The utilisation of UV curing has been demonstrated with the resin infusion between double flexible tooling (RIDFT) process for flat components.3 However, the curing of three-dimensional (3D) components until today remains a challenge to the composite manufacturing industry. Applying UV curing to curvilinear geometries usually requires utilisation of several lamps positioned around the component. Not only is this expensive, but it may also allow for UV exposure overlap, resulting in excessive curing of some areas on the component. Trial and error positioning, utilisation of large arrays of UV lamps with components moving on a conveyor and robotically actuated UV lamps have been employed in some quarters.4–7 These methods are too expensive, time consuming and complex for the RIDFT process, thus negating the idea of simplicity that the RIDFT composite manufacturing process tends to portray.3 To tackle this problem, a general purpose model was proposed.
Resin infusion between double flexible tooling process
The RIDFT process decouples the resin flow and geometry forming elements of most infusion processes, such as vacuum assisted resin transfer moulding (VaRTM). Resin infusion is performed with a mostly two-dimensional flow front as the reinforcing fabrics are held ‘flat’ between two flexible diaphragms.3 The RIDFT is a two-stage process: infusion of fibres is the first stage of the process, and this involves completely wetting the fibres with the resin matrix, followed by the second stage of the process, i.e. vacuum forming (Fig. 1). In the first stage, dry fibre reinforcing fabrics are placed between two silicone sheet membranes. The sheets are then vacuum sealed. Resin is pulled between the sheets by vacuum until the fibres are completely wet. At the end of the infusion process, the fibre–resin assembly is vacuum formed over a male or female mould, yielding in the final part geometry. Figure 2 illustrates the process steps.
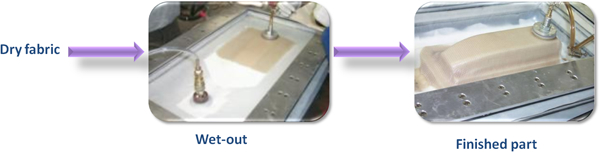
Resin infusion between double flexible tooling ‘flat’ infusion
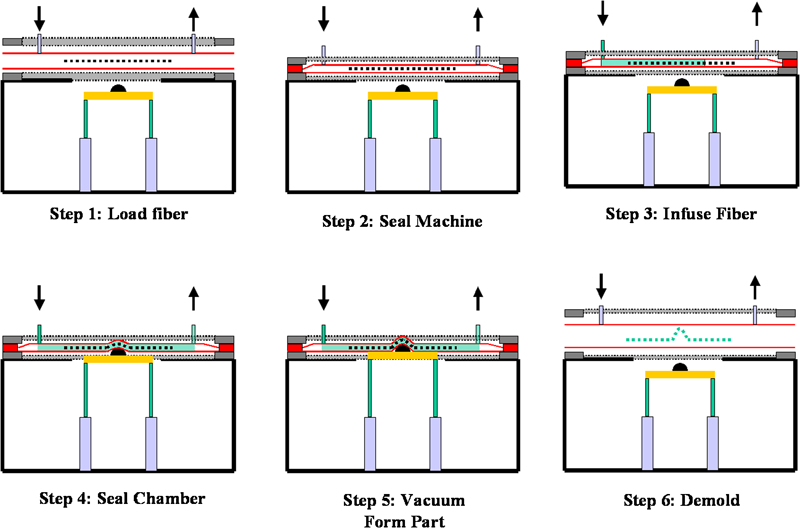
Schema of RIDFT process steps
The RIDFT process is easily amenable to UV curing as demonstrated by Nwabuzor and Okoli.3 This is due to the utilisation of translucent flexible diaphragms as the mould surface, which readily lets the UV light through. In normal use, the operator would simply set up the UV lamps for optimal coverage of the component geometry. This may necessitate the use of more than one lamp, as seen in Fig. 3. In order for the operator to determine the average radiation dosage, a radiometer such as that shown in Fig. 4 is used. The lamp positions are thus set to allow for optimal dosage of UV radiation over the surface of the curing component. This may be time consuming depending on the complexity of the part being made. As such, this work attempts to predict the best lamp positions for curing to reduce operator set-up time.
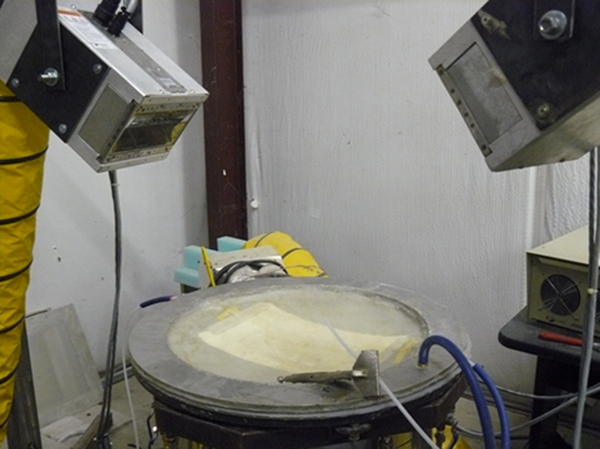
Typical RIDFT-UV curing set-up for two-lamp system
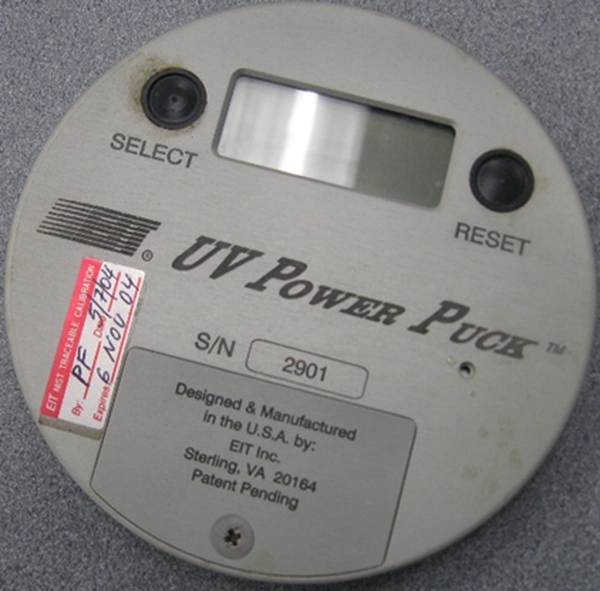
EIT power puck radiometer
Mathematical model for UV curing problem
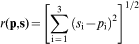
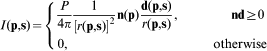
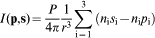
The application of UV radiation to the curing of composite materials can be mathematically modelled using the fundamental principles of electromagnetic radiation. The simplified mathematical model is based on simple power emission neglecting many of the UV curing parameters such as temperature, wavelength and angle of incidence. The aim was to minimise the difference between the average intensity required to cure 3D composite substrates and the actual intensity radiated from the UV source. Several factors affect the depth of cure in the UV curing of polymer composites. These include composition of the material (translucency), choice and composition of photoinitiators, wavelength of the curing light, intensity and irradiation time. Apart from intensity and irradiation time, all the other effects were ignored in the model. Among these factors, intensity plays the major role.8 Curing can only be initiated when the photoinitiators attract the minimum amount of UV radiation, with an appropriate wavelength, necessary to commence chemical reaction in the resin.
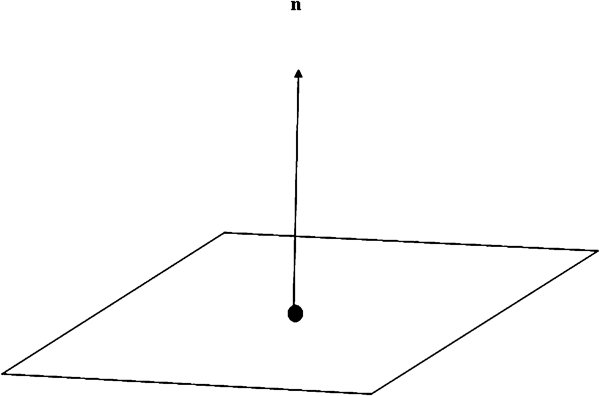
Consider Fig. 5, showing a composite structure to be cured and defined as the surface domain γ such that γ ∈ ℜ3, where the point 


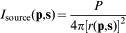
 be the desired optimal curing intensity. For even curing to take place over the cured component surface, the absolute value of the difference between the desired intensity for curing
 and the actual intensity I(
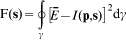
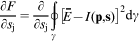
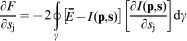
 and the surface of integration are independent of sj (the lamp position); thus, using the chain rule, equation (9) may be expressed as
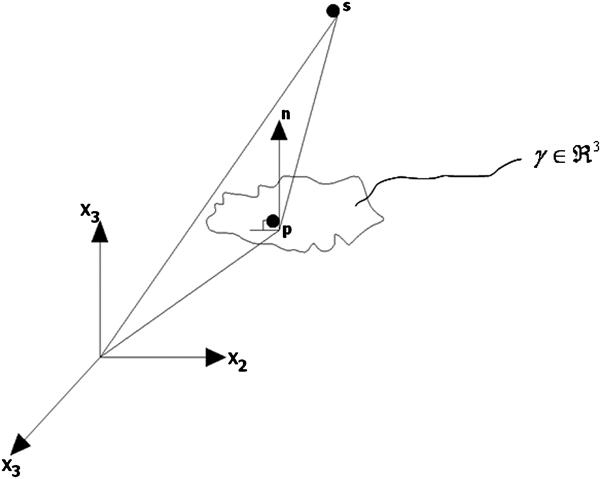
Coordinate system for point on composite material and light source
Taking the derivative of the intensity expressed in equation (7) (where it is noted that the dependence r has on 
Solution procedure
An analytical approach to finding the optimum value(s) of equation (1) is typically desired, but due to the expected geometric complexities of the surface γ for typical industrial products, and the desire to establish an automated procedure to be used in an industrial setting, we will resort to numerical solution procedures. There exist many numerical integration methods from which to choose, i.e. Simpson 1/3 rule, Simpson 3/8 rule, Trapezoidal rule, Newton–Cotes formula and Gauss quadrature.10 In the present work, the Gauss quadrature was selected for both its simplicity and increased accuracy over the classical Newton–Cotes methods involving an equivalent number of integration points. There are two basic components required to minimise the objective function expressed in equation (8). The first component is developing an algorithm to numerically evaluate the integrands expressed in equations (8) and (13), and the second is to employ a classical numerical optimisation algorithm that will iteratively search for a local minimum. The Davidon–Fletcher–Powell (DFP) algorithm was applied to equation (13).
A simple test was performed to demonstrate the effectiveness of the Gauss quadrature approach for the integrations. A square plate like the one shown in Fig. 6, measuring 2×2 units, was used. An imaginary UV lamp with 50 W power was allowed to shine at the square plate at different positions in space. The x and y components of the UV lamp were changed, while the z component was kept constant. The desired intensity required
 needed to cure the flat plate was set to 2 W unit−2 (equation (8)). These values with the lamp positions and the dimension of the plate were used in equations (5) and (8). Equation (8) was analytically evaluated using Mathematica. The value of sz was kept constant at 1·2 units, while the sx and sy values changed from 0 to 2 units with an increment of 0·5. The results obtained analytically for equation (8) are similar to the results obtained for the Gauss quadrature numerical integration. Details of these results are given in Ref. 11.
Schematic of composite plate being UV cured
Plots for equations (5) and (8) at the maximum are shown in Fig. 7. In Fig. 7a, the bottom (0,0, 1.2) portion of the plots shows the area where the intensity is the highest. The other parts of the plate received a lower amount of intensity. Figure 7b shows the intensity difference as indicated by the objective function. The lower (0,0, 1.2) portion of the plate shows the area having the minimum difference between the actual intensity and the desired intensity. As you move across the plate, intensity difference increases. Figure 8 shows the intensity distribution and the intensity difference at the optimum lamp position. As shown at lamp position (1,1,1.2), intensity is concentrated in the centre, and reduces radially outwards. Although the intensity difference increases outwards, it is greatly reduced when compared with Fig. 7b.
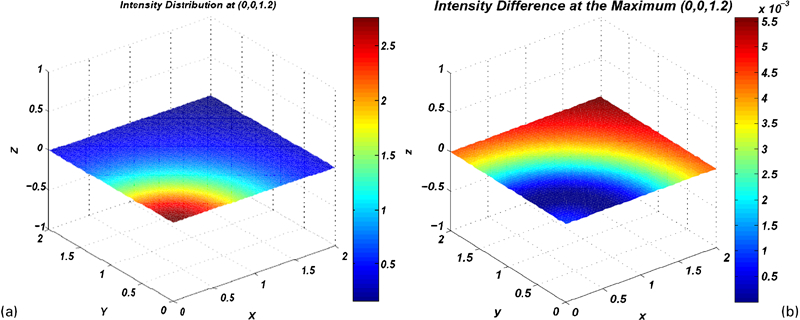
a intensity distribution at maximum [lamp position (0,0,1·2)] and b intensity difference at maximum [lamp position (0,0,1·2)]
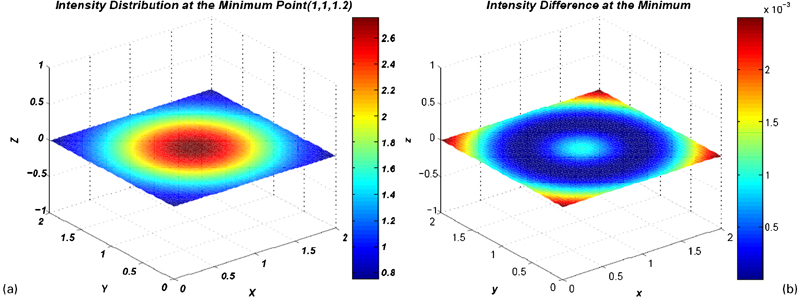
a intensity distribution at minimum [lamp position (1,1,1·2)] and b intensity difference at minimum [lamp position (1,1,1·2)]
Experimental
Materials
The reinforcement material used for the experiments was a BGF 7781 satin weave E-glass fibre. The resin used in this work was an epoxy based vinyl ester (Derakane 470-45). Two moulds were used. The fabrics used in mould 1 were cut to 27·9×25·4 cm (11×10 in.), and the fabrics for mould 2 were cut to 38·1×22·9 (15×9 in.). Two levels of fibre layers (10 and 15) were used in the experiments.
The vinyl ester resin was converted into a photoinitiated (light curing) resin by the addition of two photoinitiators, the phenylbis (2,4,6-trimethylbenzoyl)-phosphine oxide (BAPO) and the alpha hydroxyl ketone oxide (AHK). Both photoinitiators are manufactured by Ciba Specialty Chemicals Inc. and go by the brand names Irgacure 819 and Irgacure 184 respectively.12 The BAPO delivers completely through cure of thick sections. The concentration of this photoinitiator in a UV curable resin is between 0·5 and 3%. It is highly recommended for applications where cure speed, through cure, low odour and low emission are of great importance. The BAPO was designed to be activated by a longer wavelength (∼400 nm). A longer wavelength, though with lower photon energy, penetrates deeper into the parts to be cured than shorter wavelength UV light, which are used for surface curing only. The AHK, which is a highly efficient non-yellowing photoinitiator used to initiate the photopolymerisation of chemically unsaturated prepolymers in combination with mono- or multifunctional vinyl monomers, was also used in this work. It is particularly useful for obtaining good surface quality. To obtain a balance between surface and through curing, a number of photo initiators can be combined with Irgacure 819. A photoinitiator of the alpha hydroxyketone class (such as Irgacure 184) is specifically useful as a combination for Irgacure 819 to ensure the correct level of surface cure. The AHK is activated at wavelengths in the 200 nm range. This photoinitiator is used most of the time as co-initiator to balance through and surface cure.
The first resin–photoinitiator combination was formulated with one photoinitiator, i.e. BAPO. The weight of a Petri dish was determined; BAPO that measured up to 2% of the weight of the resin was placed in the Petri dish before being added to the resin. The second resin–photoinitiator combination was formulated with a combination of BAPO and AHK in the ratio of 1∶3, having a total weight representing 1% of the weight of the resin.
Resin infusion
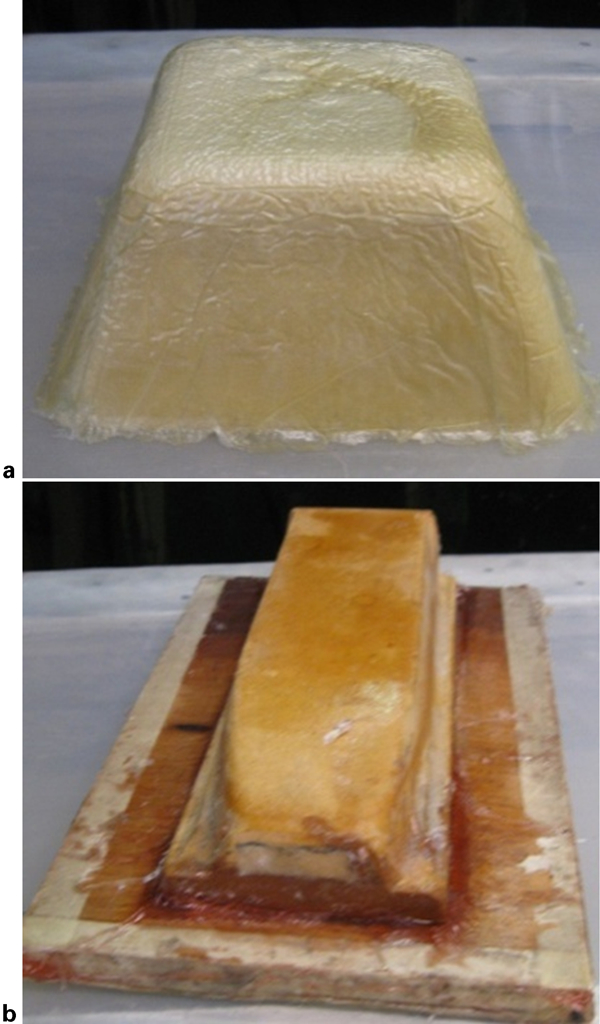
The RIDFT equipment shown in Fig. 3 was used for laminate manufacture in this work. Two Fusion UV F600 S UV lamp systems where used. Once the glass fibre fabrics were placed between the top and bottom silicone sheets, vacuum was applied to seal the frame. The photoinitiated resin was then infused. Once complete wetting was achieved, vacuum forming ensued, as depicted in step 5 of Fig. 2. The UV lamps were then positioned and activated to cure the resin.
Lamp positions
The input variables into the function (equation (8)) include the positions of the composite components  and the unit normal to the surface
Resin infusion between double flexible tooling moulds
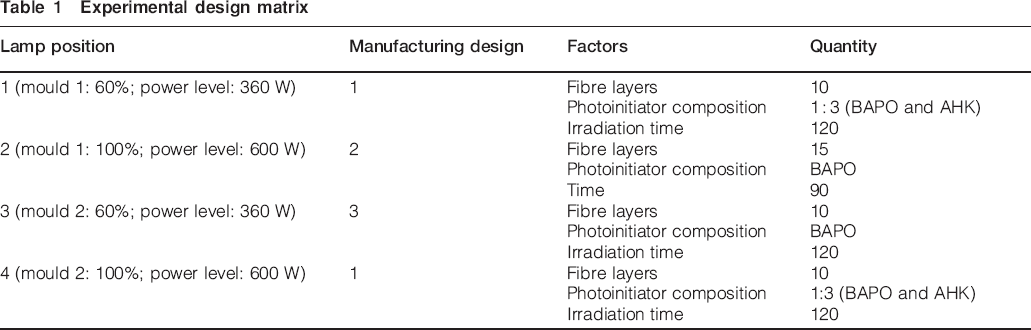
The dimensions of these moulds were used (equations (5), (8) and (13)) to locate the position of the composite substrate on the RIDFT equipment. Two power levels were used on the UV (360 and 600 W). These two power levels with the two moulds used gave four possible positions for the lamps (22). Three different manufacturing designs were developed. Each of these designs was tested using two different lamp positions to determine the effect these suggested positions have on the mechanical properties of the manufactured 3D composites. These manufacturing designs were set up by considering the composition of photoinitiators, number of fibre layers and irradiation time. Two different levels of each of these factors were considered. The experimental design used is given in Table 1.
Experimental design matrix
Experiments for the UV curing of 3D composite substrates were performed using the materials and moulds described in the preceding subsections. Catalytic cured 3D composite substrates were also made to serve as benchmark for comparison with the UV cured laminates. Ultraviolet power level and the dimensions of the moulds were the parameters used to suggest the positions of the two UV lamps. The lamps were set at the suggested positions from the model at the onset of each experiment. After determining the positions of the lamps, photoinitiated resin was infused in the fibre filled RIDFT equipment.
The desired 3D shape was then formed. The UV lamps were turned on for a specified duration of time. At the expiration of the irradiation time, the parts were demoulded from the RIDFT equipment and prepared for tensile and rheological testing.
Results
Mathematical model results
The main objective of this paper is to demonstrate the ability to locate the optimum lamp positions for curing 3D composite components by minimising the difference between the required and actual intensities. The initial lamp positions used with the optimisation model (equation (13)) are shown in Table 2. The UV curing system used for this purpose consists of two identical UV lamps that are suspended in space at the initial location shown in the table. The geometries used are moulds 1 and 2. Mould 1 has a flat top with four slanted sides. The mould is 15×14×7 cm. Mould 2 is tapered in shape with a slightly curved tip. It is 28×9×6 cm. The geometries of these moulds, the initial positions of the UV lamps and the UV power level were the input values into the model.
Optimised UV lamp positions
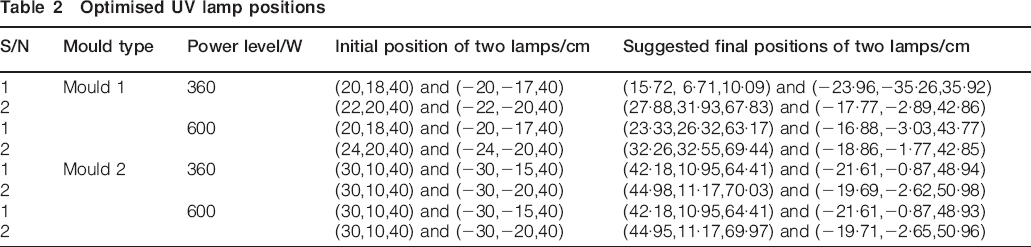
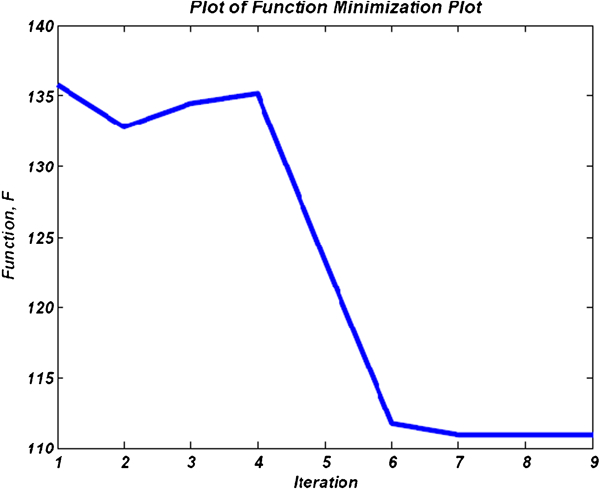
The DFP algorithm was used to perform a series of iterations while testing the convergence of the objective function to a particular tolerance level at the end of each iteration. When the desired tolerance level is reached, the positions of the UV lamps at that point become the optimum positions. For example, when the UV power level was set to 100%, the geometry for the composite components was mould 2. The initial lamp positions were set to s1 = (30,10,40) and s2 = (−30,−15,40). After nine successive iterations, the minimum value for the objective function was obtained at the positions s1 = (44·18,10·95,64·41) and s2 = (−21·61,−0·87,48·93). These positions are the optimum positions for that particular geometry, power level and initial lamp positions. The value of the objective function for this particular case is shown in Fig. 10 for each iteration during the optimisation procedure. As observed in Fig. 10, the value of the objective function decreases after each successive iteration. Details of the combination of the initial lamp positions and the composite component geometry and the UV power level with their optimum positions are given in Table 2.
Function minimisation plot
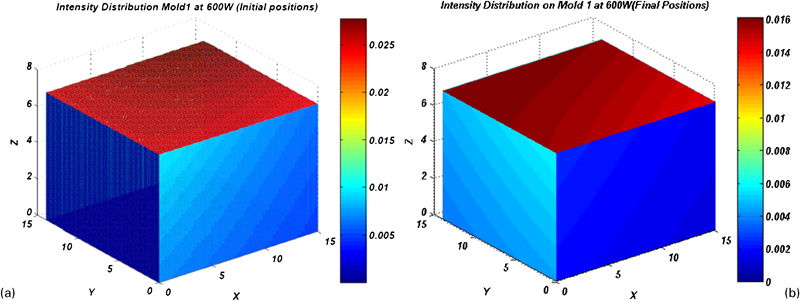
A two-UV lamp system was used on a box-like geometry representing the two moulds used in the experiments. A preliminary set of solutions was obtained from the model. These solutions were used to set up the experimental conditions shown in Table 1. The initial and final lamp positions were suggested for the experiments, and these were used in equation (5) to generate the intensity distribution on the manufactured composite substrates. The typical intensity distributions are shown in Fig. 11. This represents the intensity distributions on mould 1, with the power level set at 60% (360 W) for the initial and final positions of the UV lamps. For this case, the maximum intensity decreased from 0·02 W cm−2 at the initial position to 0·012 Wcm−2 at the final lamp positions.
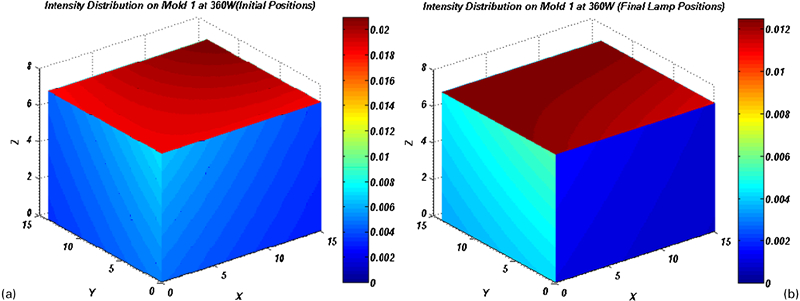
Graphs of intensity distribution on mould 1 at 60% UV power level
Although all the faces are not uniformly cured, the intensity values for each of the faces are relatively evenly distributed for the final lamp positions. For example, in Fig. 11a, the intensity at the top of the box decreases from point (15,14,7) to point (0,0,7). The lamp was very close to the first point; thus, it received the highest intensity. Ordinarily, the positive z face of the box (top) and the tip of the box at negative x and negative y faces should have had the same colour mapping, but there was a sharp difference among these faces due to the direction of the surface normal between the two faces.
When the power input for mould 1 was increased to 100% of the UV system capacity (Fig. 12), the maximum intensity value for the initial lamp position increased by 25% because more power was given off from the source. An increase in maximum intensity of 33% at the final UV lamp positions was noted. Again, the intensity at the top of the box was higher than at the sides. The difference between the maximum and minimum intensity distributions per face was <15%.
Intensity distribution on mould 1 at 100% UV power level
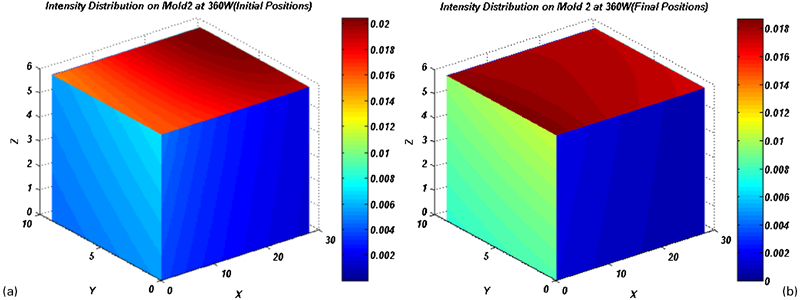
In Fig. 13, there was no sharp difference between the highest intensity value in both the initial and final lamp positions. Although the intensity at the top of the box (Fig 13 (a)) was higher, varying from 0.2 W/cm2 to 0.015 W/cm2, the intensity on the sides are closely matched. In Fig 13 (b), the intensity at the top of the box is higher than the sides, varying from 0.18 to 0.015 W/cm2. The intensity on the left side increased to just over 0.01 W/cm2, with a lower intensity on the right side. The intensity distributions at various sides of the box in this set-up are much closer compared with the other set-ups.
Intensity distribution on mould 2 at 60% UV power level
Rheological and tensile tests results
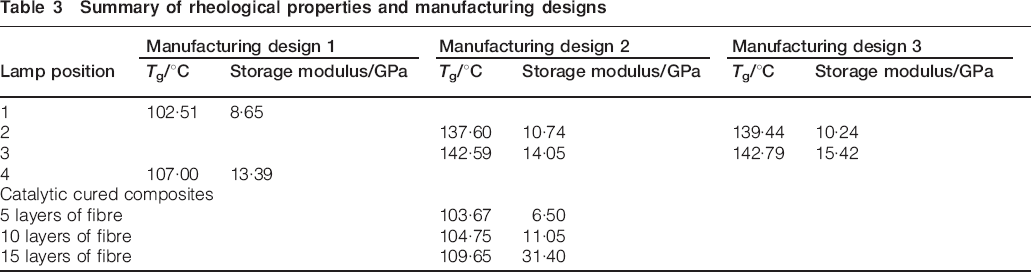
Experiments were performed using the design shown in Table 1. Some of the lamp positions used in plotting the colour contours shown in Figs. 11–13 were used in the experiments. Each manufacturing design was curfed using two different lamp positions. Manufacturing design 1 was cured with lamp positions 1 and 4. Manufacturing designs 2 and 3 were cured using positions 2 and 3. Catalytic cured composite materials were manufactured using 5, 10 and 15 layers of fibres. The summaries of results from rheological tests are shown in Table 3.
From Table 3, it can be observed that the rheological properties of the laminates from lamp position 3 are superior to the rest, including the catalytically cured laminates. This is also seen with the tensile strength and Young's modulus in Figs. 14 and 15, which indicate better mechanical properties from the composites manufactured using mould 2. Even the distribution of UV light on the geometry used for this position might be responsible for the relatively superior mechanical properties. This is still subject to further investigation. The tensile properties of lamp positions with higher UV power level are much higher than those of the lower UV lamp power level in the first design. Overall, the UV cured laminates have better properties than the catalytically cured ones, and this may be attributed to the speed of the UV curing, which helps to trap styrene molecules that would ordinarily have been lost through evaporation, making them available to help drive the polymerisation curing reaction.3, 13
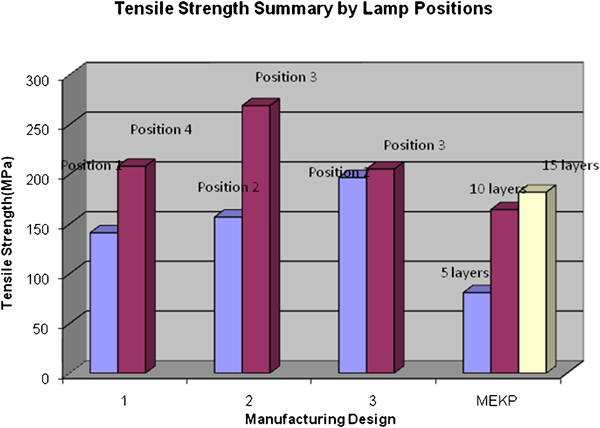
Tensile strength summary by lamp position
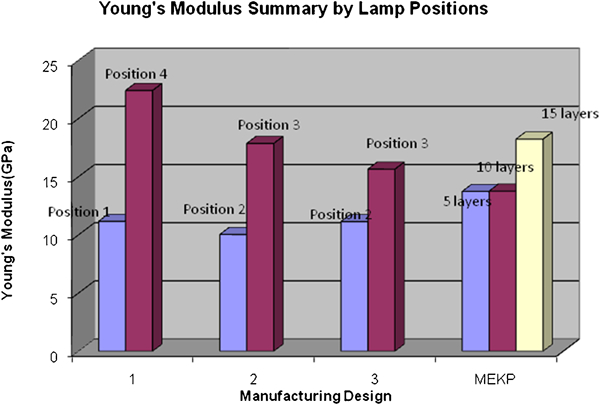
Young's modulus summary by lamp position
Summary of rheological properties and manufacturing designs
Conclusions
Ultraviolet curing of resin composites has previously been demonstrated on the RIDFT process. This work, however, focused on the manufacture of 3D components where positioning of the UV lamps is crucial. Manual positioning can be implemented; however, this is often laborious and time consuming. As such, this work attempted to provide an analytical means for locating UV lamps for the optimal curing of curvilinear composite laminates using the RIDFT process. A multivariate optimisation model, consisting of a continuously differentiable and a two-dimensional integral domain parts, was developed. The solution to the model is in two stages: numerical solution to the two-dimensional integral domain using Gauss quadrature method and solution to the optimisation problem using DFP algorithm. The goal of the model was to predict the optimum positions for the UV lamps.
Three different types of manufacturing designs were identified. Four predicted lamp positions were used. Each manufacturing design was tested using two different lamp positions. The results were compared, and it was found that lamp position 3 yielded the best mechanical properties. This predicted position resulted in mechanical properties superior to the catalytically cured laminates. Nonetheless, uniform curing is yet to be obtained over the entire component geometry. As such, the UV cure of complex geometries still calls upon operator experience. Further work to improve the predictions is thus suggested.