
Abstract
The most common description of the mechanical behaviour of viscoelastic materials is presented using complex dynamic properties. These properties depend on many external factors (temperature, excitation frequency, etc.) and determine the evolution of derivative effects in the structure. The purpose of the conducted investigations is the determination of the influence of heating rate on the dynamic mechanical behaviour of a polymer based composite material under different excitation frequencies and temperatures. The glass transition temperatures and the activation energies of the phase transition were calculated, which allow extending the Arrhenius equation by the heating rate factor. The obtained dependencies could be useful for the estimation of the mechanical and thermal degradations of polymeric composites and, among others, for the determination of the self-heating temperature distributions and their evolution during cyclic loading. The presented results could also be applied for the determination of fatigue, crack growth and residual life of composite structures.
Keywords
Introduction
The use of polymeric composites in many responsible applications, especially in automotive, ship building, aircraft and aerospace industries, is determined by their excellent mechanical and dielectric properties, low water absorbing, ability of the work in different environments and, first of all, low cost manufacturing. Use of polymeric composites as constructional materials requires the determination of their behaviour in various environments, loading conditions and operation states. Considering the viscoelastic nature of such materials, their properties vary mostly non-linearly depending on several parameters, which complicate their description. Moreover, some special loading programmes, e.g. cyclic loading, yield the hysteretic behaviour in the stress–strain relationship, which may cause the self-heating effect.1–3 The operation and service of polymeric constructions are limited by the thermal transition, glass transition temperature Tg.
The structural behaviours of polymers and polymeric composites depend on the evolution of stiffness during workloads in general. However, due to the viscoelastic nature and derivative effects, the stiffness changes highly non-linearly, especially in the case of the dynamic loading presence, and therefore could not be predicted fully analytically. The manufacturing process of the laminates may also have an influence on the stiffness values, and in most cases, the properties vary from structure to structure. In fact, the proper determination of the evolution character of dynamic stiffness for various conditions makes possible the modelling many structural effects and processes, including fatigue life, fracture, creep and stress relaxation, self-heating effect, etc.
Efforts for the mathematical description of the polymers were proposed by Ferry.4 His empirical hypothesis allows determining the temperature and frequency dependencies of complex material properties by introducing the shift factors. The hypothesis, known as Williams–Landel–Ferry (WLF) hypothesis, presents excellent coincidence with experimental data, however only in the viscoelastic range of material and only in the case of linear viscoelasticity. The time–temperature superposition (TTS) principle presented in the hypothesis allows predicting the values of dynamic parameters in some range of temperatures and excitation frequencies based on a single temperature scan. The TTS principle is based on the determination of shift factors, whose values were calculated from the glass transition temperatures Tg for a given excitation frequency.3
The determination of Tg could be carried out using several measurement equipment: traditionally by differential scanning calorimetry but also using thermogravimetric analysis, thermomechanical analysis, etc.5 However, in the presented study, the most suitable and accurate method for the analysis is the dynamic mechanical analysis (DMA), which additionally provides accurate measurement of the dynamic properties.
The investigations in the area of structural behaviour of viscoelastic polymers show that the great influence on the dynamic properties of such structures has also the gradient of temperature evolution during workload. Goertzen and Kessler in their work6 show that the influence of this gradient is much greater than the influence of the excitation frequency. Some instructions for the DMA with taking into consideration the variability of a heating rate could be found in Ref. 7. Advanced studies on the influence of a heating rate on the thermal processing of the propylene were presented in Ref. 8. Several authors, which carried out the research on the heating rate influence on the behaviour of polymers and polymeric composites, proposed different relations between the heating rate and the glass transition temperature, e.g. the authors of Ref. 9 proposed the linear model, while the authors of Ref. 10 proposed the polynomial one.
The main objective of the presented study is to investigate the influence of the heating rate on the evolution of the dynamic properties of polymeric laminates. The obtained dependence allows extending the existing Arrhenius relationship by introducing the heating rate factor, which makes possible fulfilling the structural behaviour of polymers and polymeric composites. The modified Arrhenius relationship could be used for the determination of the non-stationary self-heating temperature evolution. The models of the self-heating effect studied in previous works3, 11, 12 will be fulfilled by the additional criterion and allow predicting the evolution more accurately. Considering the modified Arrhenius relationship, the master curves for complex, storage and loss moduli were constructed. The values obtained from the proposed model were compared with measurements on DMA.
Theoretical background
Thermoviscoelasticity
The behaviour of the investigated polymeric laminates could be described following the Boltzmann superposition principle for linear viscoelastic material by introducing the temperature dependence as
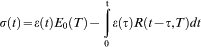
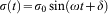
Considering the cyclic loading of the structures, the stress and strain relations are given as follows


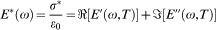
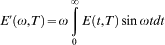
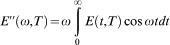


As it could be noticed, the only parameter to be determined is the frequency and temperature dependent loss modulus.
Kinetic relations
The measurements of Tg and dynamic parameters with the use of DMA are carried out as a measurement of a given parameter with the rising temperature with a constant heating rate for single or multiple frequencies. Note that the measurement was conducted as an isothermal one. The values of Tg could be determined from all of the characteristics obtained during the analysis, e.g. storage modulus versus temperature, loss modulus versus temperature or tangent phase lag versus temperature. However, the Tg values vary depending on the chosen relation. The European standard14 requires that Tg should be determined as a peak value of loss modulus versus temperature relation.
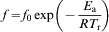
The frequency dependence on Tg and dynamic moduli is well investigated and presented for different materials.3, 5, 7–9 During the increase in excitation frequency, the dynamic parameters were shifted to higher values in the light of the TTS principle. These shifts are determined from the Arrhenius relationship or from the WLF equation, depending on the temperature band of interest. In the case when the temperature band is below Tg (as it was in the presented study), the Arrhenius relationship should be used. It is usually presented in the form


Having the relation of shift factors versus excitation frequency, the construction of master curves is possible. The curves of isothermal dynamic parameters are presented in the frequency domain versus the appropriate values of aT determined for the single reference temperature.
An additional parameter, which influences on Tg and thus on the dynamic properties of the polymeric structure, is the heating rate β = dT/dt. The European standards14 suggest to carry out DMA measurements with a constant heating rate of 3°C min−1, but in many cases, the value of heating rates is assumed to be 2°C min−1 or lower because higher values of the heating rate may introduce the cross-linking process. However, in many problems, including the self-heating effect, the heating rate is greater than presented above, and its influence on the structural behaviour should be examined. Previous investigations in this area17 show that the heating rate changes have much greater influence on Tg than the frequency sweep. Owing to the increase in the heating rate, the Tg values also increase, which could be interpreted by increasing of thermal inertia inside the measurement system. Alves and Mano10 investigate the influence of β on Tg values obtained from tan δ peak curves. The obtained relation was fitted by the third order polynomial function, and the hypothesis of heat flux symmetry was proposed. In Ref. 5, the authors investigate the influence of the heating rate on Tg and Ea values. Based on the DMA measurements, they determined activation energies for 1°C min−1⩽β⩽5°C min−1 and conclude that a heating rate higher than 2°C min−1 influences the aT values together with the frequency. This influence results from the domination of the thermal and material diffusions.18 Day et al.8 and Criado et al.9 also observed the strong relation between β and Tg. These facts induce the authors to investigate the influence of the heating rate on Tg and dynamic moduli and apply it in the self-heating problem of epoxy based glass cloth reinforced laminate.
Experimental
Specimen preparation
The polymeric laminate specimens with symbol EP GC 201 were manufactured and supplied by Izo-Erg S.A. The manufacturing process was carried out following the requirements of the European standard EN 60893-3-2. The matrix of the laminate constitutes a mixture of commercial compounds: bisphenol A and tetrabrombisphenol A. The plain weave E-glass fibre cloth with weight of 200 g m−2 was impregnated on the spreader by the prepolymer acetone solution and dried in hot air. Laminate sheets with dimensions of 1000×1000 mm with 14 unidirectional layers and resulting thickness of 2·5±0·2 mm were fabricated using hydraulic press. The specimens were cut from the prepared sheets.
Preliminary strength tests
In order to check the mechanical properties of the laminate and compare them with the values given by the European standard EN 60893-3-2, static strength tests were carried out on the universal static testing machine SMZ050/TH3S supplied by Zwick GmbH with the use of a charge coupled device video extensometer. Two types of tests were performed: tensile strength tests and flexural strength tests. The tests were carried out following the Polish–European standards PN-EN ISO 178 and PN-EN ISO 527-4 for five specimens for each type of test. the obtained results are in good agreement with the values given by EN 60893-3-2. The average tensile strength of the laminate after five tests was 413 MPa, which exceeds the requirements by 37·67%. The average flexural modulus of elasticity in the three-point bending test was 24 203·61 MPa and exceeds the standard minimal value by 0·84%, and the average flexural strength was 633·2 MPa, which exceeds the standard minimal value by 86·23%.
Parameters of DMA measurements
The tests were carried out on a Netzsch DMA 242C dynamic mechanical analyser. Specimens with dimensions of length of 55 mm, width of 10 mm and thickness of 2·5 mm were used in the tests. All of the tests were conducted on a three-point bending fixture with a bending length of 50 mm. Cyclic loading was applied under the constant amplitude of 80 μm and the maximum force of 5 N. The tests were conducted in two stages in order to achieve various dependencies between Tg and the other parameters of interest.
At the first stage, single frequency mode tests were performed for the following excitation frequencies: 1, 10, 20 and 50 Hz. The temperature range was set to 20–200°C in all cases, with the corresponding constant heating rate of 3°C min−1. For minimising the statistical deviation, three specimens were tested for the unique experimental conditions. As a result, the temperature scans for E′, E″ or tan δ were obtained.
At the second stage, additional DMA tests were performed in the multifrequency mode. The excitation frequencies are as follows: 1, 10, 20 and 50 Hz. The tests were performed for different heating rates: 1, 3, 5, 8, 12 and 15°C min−1 for the temperature range of 20–220°C.
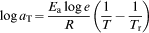
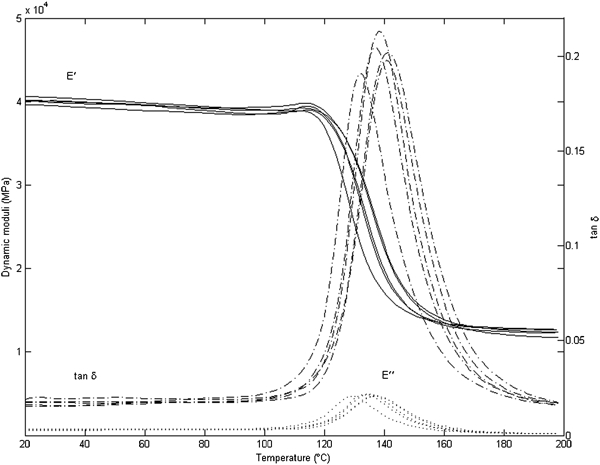
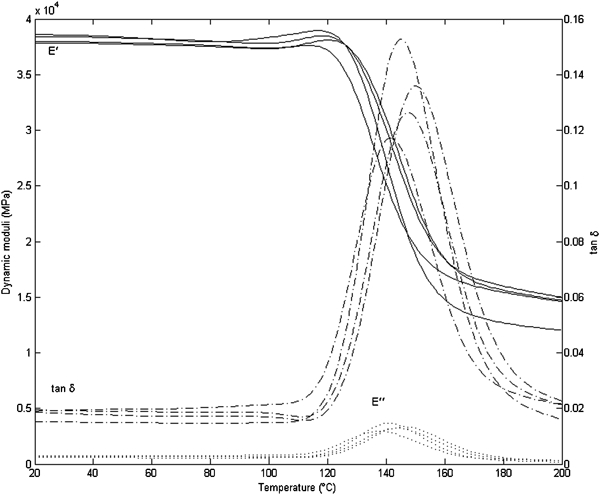
During the analyses, the Tg values were registered based on the peak values of the loss modulus. As expected, the Tg values increase with increasing excitation frequency and heating rate. Exemplary temperature scans with all of the dynamic parameters are presented in Figs. 1–3 for heating rates of 3, 8 and 15°C min−1 respectively.
Temperature scans with heating rate of 3°C min−1
Temperature scans with heating rate of 8°C min−1
Temperature scans with heating rate of 15°C min−1
Analysis of results
Estimation of activation energy
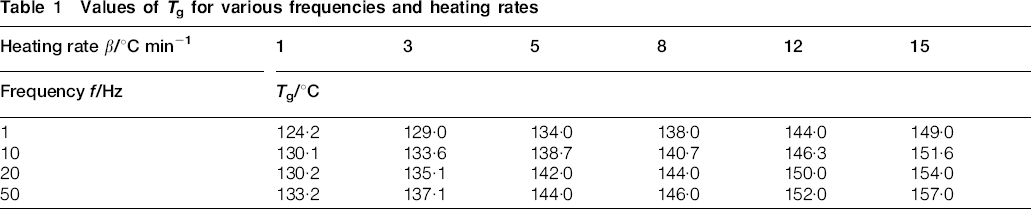
The glass transition temperatures were determined in order to calculate the activation energy values for the investigated cases of heating rates. The values of Tg are tabulated in Table 1.
Values of Tg for various frequencies and heating rates
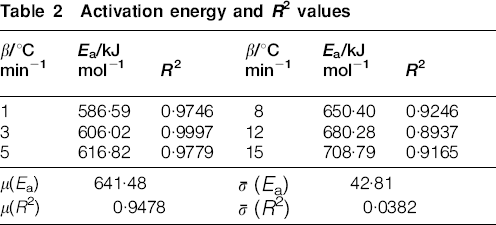
Following the Arrhenius relationship (equation(12)), the activation energy values of the glass transition were determined for various heating rates. The values of 1000/Tg were presented in the Arrhenius plot (Fig. 4) against the logarithmised excitation frequency values. Linear regression was applied for the measured data for the slope estimation from the Arrhenius plot. The activation energy values were obtained by multiplying the slopes with the universal gas constant R = 8·314×10−3 kJ mol−1 K−1. In Table 2, the activation energy values with corresponding coefficients of determination (R2) values (accuracy of the fitting) of the regression curves of Tg are presented. The mean values μ and standard deviations
 for the obtained results are also tabulated.
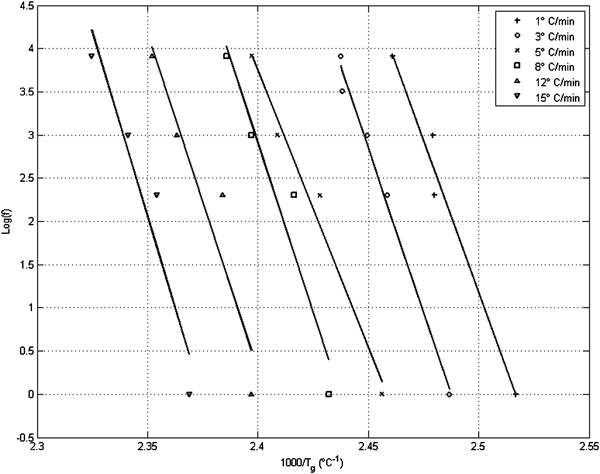
Arrhenius plot for various heating rates
Activation energy and R2 values
Based on the obtained results, it is possible to determine the dependence between Tg and the heating rate. The coefficients of determination, i.e. R2, show rather good results for small heating rates; however, the disturbances cumulated, while the heating rate increased. This non-linearity could be explained as follows: the thermocouple in the DMA measurement chamber is not in direct contact with the investigated specimen; thus, the time to reach the thermal equilibrium may not be sufficient for the heating rate with higher values due to the thermal inertia. However, presenting calculated values of Ea against the heating rates (Fig. 5), linear dependence could be observed (the coefficient of determination is equal to 0·9966).
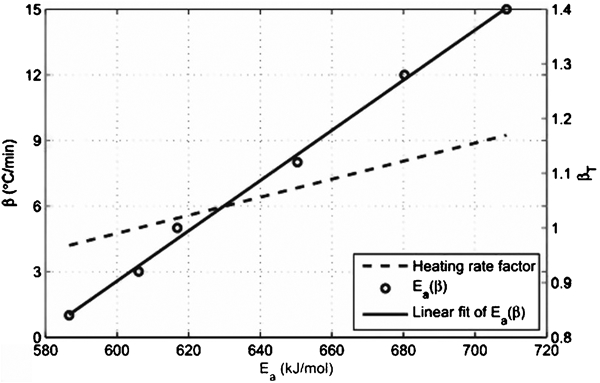
Dependence of activation energy on heating rate and heating rate factor
Considering the results presented in Fig. 5 and Table 2, the following assumption could be made: the activation energy depends linearly on the heating rate. Following this assumption, the heating rate factor βT could be introduced. Following the requirements of Ref. 14, where the proposed heating rate is equal to 3°C min−1, the value of βT was assumed to be unity. The heating rate of 3°C min−1 was assumed as the reference heating rate βr. The values of βT for β≠βr could be obtained from the ratio of the activation energy value for β≠βr and the activation energy value for β = βr. The appropriate curve for the Ea–βT relationship is presented in Fig. 5.
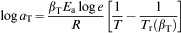
Considering the abovementioned assumption and dependencies, the Arrhenius relationship (equation (13)) could be modified by introducing the heating rate factor as follows
Determination of frequency shift factors and construction of master curves
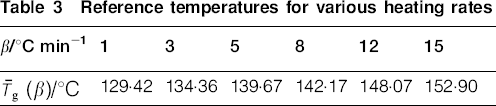
For the determination of the frequency shift factors aT, the reference temperatures must be assumed for each investigated case of heating rate. In the present study, the value of Tr was assumed as an average of glass transition temperatures
 for the reference heating rate βr. Similarly,
 was determined for other heating rates β≠βr and is tabulated in Table 3. Shift factors could be determined from the relation of log aT–(T−Tr) for a given heating rate. In Fig. 5, the shift factors were plotted for various heating rates with respect to (T−Tr), where Tr was assumed as
 for βr.
Reference temperatures for various heating rates
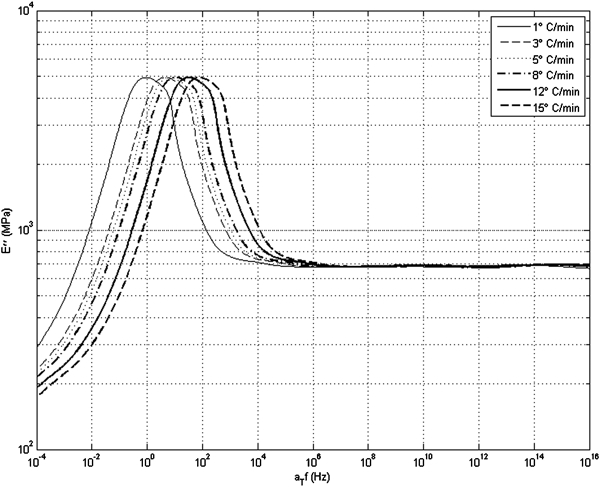
Based on the results presented in Fig. 5, the master curves for dynamic moduli and the tangent loss factor could be constructed by transforming the temperature scans to the frequency domain. Using the shift factors presented in Fig. 6, the isothermal frequency dependent curves were shifted against the reference temperature for each value of the heating rate. The master curves are presented in Figs. 7–9 for storage modulus, loss modulus and tangent loss respectively, according to the modified Arrhenius relationship (equation (16)).
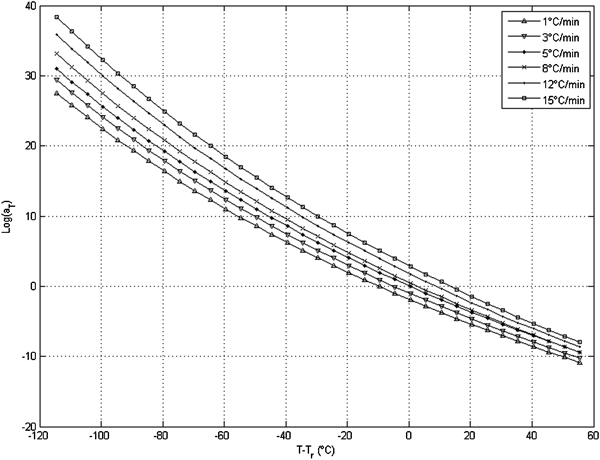
Shift factors for various heating rates Tr(βr) = 134·36°C

Storage modulus for various heating rates according to equation (16)
Loss modulus for various heating rates according to equation (16)
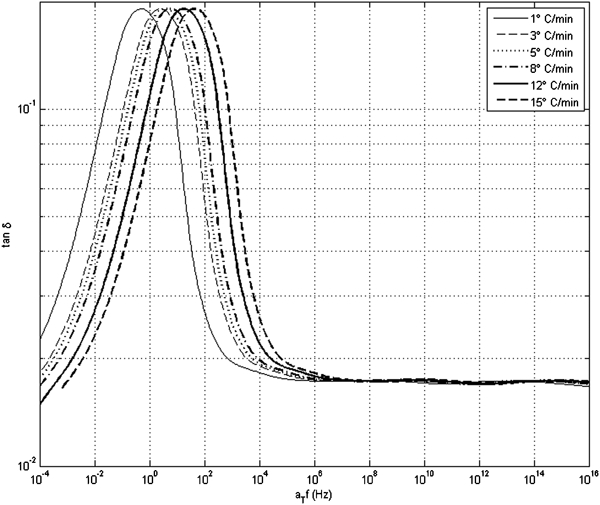
Tangent loss factor for various heating rates according to equation (16)
Comparison between experimental and simulation data of dynamic properties
In order to validate the proposed modification of the Arrhenius relationship, it is necessary to compare the data obtained from the simulation using equation (16) and the data obtained experimentally for various heating rates. Exemplary master curves for dynamic moduli obtained from equation (16) and directly in experiment with different heating rates are presented in Figs. 10 and 11.
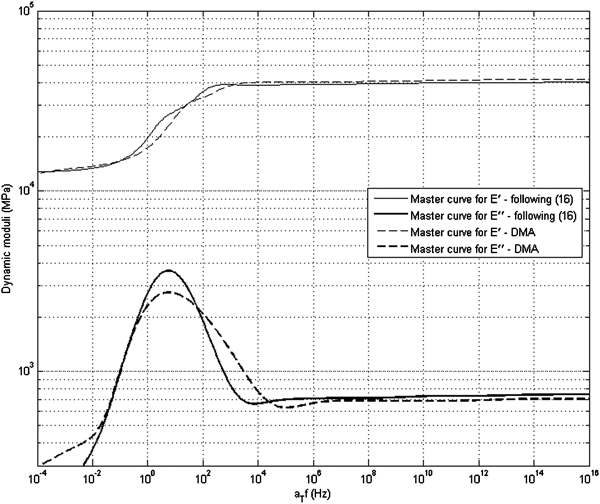
Storage and loss moduli master curves for measured and modelled data for heating rate of 5°C min−1
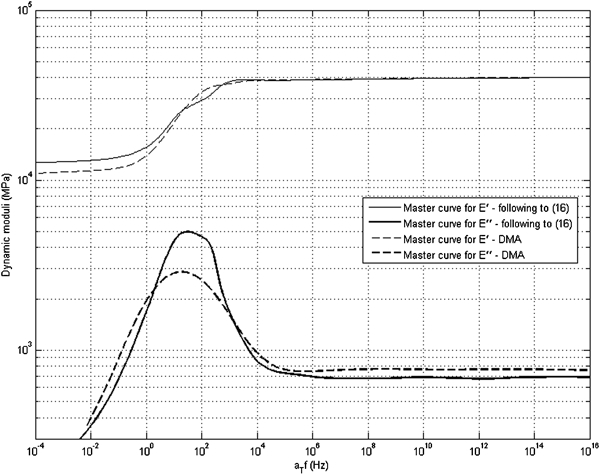
Storage and loss moduli master curves for measured and modelled data for heating rate of 12°C min−1
It could be observed that the values of the storage moduli acquired directly from the DMA measurements coincide with the data obtained from the proposed relationship as well. The main discrepancies were observed for temperature values near and above the glass transition temperature. The values of the loss moduli master curve from DMA measurements reveal higher discrepancies in comparison with the modelled master curve, but similarly near and above Tg. The peaks of the loss moduli master curves have a lower amount than the modelled ones. It could also be noticed that the discrepancies between the compared master curves increase, while the value of the heating rate increases.
The differences in the rubbery region could be explained by several factors. The main reason for the difference occurring is the occurrence of cross-linking processes and their intensity increases with increasing heating rate, which is clearly visible in Figs. 10 and 11. The small differences in both glassy and rubbery regions and their increase with increasing heating rate may result from the thermal inertia of the measurement chamber of DMA, while the measurement thermocouple has no direct contact with the specimen. Another reason for the differences is the assumption of linear dependence between the values of activation energy and heating rate: the regression errors also have an impact on the registered differences.
Considering that the region of interest on the presented master curves for the self-heating effect is the glassy region, the modified Arrhenius relationship could be applied for the dynamic moduli determination for various heating rates as well. For describing the glass transition and the rubbery plateau regions, the WLF hypothesis should be used.
The time–temperature characteristics of a given polymer may change due to the application of different compounds and catalysers during the manufacturing process. It may cause the occurrence of additional relaxation transitions in glassy and rubbery regions. The multiple relaxation mechanisms could also be induced by the decomposition of polymer, its oxidation or photo cross-linking.19 Such changes cause that the polymer is not thermorheologically simple anymore and could not be properly described following the Arrhenius relationship and the TTS principle. The non-linear viscoelastic behaviour of polymers and polymeric composites complicates much the time–temperature relations and equations of their theoretical description. Some non-linear viscoelastic models could be found in Ref. 20. However, for the purposes of an investigated problem, a linear viscoelastic description is most proper for the laminate, which was experimentally conducted.
Conclusions
The present investigation deals with describing an evolution of the values of dynamic properties of viscoelastic layered composites for variable frequencies of excitation and heating rates. The results obtained during DMA measurements indicate that both the excitation frequency and the heating rate have influence on the glass transition temperatures and thus the dynamic properties.
During the experiments, it was observed that the Arrhenius plots reveal similar slopes and only horizontally shifted, depending on the value of the heating rate. Based on this observation, the heating rate factor was introduced. Following this, the classic Arrhenius relationship was expanded for variable heating rates. Using the modified Arrhenius relationship, the master curves were constructed for all of the measured dynamic properties during DMA tests. The modelled master curves were compared with master curves obtained directly from DMA tests with various heating rates. It was observed that the discrepancies observed in the glassy regions were small and thus could be negligible.
The presented modification of the Arrhenius relationship allows limiting DMA tests for a single constant heating rate and, based on the obtained measurements, predicting the values of dynamic properties for other heating rates. The relationship could be used for the determination of dynamic properties of the linearly viscoelastic structures in the problems of stationary and non-stationary self-heating and fatigue and lifetime prediction problems with consideration of a self-heating effect. Another important problem is the temperature control of elements with integrated circuits, measurement and executive devices, which guarantee proper work in the limited temperature range.
The results of the presented study could be applied to several scientific and engineering problems. Based on the proposed modified Arrhenius relationship, it is possible to describe the structural behaviour of epoxy polymers and composites based on them with a consideration of derivative effects, e.g. cross-linking. Such description is useful on the one hand for the proper design of structural elements subjected to intensive loading (self-heating effect) or external thermal influencing. In the most responsible applications, such as aircraft and aerospace industries, the proposed relationship makes it possible to also determine the thermo-oxidation stability of the structural elements. On the other hand, it could be used in several problems, which consist of technical diagnostics, structural health monitoring, etc. An important phenomenon in the service and maintenance of polymeric composites is their aging during the lifetime. It was shown21 that for the investigated class of materials, there is a logarithmic relation between the activation energy and the aging time. Thus, the presented relation could be additionally fulfilled by the aging factor and should be validated experimentally.
In further studies, the self-heating temperature evolution curves will be determined following the presented modification of Arrhenius relationship and compared with the temperature evolution curves obtained experimentally during dynamic excitation.
Footnotes
Acknowledgements
The results presented in this paper have been carried out within the framework of research grant no. N N504 282137 financed by the Polish Ministry of Science and Higher Education.