
Abstract
The contribution of epoxy functionalities in hybrid filler microstructures and interfaces within different binary and ternary particulate elastomeric nanocomposites, prepared by open two-roll mixing, was analysed. The epoxy percentages of the elastomeric phase were varied at three different levels (e.g. 0, 25 and 50%). Among the ternary samples, the most uniform distribution and dispersion were achieved in the case of the sample based on ENR-25 (epoxidised natural rubber matrix having 25 mol-% of epoxy group), as observed by small angle X-ray scattering (interfacial roughness) and transmission electron microscopy. Clay and carbon black jointly form hybrid microstructures like ‘nanounit’. Uniform distributions of such morphologies are reflected in tensile strength, elongation at break and half height width of the tan δ peak. Although the cross-link density improves as the epoxy percentage is increased, the level of synergism between two different fillers in terms of cross-linking density gradually reduces with the increased epoxy percentages. Except for solely clay filled samples, the thermal stability enhances as the epoxy percentage is increased.
Introduction
The epoxidised natural rubber (ENR) is a chemically modified form of natural rubber (NR).1 The ENR has some improved engineering properties, such as its resistance to oils and solvents, air impermeability and wet skid resistance, as compared to NR. In fact, ENR could find its way into many engineering applications and products, such as oil resistant hoses, seals, milk inflations, connectors and some medical applications.2 In the 1980s, Gelling and Ng and Gan successfully carried out the epoxidation of NR with peracetic and performic acids under moderate reaction conditions.3 Virtually, any level of epoxidation can be achieved without any side reactions by careful control of the dosage of chemicals, the temperature and the time of the reaction. In the partially epoxidised product, the epoxy groups were found to be distributed randomly, whether the epoxidation was carried out in solution or in latex.2 Many papers on the preparations, stabilities, curing characteristics,4 adhesion strength, mechanical properties, aging behaviour, thermal properties1 and applications of ENR and its blends/composites have subsequently been published.
As the level of epoxidation in ENR is increased, the polarity increases, leading to an increase in oil/solvent resistance.5 It can be presumed that the uniformity in dispersion of the polar filler like layered silicate should be improved in ENR with the increasing epoxy percentages of the rubber matrix.6 In one of our earlier publications, ENR-25 (ENR matrix having 25 mol-% of epoxy group) based ternary nanocomposites containing carbon black (CB) and organomodified nanoclay (NC) were characterised on the basis of morphology, structure, cross-linking density, thermal and mechanical behaviour. The possible interactions between CB, NC and the rubber matrix were investigated. For such ENR-25 based ternary particulate nanocomposite, optimised properties can be achieved with 20 phr CB and 15 phr NC.7 Such optimisation is owing to the extent of formation of hybrid microstructure comprising of ‘nanounit’8 and ‘halo’.9 These hybrid microstructures as well as filler distributions can have a potential influence on the hydrodynamic swelling,10 mechanical and tribological properties of the ternary elastomeric nanocomposites.11 In addition, the epoxy content of the matrix can influence the characteristics of these hybrid microstructures and nanocomposites.
Therefore, in this paper, the impact of epoxy variation upon the characteristics of microstructures and interfaces has been reported. In addition, the effect of changes in the microstructures upon the synergistic property development of the nanocomposites has been studied.
Experimental
Materials
Commercial grades of NR, ENR-25 and ENR-50 (ENR matrix having 50 mol-% of epoxy group) were obtained from the Rubber Board, Kottayam, Kerala, India. Nanomer I.30E-sodium MMT clay (organically modified with octadecyl amine, mean dry particle size of 8–10 μm, specific gravity of 1·71 and minimum mineral purity of 98·5%) was procured from Nanocor Corporation, USA. High abrasion furnace black was procured from Philips Carbon Black Ltd (Kolkata, India), having the following characteristics: iodine absorption number = 82±7 g kg−1; Dibutyl phthalate (DBP) absorption number (uncompressed samples) = 102±7 cm3/100 g; DBP absorption number (compressed sample) = 80–96 cm3/100 g; nitrogen absorption specific area = 71–85 m2/g; and tinting strength = 96–112%. Other compounding ingredients and curing additives, including calcium stearate (stabilising agent for ENR) and antioxidant (TQ), were purchased from local suppliers (analytical grade).
Preparation of ENR composites
All the samples were prepared at room temperature in an open two roll mill (Schwabenthon, Berlin, Germany) of 300 mm length and 170 mm diameter. The speed of the slower roll was maintained at 18 revolutions/min with a friction ratio of 1∶1·2. Initially, master batches were prepared by mixing calcium stearate (1·5 phr) to the raw rubbers. The mixing times for the master batch preparation were varied in order to attain similar Moony viscosity levels (ML1+4 at 100°C value of 60) before the addition of CB and NC for all types of rubber matrices. The viscosities of the master batches are kept at the same level in order to nullify the viscosity factor of the matrices for the dispersion of filler during the compounding stage. In this regard, the average mixing times for the master batch preparation of NR, ENR-25 and ENR-50 were maintained at 4, 5 and 7 min respectively. Thereafter, 1 phr antioxidant (TQ) was added. Then, NC, ZnO, stearic acid and HAF were added in sequence. To achieve better dispersion, NC was added before the addition of HAF. After NC addition, the compound was passed three to four times through the rollers having a tight nip gap of 1 mm. Finally, the rollers were cooled by passing chilled water, and subsequently, accelerators (CBS and TMTD) and sulphur were incorporated to obtain the desired composites. Thus, the total mixing times for NR, ENR-25 and ENR-50 based compounds were maintained at 15, 16 and 18 min respectively. The optimum cure times of the compounds were determined using an oscillating disc rheometer (Monsanto Rheometer 100, USA) equipped with a digital thermologger. The rheometer operated at 150°C for 0·5 h maintained a ±3° arc oscillation. After mixing, the rubber nanocomposites were allowed to settle for 24 h at room temperature (25°C). Finally, the nanocomposites were moulded in the form of 1·5–2 mm thick sheets in an electrically heated hydraulic press at 150°C. For each sample, the moulding time was maintained according to the respective optimum cure time. The formulations and designations of all the rubber nanocomposites are compiled in Table 1.
Designations and formulations of NR, ENR-25 and ENR-50 compounds (all ingredients are measured in parts per 100 g of rubber)
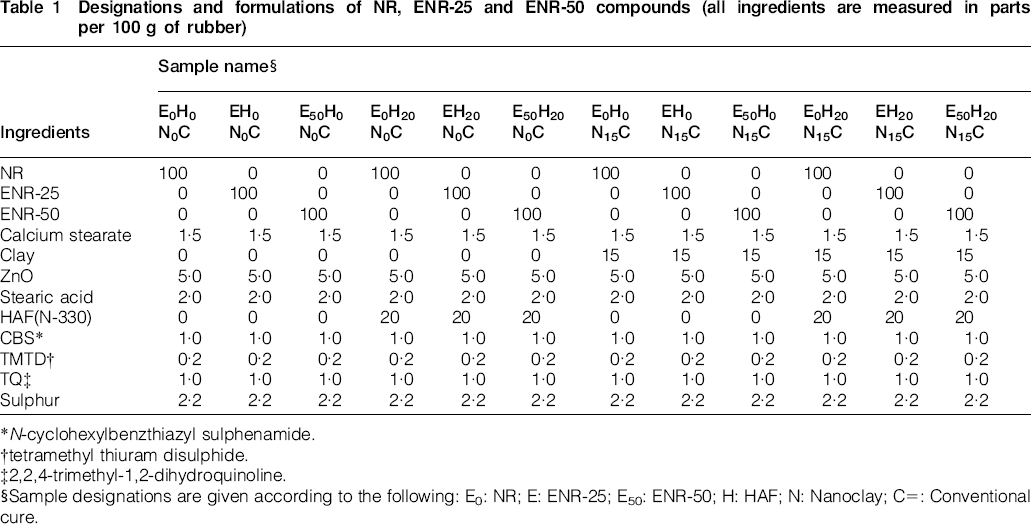
N-cyclohexylbenzthiazyl sulphenamide.
tetramethyl thiuram disulphide.
2,2,4-trimethyl-1,2-dihydroquinoline.
Sample designations are given according to the following: E0: NR; E: ENR-25; E50: ENR-50; H: HAF; N: Nanoclay; C = : Conventional cure.
Characterisation
SAXS
SAXS was performed on compression moulded nanocomposite sheets of 1×1 cm dimension having thicknesses of 1·5–2·0 mm at room temperature. X-ray (beam size = 0·2 mm in diameter) is generated with Cu Kα radiation from a 1·2 kW rotating anode X-ray generator (007 HF, Rigaku Denki Co. Ltd, Japan) using a two-dimensional multiwire detector. The sample detector distance (1·5 m) allowed a ‘q range’ of 0·0065–0·12 Å−1 [q = 4π/λ sin (θ/2), where λ is the X-ray wavelength (0·1545 nm), and θ is the scattering angle]. The scattering intensity after subtraction of the background was circularly averaged. Curve fitting using the unified model has been executed by Igor software (USA). The range of q values used was within 0·0065–0·12 Å−1.
Transmission electron microscopy (TEM)
The samples for TEM analysis were prepared by ultracryomicrotomy using a Leica Ultracut EM FCS GmbH (Austria). Freshly sharpened glass knives with cutting edge of 45° were used to get cryosections of 50 nm thickness. Since the composites are elastomeric in nature, the sample temperature during ultramicrotomy was maintained at −80°C, which was well below the glass transition temperature Tg of composites. Below Tg, rubber samples existed in the hard glassy state, thus facilitating ultracryomicrotomy. The cryosections were collected and directly supported on a copper grid of 300 mesh size. The microscopy was performed later using a TEM (JEOL JEM-2100, Japan) operated at an acceleration voltage of 200 kV and a beam current of 145 A.
Swelling
Previously weighed circular rubber nanocomposite samples were allowed to swell in toluene at 35°C for 72 h, which is the equilibrium swelling time. The weights of the swollen testpieces were measured. Finally, these were dried in a vacuum oven at a constant weight. The number of active network chain segments per unit of volume (cross-linking density) was determined by the Flory–Rhener equation.
Mechanical properties
The mechanical behaviour of the nanocomposites was investigated by the tensile test. The usual dog bone shaped specimens for the measurement of the mechanical properties were punched out from the moulded sheets with ASTM Die-C. The measurement was carried out in a Hioks–Hounsfield universal testing machine (Test Equipment, Surrey, UK) maintaining a crosshead speed of 500 mm min−1 at 35°C. For each samples, the averages of five tests are reported. The percentage error in stress, elongation at break (EB) and tensile strength (TS) measurement is ±2, ±5, ±2% respectively.
Dynamic mechanical analyses
Dynamic temperature sweep was conducted under dynamic tensile mode at the frequency of 1 Hz and amplitude of ∼11·0 μm using a TA instruments DMA 2980 V 1·7B, manufactured in Lukens Drive New Castle, DE, USA. Rectangular specimens of about 19×6×1·5 mm were subjected to sinusoidal stress (∼4 MPa) and were heated from −70 to +120°C at a rate of 2°C min−1.
Thermogravimetric (TG) analyses
The TG analyses were carried out using a TA instruments (Lukens Drive, New Castle, DE, USA) TGA model Q 50. The samples of about 5–10 mg were heated from ambient temperature to 600°C in the N2 atmosphere, maintaining a heating rate of 20°C min−1. The data of the weight loss versus temperature were recorded in the TA Instrument's Q series explorer software. The analysis of the TG and derivative TG curves was performed using a TA Instrument's Universal Analysis 2000 software, version 3.3B.
Results and discussion
SAXS
All the SAXS derived plots are analysed based on unified approach, which can take into account the overlap of various morphological features in a general way. Beaucage and Schaefer described how Guinier's law and structurally limited power laws can be derived from mutually exclusive scattering events.12 In the simplest case, the observed scattering is a summation of two components, and the equation is as follows
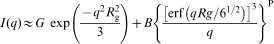
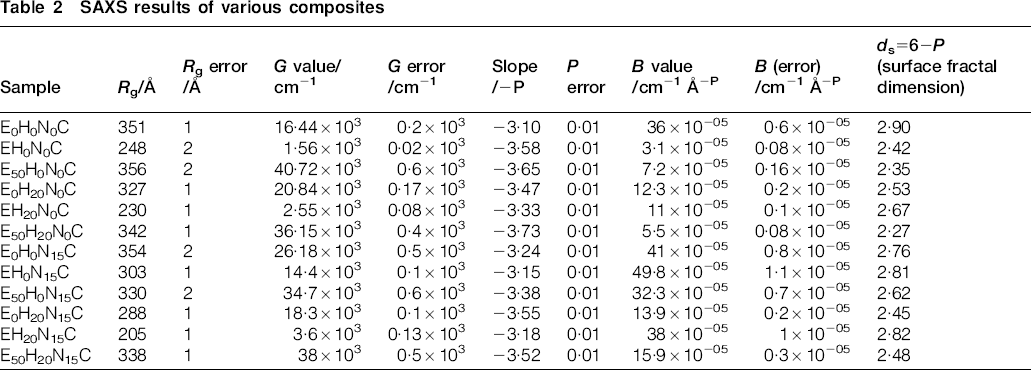
Table 2 shows the ds values of various unfilled and filled samples. For the unfilled samples, the ds value continually decreases with increasing epoxy percentages of the matrices. With increasing epoxy percentages, the extent of free volumes Vf continually reduces owing to the increased secondary forces operating between the chains. The higher fluctuation in electron density in E0H20N0C can be attributed to the higher proportion of Vf in the sample, as it has been established that the electron density between a solid phase and an air phase is ∼10 times larger than the electron density difference between two solid phases.15 In the filled matrices, Vf should be lower as compared to the unfilled samples. Accordingly, the contribution of solid/air interfaces in governing the fluctuation of electron density in the filled samples would be less influential as compared to that of the unfilled samples. Such reduction in the contribution of solid/air interfaces can be observed in E0H20N0C and E50H20N0C. Therefore, the ds values show the following: E0H20N0C<E0H0N0C and E50H20N0C<E0H20N0C (Table 2). Surprisingly, the ds value for EH20N0C is >EH0N0C. Since filler addition cannot increase the extent of Vf, the added CB can be responsible to increase the extent of polymer/CB interfaces. Such increase in the interface results in higher ds value for EH20N0C as compared to EH0N0C. In this regard, it can be presumed that the CB distribution in EH20N0C is much more uniform as compared to those of E0H20N0C and E50H20N0C. Among the solely clay filled samples, the ds value for E0H0N15C is less than that of E0H0N0C. On the contrary, the ds values for EH0N15C and E50H0N15C are increased as compared to the respective unfilled samples. Gradual replacement of the polymer free volume interfaces with polymer/clay interfaces is again the dominant factor in these cases. In ternary samples, the CB/clay interfaces can contribute substantially. The highest ds value for EH20N15C indicates the formation of hybrid filler microstructures constituting of greater number of nanounits, halos as compared to E0H20N15C and E50H20N15C.
SAXS results of various composites
TEM
Figures 1–3 show the dispersion of NC in E0H20N15C, EH20N15C and E50H20N15C respectively. The most uniform clay dispersion constituting of exfoliated and intercalated forms can be observed in EH20N15C followed by E0H20N15C. According to Park and Jana,16 the epoxy/amine ratios of <1 and 1≫are incapable of generating an epoxy network of high molecular weight. Hence, the exfoliation of clay galleries is less possible in E0H20N15C and E50H20N15C. Thus, higher exfoliation possibilities in EH20N15C can be the reason behind the formation of greater number of nanounits in the sample. Accordingly, it gives the highest ds value among all the samples (Table 2).
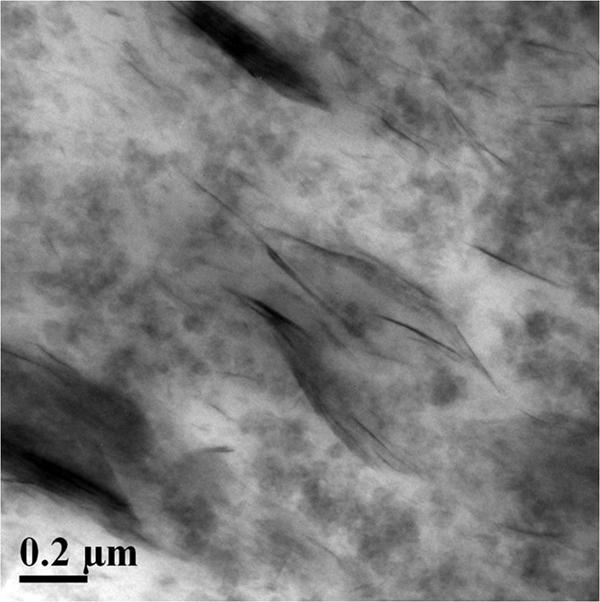
Image (TEM) showing distribution of NC in E0H20N15C
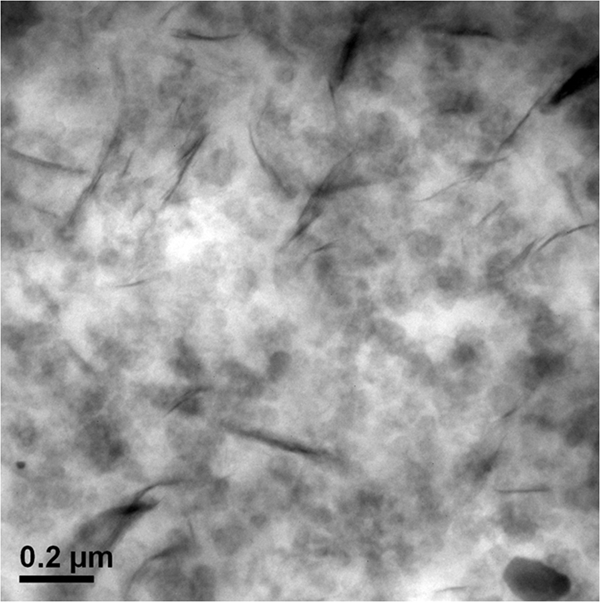
Image (TEM) showing distribution of NC in EH20N15C
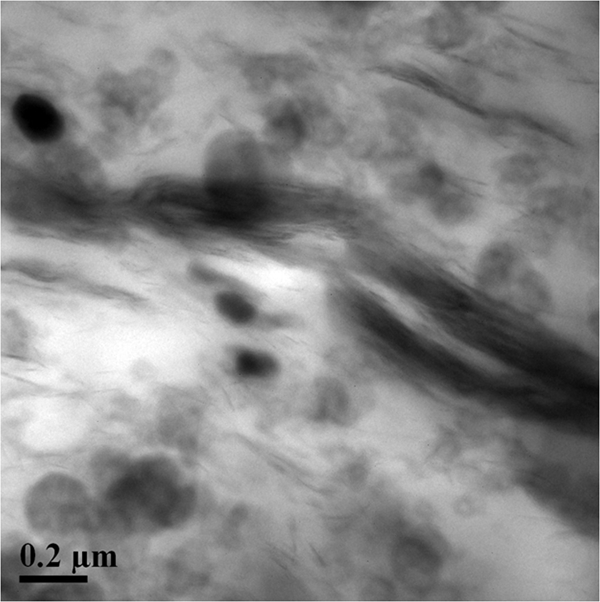
Image (TEM) showing distribution of NC in E50H20N15C
Swelling
Swelling measurements were utilised to determine the cross-linking density of the samples. Since, at equilibrium, the chemical forces tending to dissolve the rubber in a liquid are balanced by restraining forces exerted by the rubber network, the Flory–Rhener equation can be used to estimate the cross-linking density
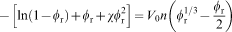
Here, φr was calculated using the following expression

It can be noted that the n value increases as the epoxy percentages are increased in all the unfilled and filled samples (Table 3). Moreover, n is enhanced in the presence of filler(s). The only notable exception is in E0H0N15C, wherein the clay filled sample shows a lower n value as compared to E0H0N0C. A lower n can be originated owing to the poor NR–clay interaction, which is attributed to the lower extent of polymer/filler interface formation. Such poor polymer/filler interface formation can be observed earlier in the SAXS experiment, where the ds value of E0H0N15C is less than that of E0H0N0C (Table 2). At all the epoxy levels, CB addition results in higher improvement in n as compared to the improvement resulting after NC addition. Moreover, with the increase in epoxy level, clay becomes more effective in improving the n value of the unfilled matrix. Such improvement can be attributed to the higher extent of possible epoxy–amine reactions during curing at 150°C as the number of epoxy groups is increased. In this regard, the extent of synergism (A−B) in ternary samples is evaluated, which shows that the highest synergism is obtained for a ternary sample devoid of epoxy followed by 25 and 50% epoxy containing samples (Table 3). This implies that the extent of synergism in ternary composites reduces with the increase in epoxy percentages in the matrix. In ternary samples, some of the amine groups can be involved in H bonding with functional groups of CB. Thus, epoxy–amine reaction during curing becomes less intense in ternary samples as those amine groups are engaged in the H bond formation with the functional groups of CB.
Swelling results showing synergistic effect in cross-linking density improvement in ternary composites
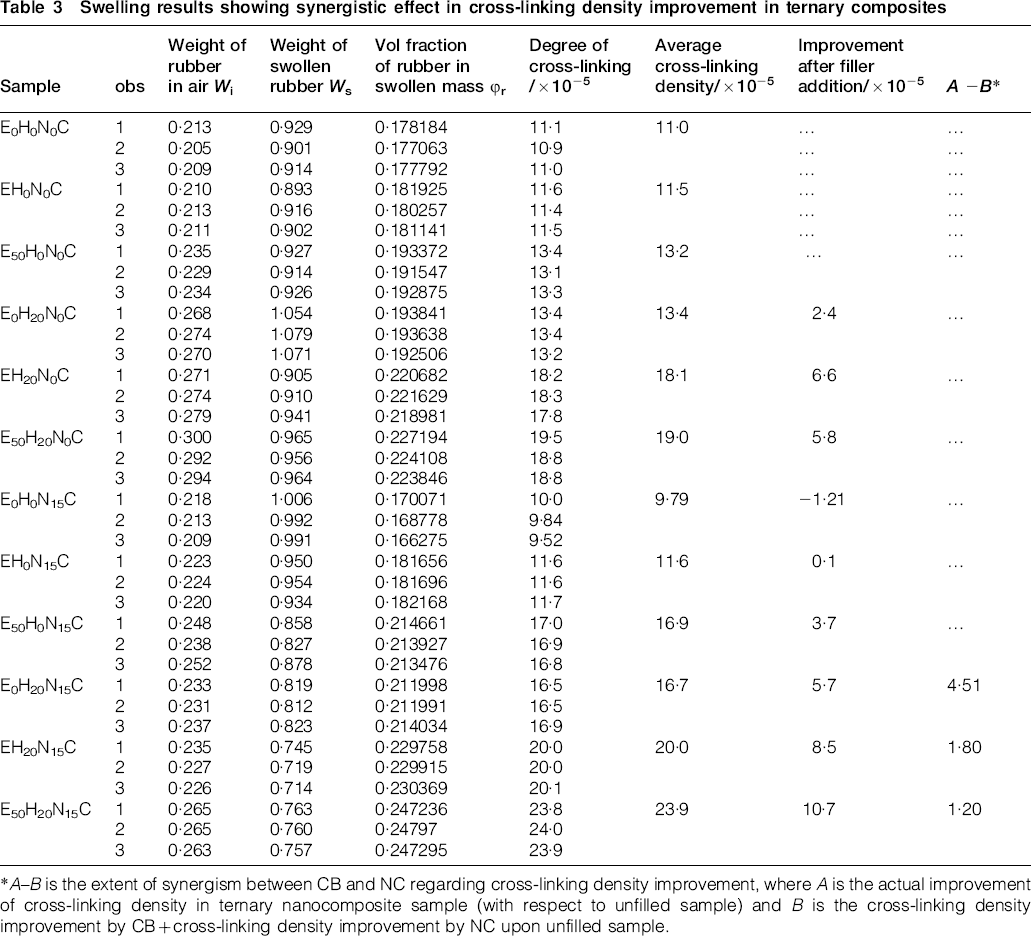
A–B is the extent of synergism between CB and NC regarding cross-linking density improvement, where A is the actual improvement of cross-linking density in ternary nanocomposite sample (with respect to unfilled sample) and B is the cross-linking density improvement by CB+cross-linking density improvement by NC upon unfilled sample.
Mechanical properties
To substantiate the swelling results, tensile measurements have been carried out. Figure 4 depicts the stress–strain plots for all the filled and unfilled samples. Figure 5 shows the level of synergism at different epoxy percentages at three strain levels (100, 200 and 300%). In Fig. 5, the term Th is the sum of L and M. Here, L is the change in stress level of the unfilled matrix after the addition of 20 phr CB, and M is the change in stress level of unfilled matrix after 15 phr clay addition. Pr is the actual improvement of modulus of the ternary composites as compared to the respective unfilled matrices. Interestingly, at all strain percentages, the stress level for the unfilled samples increases with the increased epoxy percentages. In the ternary composites, at all strain levels, the extent of synergism between CB and NC reduces with the increase in epoxy percentages (Fig. 5). A similar trend in synergism with respect to cross-link density improvement by CB and NC has been observed earlier in the swelling experiment (Table 3). For the unfilled samples, the TS as well as the EB value is noted to be increased with the increase in epoxy percentages (Fig. 4). Among the CB filled samples, a similar trend is retained. On the contrary, for the clay filled samples, the trend is exactly reverse for EB values. The lubrication effect of the alkylammonium chains is increasingly affected as these chains are more likely to be involved in epoxy–amine reactions in samples having greater number of epoxy groups. Among the ternary samples, both TS and EB values are the highest for EH20N15C (Fig. 4b). Lower levels of both TS and EB values for E50H20N15C suggest the presence of filler aggregates (Fig. 3) which act as stress concentration points responsible for resisting the orientation of the chains at higher strain levels. Owing to the presence of a higher number of epoxy groups, the probability of epoxy–amine linkage formation is more in E50H20N15C as compared to EH20N15C. A higher involvement of octadecyl amine chains in epoxy–amine linkage formation may lead to the detachment of octadecyl amine chains from the clay counterpart. This may lead to the reduction in repulsive forces between clay platelets, giving rise to clay aggregate formation.
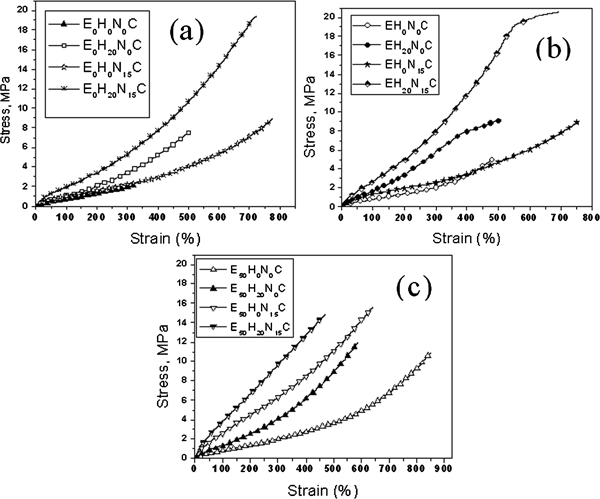
Tensile properties of samples based on a NR, b ENR-25 and c ENR-50
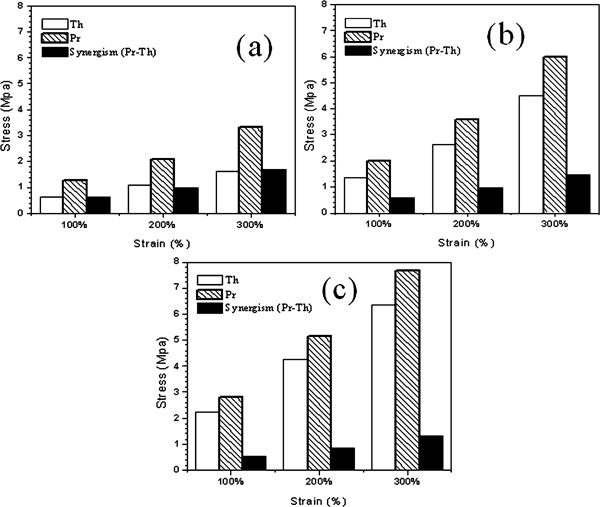
Synergistic effect of carbon black and NC in improving tensile modulus of unfilled matrices based on a NR, b ENR-25 and c ENR-50
Dynamic mechanical analyses
In all the three types of matrices, the tan δmax values decrease with increasing filler loading, owing to the restriction of polymer segmental mobility and decrease in volume fraction of the polymer (Figs. 6–8). Similarly, irrespective of the epoxy content, the tan δmax values of the 20 phr CB filled matrices are less than the corresponding 15 phr NC filled matrices. As a whole, the increased epoxy content results in reduced tan δmax values.

Damping properties of NR based samples
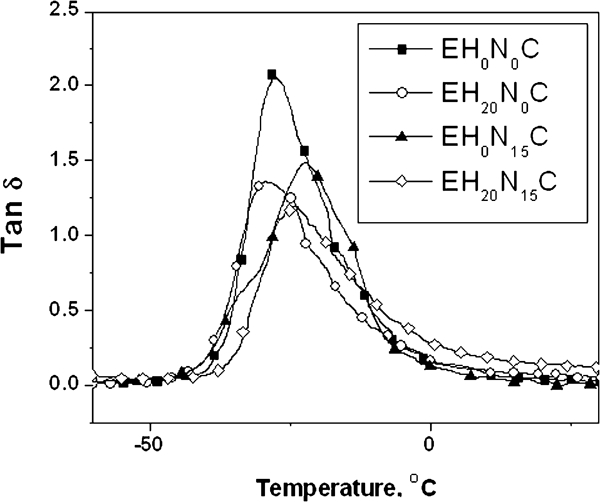
Damping properties of ENR-25 based samples
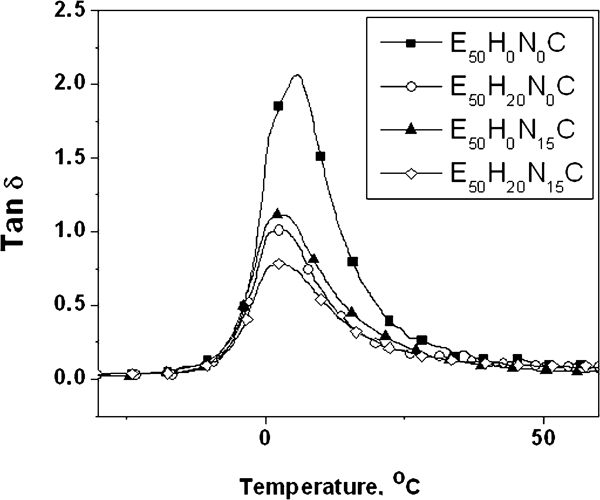
Damping properties of ENR-50 based samples
The tan δ peak width is indicative of the enhanced volume of the interface. This also indicates the various relaxation processes and filler aggregate breakdown especially at the interface. Among all the composites, the ENR-25 based samples show substantial broadening of the tan δ peak, which indicates the effectiveness of NC and CB towards the enhancement of volume of the polymer/fibre interface and the NC aggregate breakdown at the interface (Table 4). The highest synergistic effect in the context of tan δ peak broadening has been observed in EH20N15C. Thus, the interfacial area should be the highest for EH20N15C, which is substantiated earlier by the highest ds value (Table 2) and better dispersion of NC in the matrix (Fig. 2). A poor tan δ peak broadening for E50H20N15C again implies the presence of lower interfacial volume, which suggests the presence of filler aggregate in the sample (Fig. 3) earlier reflected in the lower EB value and TS as compared to EH20N15C (Fig. 4).
Volume of filler/polymer interface and effectiveness of fillers on moduli of composites
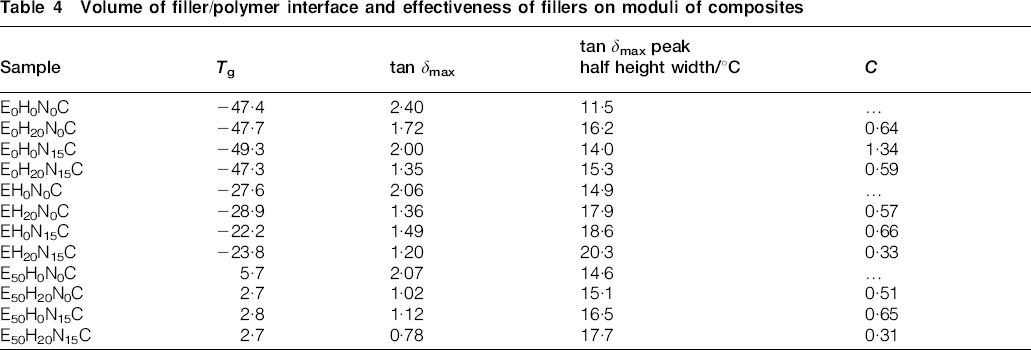
The effectiveness of fillers on the moduli of composites can be represented by a coefficient C given by the equation

As a whole, C values and the tan δ peak broadening effect establish the higher reinforcing effect of fillers in the case of EH20N15C.
Thermogravimetric analyses
Table 5 shows the temperatures corresponding to 5, 25 and 50% degradation and Tmax respectively for various samples. At all the degradation levels, the degradation temperatures of the unfilled matrices increase with the epoxy percentages. With CB addition, the degradation temperature of all the unfilled matrices increases irrespective of the epoxy content. On the contrary, with increasing epoxy content, the thermal stability of the clay filled composites reduces continuously. It is expected that octadecylamine chains can react with the epoxy groups during moulding at 150°C to give aminoalcohols. Here, amines act as nucleophiles, and nucleophillic SN2 attack on the strained epoxy rings relieves ring strain. In this way, the primary onium salt
 probably loses a proton readily. Thereafter, it reacts with an epoxide ring to form secondary amine and hydroxyl moieties.17 The octadecylamine chains, earlier shielded by the clay platelets, become directly exposed to the heat wave. Therefore, these amine chains become more susceptible to thermal degradation, especially in the epoxy populated composites. In fact, the decomposition of surfactant molecules occurs within 200–500°C.18 Moreover, during thermal degradation, detachment of octadecyl amine chains from the clay platelets can cause the aggregating tendency of individual clay platelets. This can result in coarser dispersion of clay in the epoxy populated matrix, which can accelerate thermal degradation. This is evident as the exfoliated clay platelets are more effective in blocking heat and volatile decomposition products out of the material as compared to clay tactoids.19 In the presence of clay, the thermal stability of NR increases tremendously. In this case, the polymer molecules may be occluded by the clay aggregate in such a fashion that the incoming heat wave cannot easily penetrate the clay aggregate to reach the polymer. In ternary composites, the octadecylamine amine chains of clay can be involved in H bonding with the functional groups of CB. Therefore, these amine chains are less involved in the epoxy–amine reaction at 150°C during moulding. Thus, in the presence of CB, the epoxy groups remain less involved in epoxy–amine linkage formation. As a whole, CB protects both epoxy groups and amine chains from the incoming heat wave.
Degradation temperatures for various samples
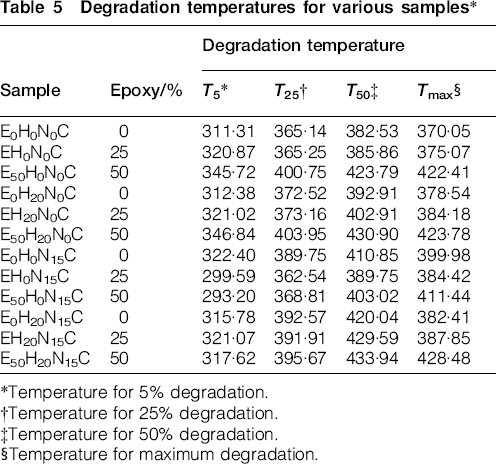
Temperature for 5% degradation.
Temperature for 25% degradation.
Temperature for 50% degradation.
Temperature for maximum degradation.
Conclusions
Among the ternary samples, the ENR-25 based sample is the best in terms of uniformity in distribution of filler, filler effectiveness, interfacial volume and interfacial roughness. Such filler distribution is reflected in its TS and EB values.
With the increase in epoxy percentages of the matrix, the cross-linking density at ambient temperature increases for both unfilled and filled samples. In ternary samples, the synergistic effect between NC and CB in improving the cross-linking density is evident. The extent of such synergistic effect reduces with increasing epoxy percentages in the matrix. The outcome is well substantiated in tensile property measurements.
Thermal stability increases with increasing epoxy percentages. The trend remains unaltered in solely CB filled as well as ternary nanocomposite samples. For solely NC filled samples, the trend is just the reverse.