
Abstract
Cure monitoring has received considerable interest for industrial applications that use thermosetting resins and advanced composites. In these applications, the degree of curing is critical for the structures’ high quality and performance. This paper demonstrates the excitation of Lamb waves with low profile surface mounted piezoelectric transducers for the characterisation of symmetric composite laminates at different cure levels. The response signals were processed by extracting their instantaneous characteristics through ensemble empirical mode decomposition. The paper investigates the potential benefit from the use of piezoelectric transducers, which could monitor the life cycle of complex composite structures from the early manufacturing stages to the later aging stages. In these stages, structural monitoring is essential for the prevention of possible catastrophic damage. The response signals successfully captured the different cure levels, and the employed analysis showed good agreement with the increasing cure degree.
Introduction
The role of cure monitoring is to provide information about the progression of the curing reaction. The degree of curing plays an important role in the mechanical performance of epoxy based composite materials in several industrial applications that require low weight, high stiffness, high strength and fatigue resistance. Poor cure conditions result in the development of two different zones within the epoxy, namely uncured regions and degraded regions, due to overcuring. Previous research carried out by the authors has investigated the structural integrity of adhesively bonded patches under cyclic loading with guided ultrasonic waves where the degree of the adhesive s curing can affect the efficiency of the repair.1
The major challenge in cure monitoring is the correlation of the obtained signals with the physical phenomena that take place during curing. The methods that have been employed have made little progress towards this target. Therefore, new approaches should be established, which ideally need to be incorporated during the manufacture of the components in order to ensure the achievement of optimum cure conditions and of high-quality performance. The paper first demonstrates a literature review on the existing curing techniques. Next, a brief review on the theoretical background of the work is demonstrated which includes a short review of the guided ultrasonic waves testing method, an explanation of the concept of the time-frequency based analysis, and finally, a demonstration of the empirical mode decomposition (EMD) and the ensemble empirical mode decomposition (EEMD).
Theoretical background
Cure monitoring
Temperature or thermal conductivity monitoring is the most conventional method of cure monitoring, which exploits the exothermic nature of the cure process. Some of the most widely used techniques are differential scanning calorimetry and dynamic mechanical analysis.2However, the vulnerability of the thermocouples to damage and their low sensitivity make this approach unsuitable for complex structures. Therefore, cure monitoring by means of assessing the molecular level of the degree of cure has lately received considerable interest.
Cure monitoring with ultrasonic bulk waves is a widely used method that assesses the velocity or the time of flight of a pulse that travels between the transmitter and the receiver.3, 4 Sofer and Hauser5observed the monotonic increase in the pulse velocity with respect to the increasing cure time and the ultrasonic attenuation near the gel point. Limitations of this method involve the difficult access to testing equipment, which makes online monitoring not applicable. In addition, high modulus materials might exhibit substantial attenuation.
Optical fibres have been introduced in order to overcome the offline nature of ultrasonic bulk wave testing.6 Optical fibres offer many application advantages especially for composite materials, since they are small, light and easily embedded in any direction. In addition, they do not affect the mechanical properties of the material.7 However, the testing equipment associated with optical fibres can be expensive, and the fibres can exhibit fragile behaviour in certain applications.
Among the methods that are based on the electric properties of the material, dielectric cure monitoring is perhaps the most popular.8 The mobility of the material's ions is measured with electrodes, which apply an alternating voltage, by estimating the resulting time varying current. The applied voltage develops an electric field in the sample, which, in turn, becomes electrically polarised and can also conduct net charge from one electrode to the other.9The method has shown particular success in addressing cure levels in carbon fibre composites.10, 11 Despite the effectiveness of this method, it fails to adopt fundamental correlation between the dielectric signal and the processing parameters.12 In addition, it is a costly and highly energy demanding method, while its dielectric probes remain in the material after the end of curing without any particular application.
Optical property based methods have been employed to monitor the cure degree by assessing the refractive index or the spectral absorption of the materials with optical fibre sensors.3 Some examples involve spectroscopic methods, namely infrared spectroscopy13 and Raman spectroscopy.14Those can be applied in situ. However, as mentioned before, the application of optical fibre sensors has several disadvantages related to their strength and their cost.
Non-destructive testing with Lamb waves
The mechanisms that take place in the interior of a composite material during curing need to be correlated with the information extracted from Lamb wave propagation. Lamb waves are elastic deformations that, when they propagate through the material, they correspond to a mechanical deformation.4 As the curing time increases, the viscosity of the resin drops and the material becomes stiffer. This is expected to have an impact on the travelling velocity of the wave and on its dissipative attenuation.
A comprehensive analysis of guided waves is given by Viktorov.15 Lamb waves form a category of guided waves that propagate in plate-like panels in two possible modes, the symmetric and the antisymmetric. The basic characteristic of Lamb waves is their dispersive nature. At any given value of the frequency–thickness product, more than one mode can exist. As this value increases, the number of the propagating modes increases, making the signals difficult to interpret. Therefore, efforts are made to keep the excitation frequency range in damage monitoring applications low.
The generation of Lamb waves can be accomplished with piezoelectric transducers (PZTs). Only a small number of transducers can scan reasonably long distances by introducing an elastic perturbation at one point and by sensing it in another. Piezoelectric transducers are commercially available at reasonable prices, and they can be either bonded on the tested surface or inserted within the layers of the laminate in the form of a smart layer. These transducers can be used for in situ cure monitoring of the component, and they can remain embedded in the structure for future monitoring. Even though there has been extensive research on damage monitoring with Lamb waves, their potential in cure monitoring applications has not been widely investigated. In the past, an approach was proposed for the in situ cure monitoring of resin through the excitation of guided waves with the help of a metallic rod that was impregnated in a resin tank.16 However, this approach might not be applicable on thin laminate composite samples.
Time–frequency analysis for Lamb waves
Several studies have focused on frequency analysis of the signals for damage detection purposes. Some of the most popular proposed methods include fast Fourier transform, power spectrum estimation and envelope spectrum analysis. In the case of complex structures, though, the response signals can be non-linear and non-stationary. The conventional time–frequency analysis approaches fail in employing a pattern that can take into consideration the nature of these signals, and they can potentially lead to misleading results.
Recent approaches to the time–frequency analysis of more complex signals include wavelet transform,17short time Fourier transform18 and Wigner–Ville distribution.19However, wavelet transform highly depends on the selection of the basic wavelet function and only adopts a non-locally adaptive approach for the calculations, which can lead to energy leakage in certain frequency regions.20 Short time Fourier transform also highly depends on the selected time window, which can lead to low time–frequency resolution. Finally, Wigner–Ville distribution fails to deal with the existence of negative power for some frequency ranges.
This paper demonstrates the use of Hilbert transform (HT)21, 22 for the extraction of the instantaneous characteristics of the response Lamb waves for all cure levels. First, the decomposition of the response signals was carried out through EEMD. The EEMD emerged from the need to improve empirical mode decomposition (EMD), and it decomposes multicomponent signals into their intrinsic mode functions (IMFs), which exhibit monocomponent behaviour. After the signal's decomposition, the filtered monocomponent signal is usually post-processed with HT, its instantaneous characteristics are obtained and the time–frequency map of the signal is plotted with respect to the structural conditions of the application.
The decomposition of the signal is necessary since HT is meaningless for multicomponent signals.23 This method provides certain advantages over the more traditional time–frequency approaches since it is an adaptive method with no need for an a priori defined basis, which reduces the energy leakage problem and provides higher accuracy for non-linear and non-stationary cases. Several successful applications can be found in literature, which highlight its great potential.24–27
Empirical mode decomposition
The fundamental procedure of EMD is the sifting process. An IMF is defined as a narrow band signal whose number of extrema and the number of zero crossings should either be equal or differ at most by one over its entire length. In addition, the mean value of the envelope of the signal defined by the local maxima and the envelope defined by the local minima should be zero at any point. According to these conditions, the following steps are performed for the decomposition of a time signal x(t) into its IMFs.21
First, the identification of local maxima and minima of x(t)
is performed, and the generation of upper emax(t)
and lower envelope emin(t) is calculated by initialising
the method of cubic spline interpolation. Then, the calculation of the mean m(t)
from upper and lower envelopes is possible according to the following equation


Ensemble empirical mode decomposition
The EEMD is a noise assisted method whose aim is to overcome the problems related to EMD by adding white noise to the original time signal. This solves the problem of mode mixing by the projection of parts of the signal on proper scales of reference established by the white noise, which effectively occupies the entire time–frequency space.29After the extraction of the IMFs, the added noise is removed by a time–space ensemble mean. The steps that are followed are summarised in this section.28
First, the number of ensemble NE and the amplitude
of the added white noise An are defined, allowing
the generation of white noise nm(t)
and its addition to the original time signal. The new time signal will involve
the sum of the original time signal x(t)
and the white noise
If the trial number is smaller than the number of the defined ensemble m<NE, then the algorithm defines m as m = m+1.
In this way, a new white noise is generated, and the procedure is repeated
again. The final step is the calculation of the ensemble mean of the corresponding
IMFs
 of the decomposition as well as of the
corresponding residue
of the decomposition as well as of the
corresponding residue


Hilbert transform
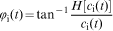
There have been a number of different definitions for instantaneous frequency, among which the most popular is the one by Gabor31and Ville.32 According to those, the
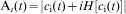
analytical signal associated with each IMF ci(t)
is first defined as


Experiment
Symmetric carbon prepreg laminates were manufactured in three cure levels. The samples consisted of four carbon prepreg layers with a (0/90)s stacking sequence. Each lamina's thickness was 0·25 mm. The curing temperature was 177°C, and all samples were cured under vacuum conditions in a programmable oven. Two PZTs (diameter, 10 mm; thickness, 1 mm) were attached on the surface of the samples operating in pitch catch mode (Fig. 1).
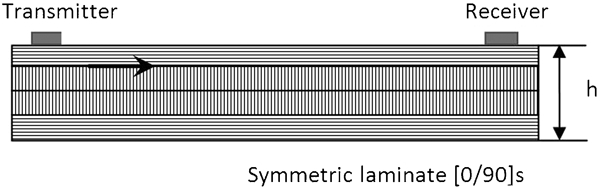
Test configuration; four-ply symmetric laminate with two bonded PZTs operating in pitch catch mode
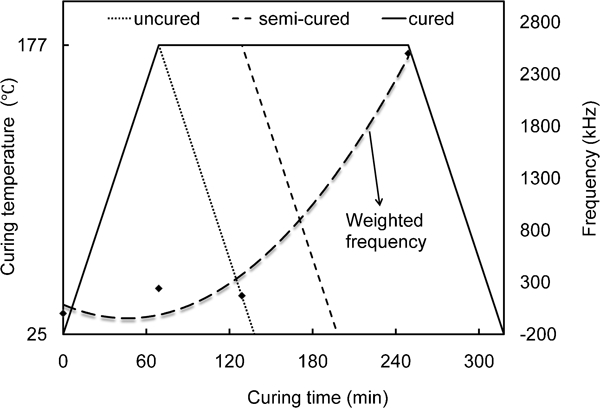
The temperature was programmed to reach the curing temperature and then to remain stable for ∼3 h until the sample was fully cured, after which it was gradually decreased until it reached room temperature. The procedure was stopped at different stages of the curing cycle in order to obtain samples with different cure degrees (Fig. 9). For the purpose of reliable comparison between each testing case, the test configurations were the same for all cases. The input signal, generated by a TTi TGA1230 30 MHz wave generator, was a 185 kHz excitation frequency, 10 V peak to peak 5-cycle sine pulse modulated by a Hanning window (Fig. 2). The data acquisition was performed by a Le Croy LT224 oscilloscope at a 50-MS/s sampling rate.
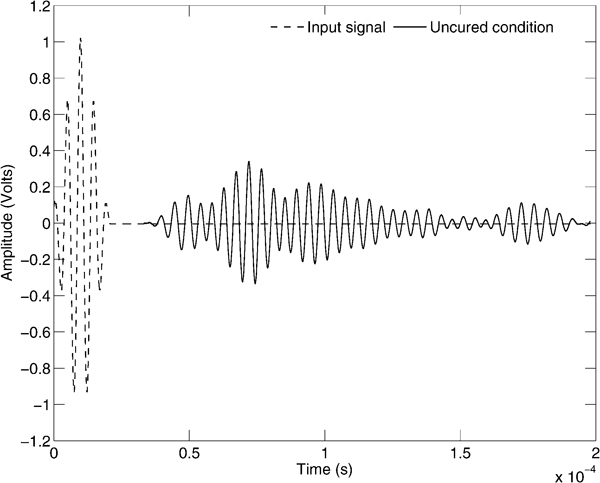
Excitation signal and typical response signal for uncured condition, properly scaled for comparison
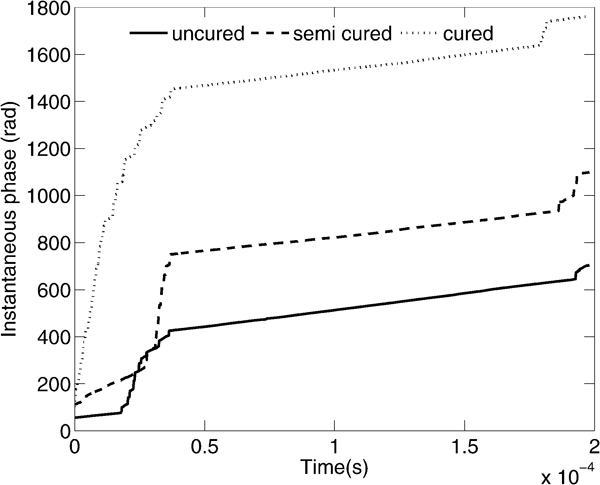
Instantaneous phase for all curing levels (IMF 5)
Results
The signal demodulation results are illustrated in Fig. 3. The ratio of the standard deviation of the added white noise and that of the original time signal was 0·1, and the ensemble value NE was 100. The EEMD analysis decomposed the signal in 12 IMFs. In Fig. 3, only the IMFs that belong to the most representative results are presented. The first IMFs are of high frequency, with a significant noise, and as the analysis proceeds, the IMFs belong to the low frequency region. The residue is a monotonic signal, which cannot be further decomposed.
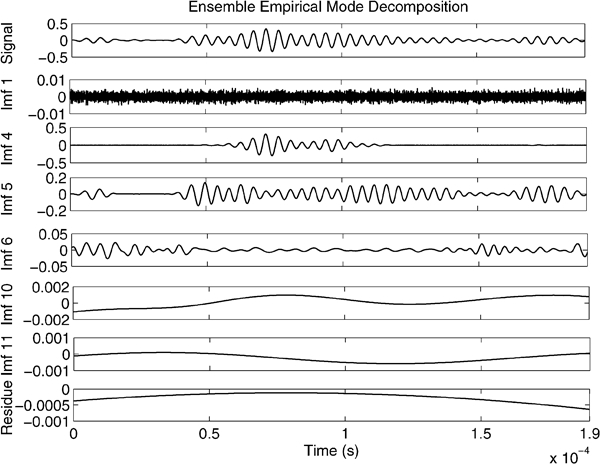
Intrinsic mode functions obtained through EEMD for uncured condition
The power spectrum density (PSD) of all the resulting IMFs was plotted, and IMF 5 was selected as the IMF whose PSD coincided with the PSD of the original time signals for all cure conditions [i.e. agreement of the main carrier peaks around the excitation frequency region (Fig. 4)]. Intrinsic mode functions of higher or lower frequencies deviated from this behaviour.
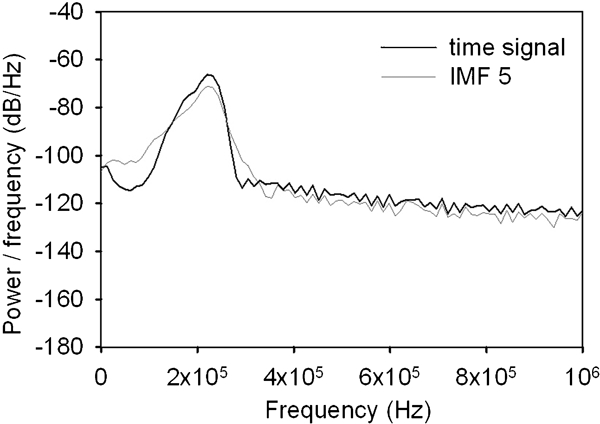
Power spectrum densities for uncured condition response signal and selected IMF; carrier peak is centred on excitation frequency
The initial argument that the optimum IMF is the one whose PSD agrees with the PSD of the original time signals around the excitation frequency is verified in Fig. 5. The response signal for the uncured condition is plotted against the selected IMF. The energy content, which in this case can be visually defined by the phase of the waveform cycles, fully coincides for both signals. This analysis was repeated for all cure levels and showed very similar results.
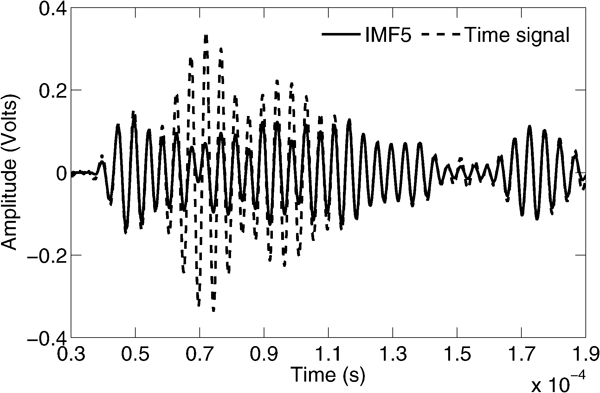
Comparison between selected IMF and original time signal for uncured condition
The time–frequency spectrum is displayed in Fig. 6. The extraction of the instantaneous frequency was performed with HT. The figure is divided into three regions according to their dominant behaviour. The first and third regions correspond to the noise dominant areas where the amplitude of the time signal was too low and hence more vulnerable to noise effect, which agrees with observations made in the work of Quek et al.26For the first region, this phenomenon could be attributed to the fact that the received signal has not been fully captured by the sensor in the early time intervals due to an observed time delay, which increases as the curing level increases. This, in turn, could be an effect of energy scattering over the increasing level of cross-linking that takes place in the resin with respect to curing time. For the third region, this phenomenon could be attributed to the multiple reflection and refraction of the propagating wave, which results in loss of energy by means of lower amplitude. The second region corresponds to the structural response region and is the region that can only be isolated for the assessment of the samples’ structural integrity.
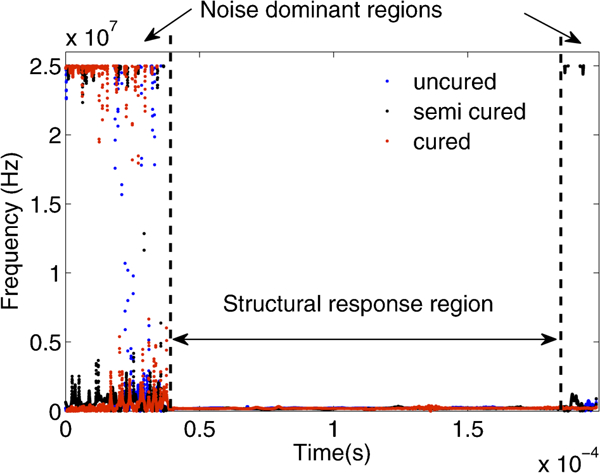
Instantaneous frequency for all cure levels (IMF 5)
The structural response region was isolated, and the instantaneous characteristics, frequency and amplitude, are displayed in Fig. 7. The heat in the curing process was evenly distributed over the cured samples. Therefore, the changes in the analysed indices can only be attributed to the overall viscosity of each composite laminate, since no internal uncured/overcured regions were expected to develop. According to these assumptions, the frequency in Fig. 7 is found to vary around the excitation frequency (185 kHz). As the cure level increases, the frequency amplitude increases. The respective amplitude of the time–frequency spectrum is also illustrated in Fig. 7.
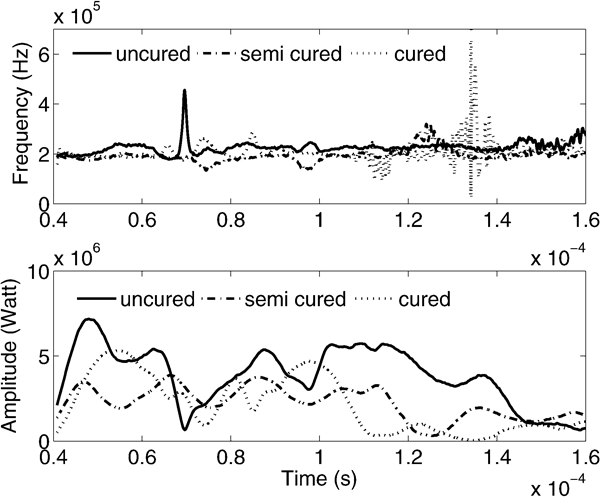
Instantaneous frequency and instantaneous amplitude for structural response region of IMF 5
A cure level index was considered for the assessment of the energy distribution mapping, which is the mean value of each frequency curve weighted by the maximum corresponding spectral amplitude, which is displayed in Fig. 8. The resulting frequency increases with respect to curing time.
Damage index with respect to cure time
Finally, the IP for the tested IMF and for all the considered cure levels is illustrated in Fig. 9. The increase in phase with respect to the cure level is the dominant assumption that can be derived. Furthermore, the IP curves are also affected by the noise dominant areas by exhibiting three regions. A high increasing rate is observed in the earlier time instants, and a steady relatively low rate is maintained in the corresponding structural response region until the IP traces slightly increase towards the end, which is also a noise dominant area.
Conclusions
The study focused on the investigation of symmetric carbon laminates in three different cure levels with Lamb waves with surface mounted PZTs operating in pitch catch mode. The response signals were captured for all cure levels, and they were further decomposed into their respective IMFs with EEMD. The optimum IMF was then selected. The criterion for this selection was the level of agreement of its PSD with the respective PSD of the original time signals in order to lose as less information as possible. The energy–time spectrum displayed three regions, among which the structural response region was isolated as a testing feature. For the purposes of evaluation, a cure index was defined through the weighting of the mean instantaneous frequency with the respective maximum instantaneous amplitude for all cure levels. The results show an increase in the frequency with respect to the curing time. Finally, the estimated IP follows the same behaviour with the frequency.
The results demonstrated the application of guided ultrasonic waves for the molecular level assessment of symmetric carbon laminates. The feature extraction and the cure index were defined through the instantaneous characteristics of the signals. Ensemble empirical mode decomposition proved to be an efficient filtering tool that extracts a new time signal, which admits monocomponent behaviour. The subsequent application of HT and the definition of the weighted instantaneous frequency by the instantaneous amplitude showed considerable agreement with the increasing cure degree. Further work needs to focus on multiple cure levels in more complicated composite components such as the investigation of the bonding level of adhesively bonded composite patches. In addition, a big challenge will be the investigation of the overall structural behaviour of composite structures, including early steps of polymerisation until later stages of damage with the same embedded PZT sensors. These could be inserted within the critical layers of the laminate in the form of smart layers. Finally, further work needs to investigate the physical interpretation of the obtained results.
Footnotes
Acknowledgements
The authors would like to acknowledge the financial support from the EU 7th Framework Programme (grant no. ACP8-GA-2009-234333), IAPETUS (innovative repair of aerospace structures with curing optimisation and life cycle monitoring abilities). The authors also would like to thank Professor V. Giurgiutiu for his useful comments.
This paper is part of a special issue on Deformation and fracture of polymers and their composites