
Abstract
The scope of the present work is to present a modified model extracted by finite element method (FEM) analysis for the nanoindentation of polydimethylsiloxane (PDMS). The suggested model, based on Sneddon's equation, takes into account the specimen finite dimensions and the indenter curvature. Load–displacement curves from FEM analysis are obtained and compared with the experimental and those based on Sneddon's analysis. Sneddon's solution and FEM analysis deviate from the experiment. Thus, a new analysis is applied considering the finite tip radius effect, which results in the prediction of the elastic modulus of PDMS with 2% accuracy. A fitting analysis of a typical nanoindentation creep curve is performed using the Maxwell two-element model in order to obtain information about the time dependent properties of untreated and ultraviolet treated PDMS. The aforementioned method describes well the creep curve, especially the part attributed to viscous flow.
Keywords
Introduction
Polymers, a major category of soft materials, are typically much more compliant compared to hard materials, with modulus ranging from a few gigapascals for common glassy polymers to a few megapascals or lower for rubbery polymers.1 Determination of the mechanical properties of polymers is a complicated process due to their heterogeneous nature. Therefore, standard characterisation methods, such as compression and tensile tests, may not be applicable due to inadequate sample dimensions. In this regard, techniques that allow the examination of the mechanical properties on a much reduced scale are needed. Nanoindentation is a technique which has been widely used to characterise the nanomechanical properties of polymers, i.e. hardness H, elastic modulus E and other mechanical properties. Polydimethylsiloxane (PDMS) is a common elastomer used in many applications in bioengineering, electronics and microelectromechanical systems, as it is biologically inert with isotropic and homogeneous properties, low surface energy and good electrical properties.2 Nanoindentation testing of PDMS has attracted increasing interest since this technique allows reliable characterisation contrary to traditional methods, e.g. microhardness and tensile test.3, 4
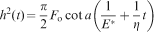
Indentation theory is based on contact mechanics, in which analytical solutions can be derived only for simple geometries. The O&P model5 is used to evaluate the nanoindentation data and is based on the early works of Hertz, Boussinesq and Sneddon,6 which were extended and modified later in order to fit different geometric conditions. For the case of cone indentation of an elastic half-space, Sneddon7 derived the explicit relation
Schematic of load control nanoindentation creep
There are many mathematical approaches combined with numerical simulations in the literature describing the nanoindentation behaviour of polymeric materials. Anand and Ames12 developed a three-dimensional finite deformation model for the elastoviscoplasticity of amorphous polymers based on the generalised Kelvin–Voigt model of classical linear viscoelasticity. Liu et al.13 developed both Burgers and Maxwell viscoelastic models for loading and unloading during the Berkovich nanoindentation experiment. Huang et al.14 investigated the transient and steady state nanoindentation creep of polymeric materials based on the Burgers viscoelastic model. The nanoindentation creep consists of the primary creep (or transient creep) and the secondary creep (or steady state creep), which are regions of decreasing creep rate and nearly constant creep rate respectively. It could be assumed that conventional linear spring and dashpot elements can be used to model the creep response of elastomers using the typical nanoindentation creep curve (creep displacement versus creep time).15 Thus, numerical simulations such as finite element method (FEM) analysis can be used, providing a numerical method of calculating complex nanoindentation problems and clarifying the above issues. This kind of analysis has a number of advantages since a great number of simulations can be performed under various conditions, e.g. complicated loads, different boundary conditions, geometries and temperatures. In addition, numerical simulations can not only save testing material and experimental time but also confront with complicated issues such as tip wear, calibration, sample geometry, etc.16 Kamran and Larsson8 used the commercial software ANSYS in order to analyse second order effects, such as friction and tip roundness, at sharp indentation of highly elastic polymers and rubbers.
In the present work, the applicability of FEM analysis in the simulation of the nanoindentation of PDMS is investigated. Load–displacement curves from FEM analysis are obtained and compared with experimental curves and those derived from Sneddon's analysis. A fitting analysis of the nanoindentation creep curve is performed based on the theoretical approach in order to investigate the viscoelastic effects on E and obtain information about the time dependent properties of PDMS. Many studies showed that creep can lead to an overestimation of E.13 A better understanding of creep would clearly improve the ability to enhance the service performance of polymers. As a result of the UV treatment of PDMS, silanol groups are introduced on its surface, and a ‘silica-like’ layer is gradually formed.17 Thus, there is significant challenge in determining the mechanical behaviour of the surface modified layer on PDMS. Experimental nanoindentation creep data for untreated and UV treated PDMS are presented with the appropriate fitting analysis.
Experimental
Material preparation
A PDMS elastomer sample has been prepared by mixing 30 g siloxane base with 4·5 g cross-linking agent. An increase in viscosity is observed during the preparation of the sample. The addition of the cross-linking agent is followed by the addition of catalyst. Its final shape (3 mm thickness with smooth surface at the top and rough surface at the bottom) is due to the casting process.18 The PDMS sample is exposed to accelerated aging conditions, i.e. exposed to repeated cycles consisting of combined exposure to UV radiation and damp heating. The aging tests are performed using the appropriate weatherometer chamber, type QUV-Weathering Testers (Q-Panel, Lab Products), according to ASTM D 4587-01 and ASTM D 4329-99. The UV radiation is produced using a lamp type UVB-313. Water in the bottom of the test chamber is heated in order to fill the chamber with hot vapour and create 100% humidity at 50°C.19 The specific set-up of the accelerated aging procedure performed in this work is as follows
8 h UV radiation with a power of 0·76 W m−2 nm−1 at 60±2·5°C
4 h water condensate at 50±2·5°C.20
Instrumentation
The nanoindentation tests in this work were performed using a nanomechanical test instrument, equipped with a Berkovich tip, which allows the application of loads from 1 to 30 000 μN. The instrument is capable of recording penetration displacement as a function of applied load with high load resolution (1 nN) and high displacement resolution (0·04 nm). In order to operate under closed loop load or displacement control, feedback control option is used (typical option when indenting viscoelastic materials, which exhibit time dependent behaviour, such as polymers). The preload (when the indenter touches the surface) was set to 0·1 μN in order to avoid surface deformation and preindent (typical low preload setting for soft, adhesive or pressure sensitive materials).21 The instrument is equipped with a scanning probe microscope, in which the sharp probe tip moves in a raster scan pattern across the sample surface using a three-axis piezo positioner. In all depth sensing tests, a total of 10 indents were averaged to determine the mean H and E values for statistical purposes, with a spacing of 50 μm (∼45% relative humidity, 23°C). The nanoindentation creep tests were run under different creep times in the range from 5 to 2000 s. Loading and unloading times were set according to similar experiments in the literature at 4 and 15 s respectively.20 After the indenter tip contacts the surface of the specimen, the indentation load and displacement are recorded simultaneously.
Numerical simulation
The analysis of nanoindentation can be very complex because of two principal non-linear phenomena,22 which are the following
elastic–plastic deformation of the indented materials
frictional contact between the indenter and the materials.
The FEM analysis provides a strong numerical method to calculate complex nanoindentation problems and to clarify the aforementioned issues. Moreover, the FEM analysis allows the determination of the stress–strain response from nanoindentation test and in correlation with experimental procedure can be a well serried qualitative tool. The FEM analysis of the nanoindentation process is performed using commercial software ANSYS.23 The basic assumption of the nanoindentation simulation is that the nanoindentation process is a quasi-static procedure since it is not influenced by dynamical phenomena, such as vibrations and shocks. The modelling procedures developed in the present study are based on a continuum mechanics description of the problem which works well for indentations to 30 nm depth.
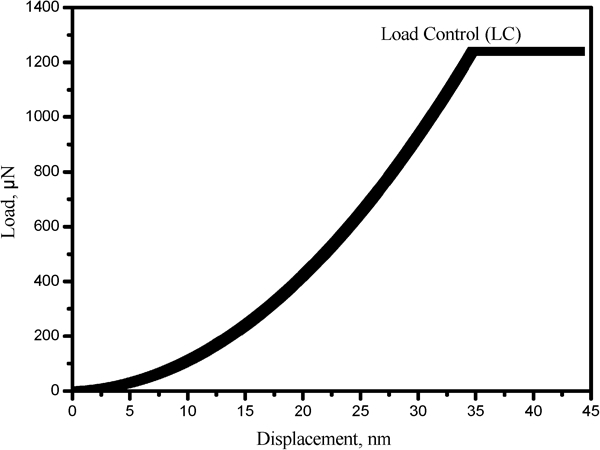
An axisymmetric model is employed in ANSYS. The Berkovich indenter is modelled as a conical indenter, symmetric to the load axis. The measured geometrical magnitude is the equivalent angle of the cone, which corresponds to the angle for which the cross-section of the cone has an area equal to that of the cross-section of the Berkovich pyramid. The friction coefficient is negligible since frictional effects as well as effects due to indenter tip roundness are small at cone indentation.9 The specimen is modelled as a deformable body and meshed by two-dimensional structural PLANE 42 element type, as shown in Fig. 2; thus, the model is first generated in the x–y plane and meshed using two-dimensional elements. VROTAT command is used to generate the three-dimensional mesh by rotating the meshed areas around the load axis by 45°.
Axisymmetric meshing of nanoindentation problem on x–y plane
The PDMS is modelled using SOLID45 elements. Since the problem possesses symmetry with respect to the load axis, only one octant (⅛) of the geometry is modelled.
As far as the boundary conditions are concerned, normal displacements are constrained along the symmetry planes, and x and y displacements are constrained along the axis of rotation. The top surface of the indenter is constrained in all directions.
As far as the material properties are concerned, the sharp indenter (diamond tip with E = 1141 GPa and Poisson's ratio, v = 0·07) is modelled as a fully elastic material. Assuming isotropy because of the three-dimensional randomly cross-linked PDMS network, E of PDMS is equal to 1·1 MPa as measured by tensile test18 and v = 0·5. The interaction between the indenter and the specimen is modelled as a contact pair with no friction (coefficient of friction μ = 0). A rigid to flexible contact model is utilised because E of the indenter is much higher than E of the specimen. Contact elements are placed on the surface of the nanoindenter tip and the surface of the PDMS. The frictionless contact area is modelled with two-node linear contact element. Contact element CONTACT 175 is applied to PDMS, and target element TARGET 169 is applied to the tip. In addition, concerning the contact model, which describes the contact between the indenter and the sample, there is no separation if sliding is allowed.
Displacement control technique is used in order that the displacement is applied to the upper portion of the indenter in the load direction and the load force is measured. The aim is to obtain load versus nanoindentation displacement response for PDMS. The Lagrange method is chosen in order to avoid penetration.
Results and discussion
Oliver–Pharr method
Based on the half-space elastic deformation theory, the H and E values can be extracted from the experimental data (load–displacement curves) using the O&P method,5 in which derived expressions for calculating the elastic modulus from indentation experiments are based on Sneddon's elastic contact theory6 (equation (2))


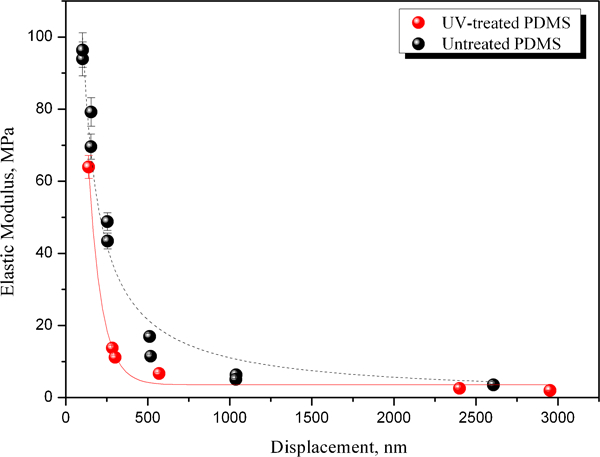
Comparison of elastic modulus for untreated and UV treated PDMS20
Linearly elastic solids
When the geometry of the indenting cone is considered, Sneddon assumed an infinitely sharp tip. Actually, the tip of the indenter has a finite tip radius of curvature. In the present study, the spherical part of the Berkovich indenter has an average radius of curvature of ∼120 nm. Poon et al.9 introduced a modification to Sneddon's equation for the elastic indentation, which depends on the elastic properties and the tip radius of the indenter (equation (6))
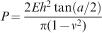
This equation is in accordance to the results of the nanoindentation experiment (Fig. 4), contrary to Sneddon's and FEM analysis. In fact, by fitting the load–displacement curves obtained from the nanoindentation experiment based on equation (6) (with 2% of accuracy), E and tip radius are predicted. The equation of the fitted load–displacement curve is calculated as
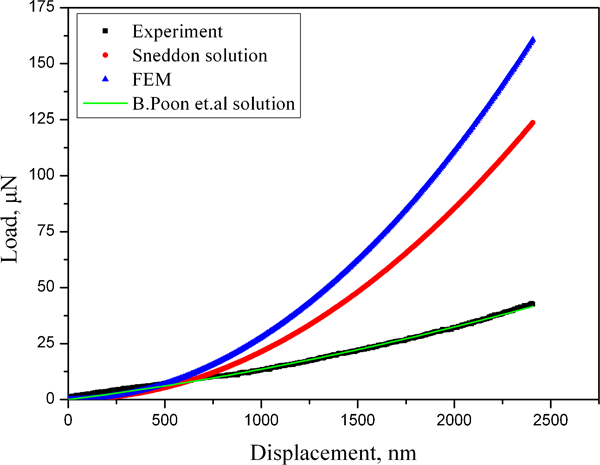
Nanoindentation load–displacement curve at ∼2500 nm maximum depth
The nanoindentation of PDMS is simulated with FEM analysis, and the load–displacement curve through this analysis is obtained and compared with the experimental one and the one based on Sneddon's relationship. The three curves are presented in Fig. 4 (experimental load displacement curve for applied load of 50 μN and displacement of 2500 nm). It is obvious that the curves based on Sneddon's and FEM analysis are not in good agreement with the experimental. Generally, equation (1) is valid when the dimensions of the contact area are small, compared with the dimensions of the indented material, and no length quantity is introduced from, for example, the constitutive equation.9 Sneddon's solution assumes that the indenter is perfectly sharp and rigid. Frictional effects are not included in either of these analyses. For displacements higher than ∼500 nm, the classical solution of nanoindentation deviates strongly from the experiment. These deviations are observed due to the fact that the indenter tip can never be perfectly sharp. Recently, Lim and Chaudhri9, 26, 27 found that equation (1) is accurate at cone indentation, but deviations between theory and experiments were found in case of Vickers (pyramid like Berkovich) indentation. This study confirms the deviation between theory and experiment for Berkovich nanoindentation. The FEM analysis results are higher due to large deformation effects. This phenomenon has also been reported by Kamran and Larsson8 and Xu and Li28 in similar experiments.
Creep mathematical approach
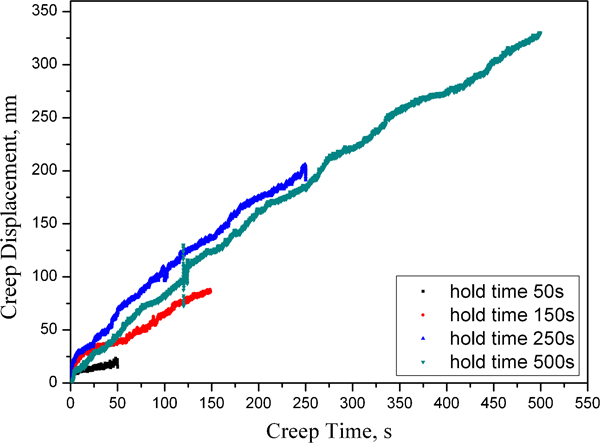
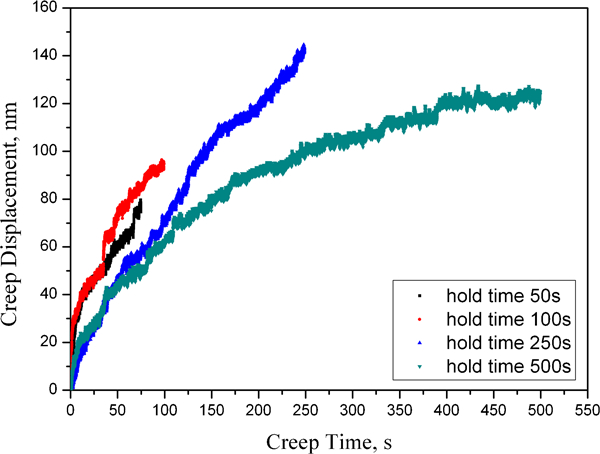
As the maximum load remains constant with time, the indenter continues to penetrate into PDMS. In Figs. 5 and 6, the penetration of the indenter tip into the sample surface (i.e. creep displacement) as the maximum load remains constant versus the holding time is presented for untreated and UV treated PDMS. The displacement axis was reset to show only the creep displacement, and time was reset to zero at the beginning of the hold period to facilitate comparison. The creep displacement increases at a decreasing rate and becomes almost linear as the holding time increases (an initial sharp rise in creep displacement in the early part of the creep segment, followed by a region showing a smaller rate of increase). The general profile of these curves is similar to the strain versus time plot obtained for the uniaxial tensile creep testing of bulk materials that exhibit power law creep behaviour.14 The primary creep, as it is obtained from creep curves (Figs. 5 and 6), is negligible for untreated PDMS, contrary to UV treated, which is dominant. The stress in the sample beneath the indenter tip at the primary creep is large; the power law creep deformation is small as compared to the viscoelastic displacement, because the power law creep needs time to build-up.14 Thus, the creep displacement of the UV treated PDMS is dominated by viscoelastic effects, contrary to untreated. Experimental results on PDMS can be found elsewhere.20 The elastic modulus of the UV treated PDMS is overestimated with the O&P method, contrary to untreated PDMS.20 This is due to viscoelastic effects, which are large in case of the nanoindentation creep of UV treated PDMS; the primary creep is dominant. Polymers are known to show large viscoelastic effects, which are likely to cause higher E values.29 In Fig. 7, creep curves for hold time of 500 s for untreated and UV treated PDMS are presented for comparison.
Comparison of creep curves under different hold times for untreated PDMS
Comparison of creep curves under different hold times for UV treated PDMS
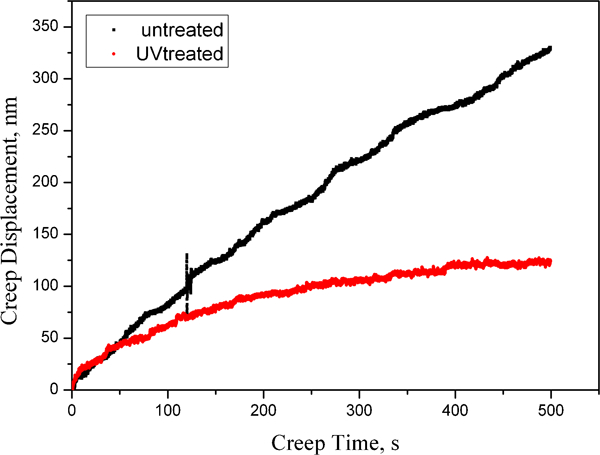
Comparison of creep curves for hold time of 500 s for untreated and UV treated PDMS
Furthermore, a different fitting analysis to nanoindentation creep curve is performed using the Maxwell two-element model (equation (9)). The obtained results are presented in Figs. 8 and 9 for untreated and UV treated PDMS, respectively, for 100 s hold time. This mechanical model is commonly used for soft materials in order to obtain information about the time dependent properties of the materials15

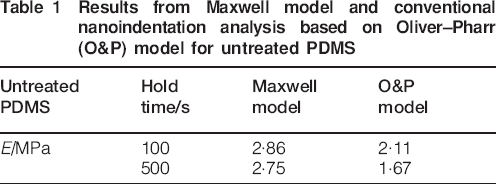
Results from Maxwell model and conventional nanoindentation analysis based on Oliver–Pharr (O&P) model for untreated PDMS
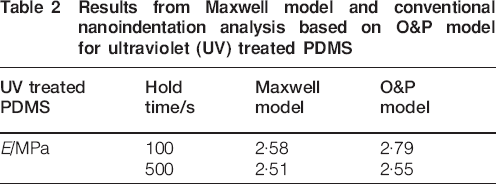
Results from Maxwell model and conventional nanoindentation analysis based on O&P model for ultraviolet (UV) treated PDMS
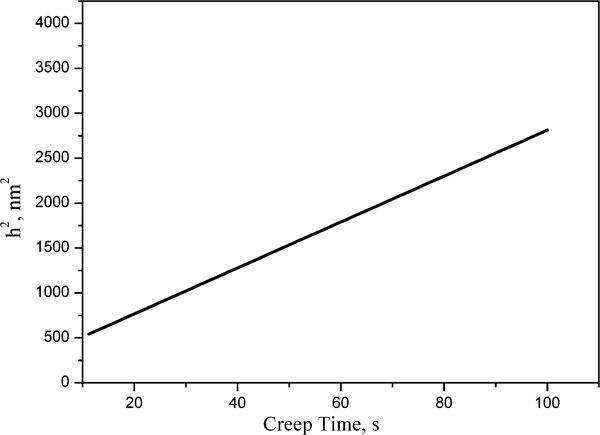
Nanoindentation creep data for untreated PDMS with Maxwell two-element model for 100 s hold time
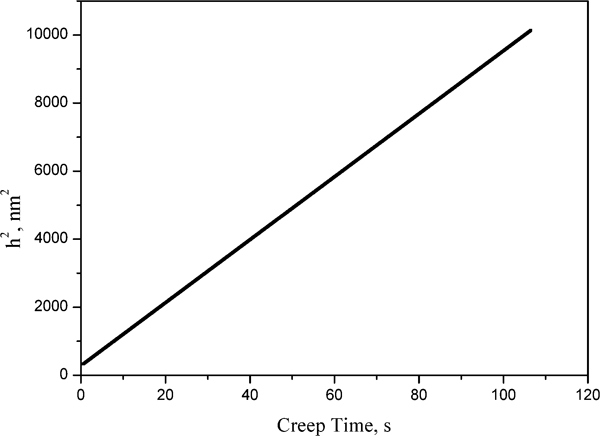
Nanoindentation creep data for UV treated PDMS with Maxwell two-element model for 100 s hold time
Conclusions
A FEM model was developed in order to investigate the applicability of classical Sneddon's analysis in the nanoindentation experimental data of PDMS. This model takes into account von Mises plasticity and Hookean elasticity. A modified model (by Poon et al.9) extracted by FEM analysis based on Sneddon's equation, which takes into account specimen finite dimensions and indenter curvature, was found to fit the nanoindentation experimental results very well, contrary to Sneddon's and FEM analysis. The E and tip radius are predicted with an accuracy of 2%. E was found in excellent agreement with the tensile test. To the authors’ best knowledge, no similar results have been reported in the literature. The creep displacement of UV treated PDMS was found to be dominated by viscoelastic effects, contrary to untreated PDMS. The primary creep was dominant in the nanoindentation creep of UV treated and negligible in the case of untreated PDMS. Thus, the E obtained by O&P method is overestimated for UV treated PDMS in comparison with the untreated sample. A simple and accessible method based on the Maxwell two-element model was used in order to obtain information about the time dependent properties of PDMS. This method was found to describe well the creep curves, minimising the fitting error in the secondary creep, as viscous flow strongly depends on it. Since the classical analysis of Berkovich nanoindentation has limited validity for linear elastic materials like PDMS, and due to viscoelastic effects, the load–displacement relationship and the nanoindentation viscoelastic models should be reconsidered by taking into account the Berkovich curvature of the tip and specimen finite dimensions.