
Abstract
The change of thermoelastic properties of cross-ply and quasi-isotropic laminates with intralaminar cracks in layers is analysed. Predictions are performed using previously derived general expressions for stiffness of symmetric damaged laminates as dependent on crack density and crack face opening and sliding. It is shown that the average crack opening displacement can be linked with the average value of axial stress perturbation between two cracks. Using this relationship, analytical shear lag and Hashin's models, developed for axial modulus, can be applied for calculating thermal expansion coefficients, in-plane moduli and Poisson's ratios of damaged laminates. The approach is evaluated using finite element method and it is shown that the accuracy is rather similar to that in axial modulus calculation.
Keywords
Introduction
Composite laminates under service loading undergo complex combinations of thermal and mechanical loading, leading to microdamage accumulation in layers. The most common damage mode is intralaminar cracking in layers. During service life, the number of these cracks, which are transverse to the midplane, increases, reducing laminate thermoelastic properties.
The stiffness degradation of composite laminates due to cracking can be explained in terms of opening and sliding of crack surface. The crack face relative displacement during loading reduces the average stress in the damaged layer, thus reducing the laminate stiffness.
Numerous analytical models have been developed to study the stiffness degradation due to transverse cracks. They are all based on approximate solution for the stress state between two cracks (repeating element). Reference is given only to papers with direct relevance to the current study.1–16
The simplest type of models leading to linear second order differential equation with constant coefficients is called shear lag models.1–4 General for all shear lag models is that the equilibrium conditions are satisfied in average only and the shear stress free condition on crack surfaces is not satisfied. A ‘shear lag’ parameter which is often a fitting parameter is needed in these models. The stress distribution and the stiffness degradation calculated according to these models in Refs. 6 and 7 are affected by the value of this parameter. The most typical modifications and values of the shear lag parameter compared in Refs. 5–7 are:
assuming a resin rich layer of unknown thickness between layers of different orientation where the out of plane shear deformation at the crack tip takes place. In this paper, it is assumed that this layer cannot be thicker than fibre diameter
assuming that the shear strain acts in the cracked layer only and it is due to linear or parabolic crack opening displacement (COD) dependence on the thickness coordinate
assuming shear strain also in the constraint layer.
The last model was refined by Zhang et al., 8 assuming that the intralaminar shear stress in 0-layer is present only in a part of the constraint layer. Unfortunately, unless experimental full field measurements or finite element method (FEM) are used, the thickness of this zone becomes a fitting parameter.
The first model based on the principle of minimum complementary energy which was free of these assumptions was developed by Hashin9 to investigate the axial modulus reduction of cross-ply laminate with cracks in inside 90-layers. The approximate stress field derived with this approach satisfies all the necessary equilibrium as well as the boundary conditions including zero tractions on the crack surfaces. Since the approximate nature of the selected stress functions leads to an increase in the value of the complementary energy, it does not reach the minimum corresponding to the exact solution and the displacement continuity is satisfied only approximately. Hashin's model is relatively simple to use and it renders lower bond for the axial modulus of the damaged laminate. Refined variational models based on minimum principle of the complementary energy with more accurate predictions of axial modulus and Poisson's ratio were developed in Refs. 10 and 11. However, higher accuracy of analytical solutions is always on the expense of significant increase in complexity. For example, use of the model in Ref. 11 requires rather complex numerical minimisation routine. Therefore, the model in Ref. 11 as well as models by McCartney12 and Shoeppner and Pagano13 could rather be considered as numerical routines.
Two main problems/limitations related to the use of analytical solutions are:
approximate analytical solutions are available for cross-ply laminates only
these models are developed to calculate only one or two of the whole set of laminate thermoelastic constants (usually axial or shear modulus of the damaged laminate).
In practice, a cross-ply laminate lay-up is rarely used. This limitation has been handled by several authors.14–16 Zhang et al.8 introduced the concept of ‘an equivalent constraint’, assuming that the constraint on the damaged layer of the lay-ups above and below the damaged lamina can be replaced by two sublaminates with properties calculated using laminate theory (CLT). Thereby, the actual laminate, considered in the coordinate system related to the damaged layer symmetry, could be replaced by a cross-ply with orthotropic constraint layers. Similar approach was used by Lundmark and Varna15, 16 applying FEM to analyse the effect of surrounding layers. They demonstrated that the modulus and the thickness ratio of the closest neighbour to the damaged layer are the parameters governing the constraint.
In Ref. 15, a unique relationship between the damaged laminate thermoelastic properties and the microdamage parameters was established (GLOB-LOC approach). Exact analytical expressions for thermoelastic constants of general symmetric laminates with cracks in multiple layers were presented. These matrix expressions are given in the section on ‘Material model of damaged symmetric laminates with intralaminar cracks’. It was shown that the local parameters in these expressions are the normalised average values of COD and crack sliding displacement (CSD). In addition, the laminate lay-up, layer properties and density of cracks in layers have to be given. In this paper, we demonstrate how to use this framework and the axial stress distributions obtained from shear lag or from Hashin's model to calculate all thermoelastic constants of a damaged laminate (except shear modulus). The key point in the procedure is that the average COD can be related to the average stress in a layer between two cracks (see the section on ‘Average COD relation to stress perturbation’).
The accuracy of predictions is evaluated by comparing with direct FEM calculations.
Material model of damaged symmetric laminates with intralaminar cracks
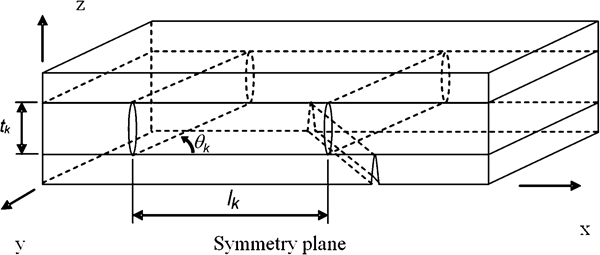
Model formulation
The upper part of symmetric N-layer laminate is shown in Fig. 1. The kth layer of the laminate is characterised by thickness tk, fibre orientation angle with respect to the global x axis θk and by stiffness matrix in the local axes [ . The crack density in a layer is ρk = 1/(2lksin θk), where the average distance between cracks measured on the specimen edge is 2lk. Dimensionless crack density ρkn is introduced as

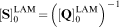
 . The compliance matrix of the undamaged laminate is
 and
and
 is the thermal expansion coefficient vector. Constants of the undamaged laminate are calculated using CLT.
Representative volume element of damaged laminate with intralaminar cracks in layers
The expressions for compliance matrix and thermal expansion vector of the damaged laminate presented below are exact
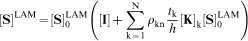
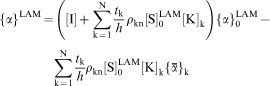
 is the vector of thermal expansion coefficients of the kth layer in global coordinates. The [
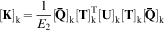
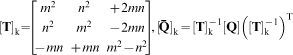
 are defined according to CLT, where superscript T denotes transposed matrix and bar over stiffness matrix indicates that it is written in global coordinates. For a layer with fibre orientation angle θk, m = cos θk and n = sin θk

Thermoelastic constants of balanced laminates with cracks in 90-layers
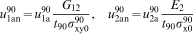
For balanced laminates with cracked 90-layer, [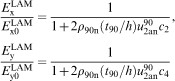
if Poisson's effects are neglected, c3 = c4 = 0. In this approximation,
 and
and
 do not change because of damage in 90-ply
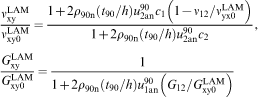
shear modulus is not related to COD and depends on CSD only. It is not analysed in the present paper.
The class of laminates covered by these expressions is broader than just cross-ply laminates or laminates with 90-layers. For example, any quasi-isotropic laminate with an arbitrary cracked layer can be rotated to have the damaged layer as a 90-layer. The only limitation of equations (7)–(12) is that the laminate after rotation is balanced with zero coupling terms in
 .
.
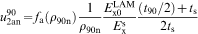
Application of equations (7)–(12) requires values of u2an and u1an. Three different expressions of u2an are presented in the section on ‘Determination of COD’ according to FEM, shear lag and Hashin's models.
Determination of COD
Crack face displacements
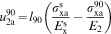
It is assumed that all cracks in the same layer are equal and equidistant. The average CSD and COD are defined as
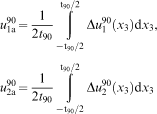
In linear model, the average displacements
 and
and
 are linear functions of the applied stress and the ply thickness. Therefore, they are normalised with respect to the far field (CLT) shear stress
 and transverse stress
 in the layer (resulting from the macroload
 and temperature difference ΔT) and with respect to the thickness of the cracked layer t90
 and
and
 .
.
Average COD relation to stress perturbation
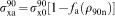
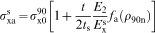
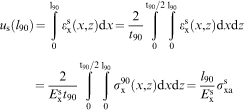
Part of the deformed laminate with an open crack is shown in Fig. 2. Thickness of the supporting sublaminate is ts and its effective modulus in the axial direction is
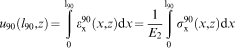
 . Denoting the displacement of the undamaged sublaminate at x = l90 (l90 is the half distance between cracks) by us(l0) and the displacement of the crack face by u90(l0, z), we can write that the average COD is
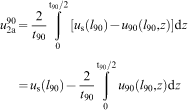
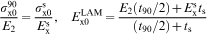
 is the axial stress in the undamaged 90-layer (CLT). The average value of the stress between two cracks is defined as
 and fa.
Schematic showing deformation of laminate in vicinity of transverse crack
Neglecting Poisson's effects, the u90(l0, z) can be written as
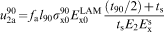
Shear lag model
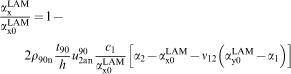
The stress perturbation function for shear lag models is given in Ref. 5. Using equation (40) from Ref. 5 in equation (25), we obtain (note that fa = (ρ90n/2)R is used in Ref. 5)
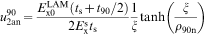
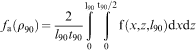
Hashin's model
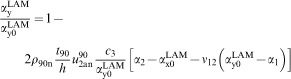
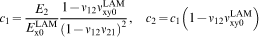
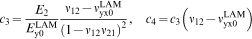
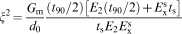
Expressions for Hashin's model for the case when 90-layer is supported by orthotropic sublaminate are given in Ref. 5. Expression for stress perturbation function is also given there. After substituting these expressions in equation (25) and using our notation, we obtain
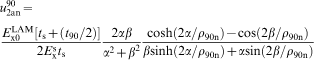
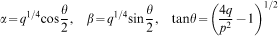
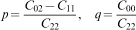
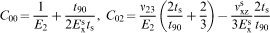
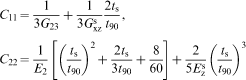
 ,
,
 ,
,
 ,
,
 and ts is equal to the thickness of 0-layer.
For ‘non-cross-ply laminate’, GF/EP2 [±15/904]s laminate (in the section on ‘Comparison between simulations and experimental data’) and GF/EP [0/±45/90]s laminate (in the section on ‘Comparison between analytical simulations and FEM data’),
 is calculated using CLT, and ts is the thickness of the sublaminate.
 ,
,
 and
and
 in this case are calculated using FEM.
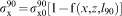
Ply discount model
In the ply discount model, it is assumed that as soon as damage appears in a layer, its load bearing capacity reduces to zero. This assumption corresponds to infinite number of cracks in the layer. Zero load bearing by the layer can be obtained by changing elastic properties of the layer to zero. In the most conservative form of this model, all elastic constants are assumed zero. More representative for the case of transverse cracking is the assumption used in this paper, stating that the transverse and the shear moduli of the damaged layer are close to zero, whereas the longitudinal modulus and Poisson's ratio have not changed. The stiffness of the damaged laminate is calculated using CLT.
The transverse elastic modulus E2 and shear modulus G12 were reduced to 0·01 of their initial values. In the section on ‘Ply discount model and asymptotic behaviour of stiffness reduction’, where the ply discount model is used for case with neglected Poisson's effects, the CLT analysis is reduced to the rule of mixtures.
Results and discussion
Material properties
The elastic properties of the unidirectional composites relevant to this study are given in Table 1. Elastic properties of GF/EP and CF/EP used in simulations were arbitrary assumed to represent materials like glass fibre/epoxy and carbon fibre/epoxy respectively.
Ply properties of studied materials
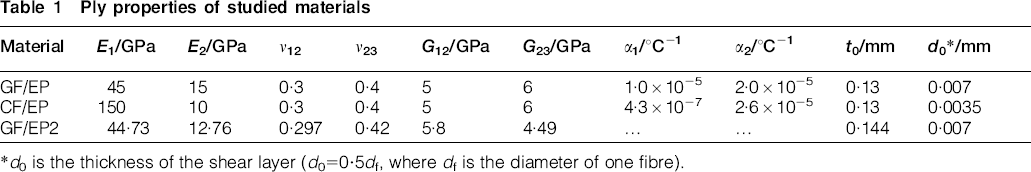
*d0 is the thickness of the shear layer (d0 = 0·5df, where df is the diameter of one fibre).
Elastic properties of GF/EP2 were taken from Ref. 5, where the properties (except the out of plane Poisson's ratio ν23, which was assumed) were obtained experimentally.
It has to be noted that the GF/EP and CF/EP in Table 1 do not have isotropy in the transverse plane and the out of plane shear modulus is slightly different than it would be for transverse isotropic material. Reason for the increased anisotropy could be through the thickness stitching observable in many composites. However, shear lag model does not contain G23 and Hashin's model, which has it in G11 is insensitive to it.
Parametric analysis on cross-ply laminates
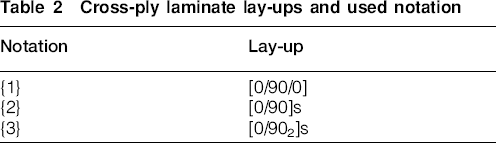
In all figures below, the notation ‘shear lag’ is used to indicate results calculated using COD obtained from shear lag stress analysis (equation (26)) in equations (7)–(12). The thickness of the shear layer is given in Table 1 or indicated in figures if selected differently. The notation ‘Hashin’ is used for predictions where the stress perturbation function from Hashin's model (generalised for orthotropic support layers/sublaminates) (equation (28)) is used. The notation used for considered cross-ply lay-ups is shown in Table 2.
Cross-ply laminate lay-ups and used notation
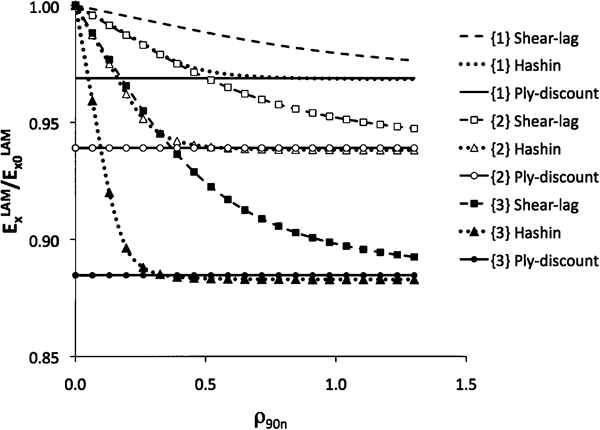
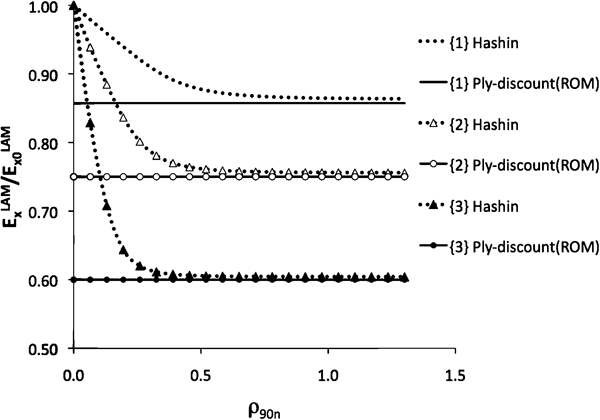
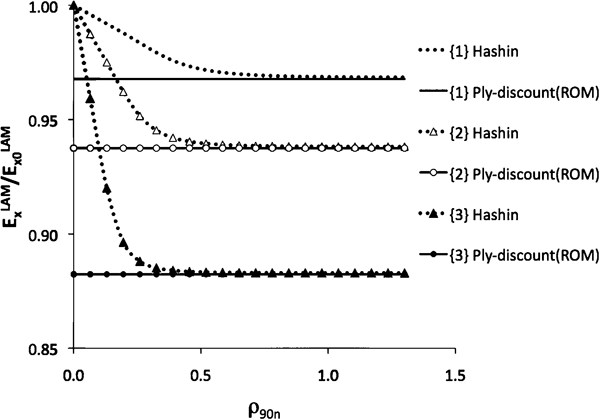
In Figs. 3 and 4, the axial modulus reduction normalised with respect to its initial value is shown for all three lay-ups and for GF/EP and CF/EP composites. Predictions of the ply discount model are shown as horizontal lines. The modulus reduction behaviour is well known and described in literature:
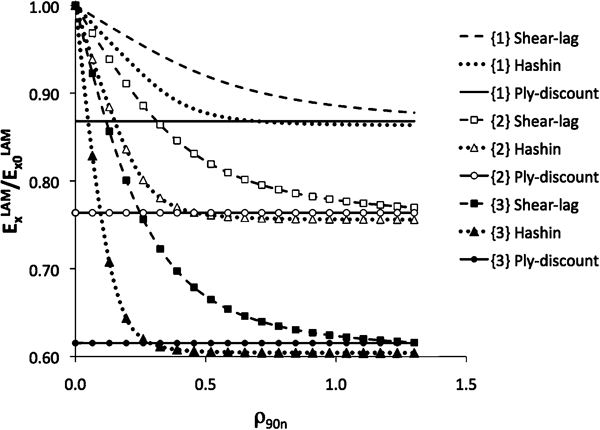
Simulation results showing changes in axial modulus of laminate ExLAM for GF/EP
Simulation results showing changes in axial modulus of laminate ExLAM for CF/EP
more modulus reduction in laminates with relatively thick cracked plies
much more modulus reduction in GF/EP composites because the damaged layer has relatively high modulus as compared with the longitudinal modulus
more modulus reduction according to Hashin's model which as a consequence of the used minimum principle always gives conservative results.
The rate of the modulus reduction according to the shear lag model depends on the shear lag parameter (related to the thickness of the resin layer d0). The values given in Table 1 lead to much slower decrease rate than in Hashin's model. All simulated curves approach to the ply discount value. Surprisingly, the asymptotic values of both models go slightly below the ply discount value. Since ply discount model corresponds to an infinite number of cracks, this trend needs an explanation which is given in the section on ‘Ply discount model and asymptotic behaviour of stiffness reduction’.
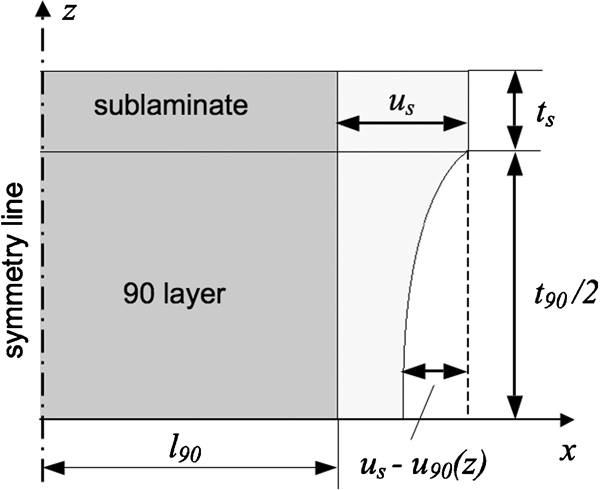
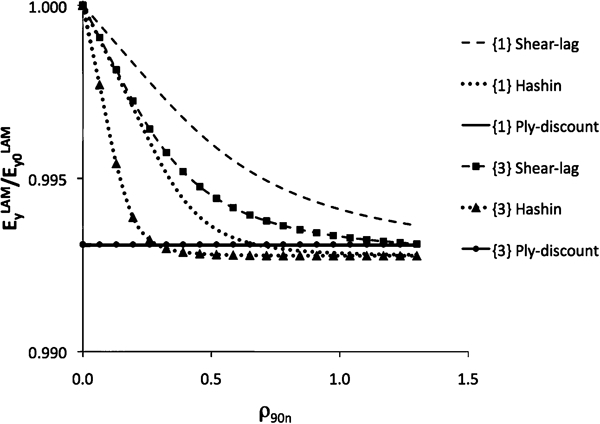
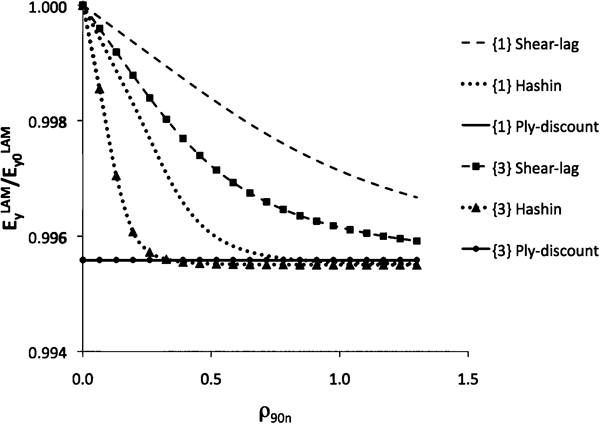
The normalised transverse modulus
 of the damaged laminate reduction is marginal (see Figs. 5 and 6), which validates the usual assumption that due to cracks in 90-layer, it is not changing at all. Also for this elastic property, the Hashin's model predicts faster reduction with increasing crack density than the shear lag model. The change is very similar for GF/EP and CF/EP and the asymptotic values are very insensitive to the damaged ply thickness.
Simulation results showing changes in transverse modulus of laminate EyLAM for GF/EP
Simulation results showing changes in transverse modulus of laminate EyLAM for CF/EP
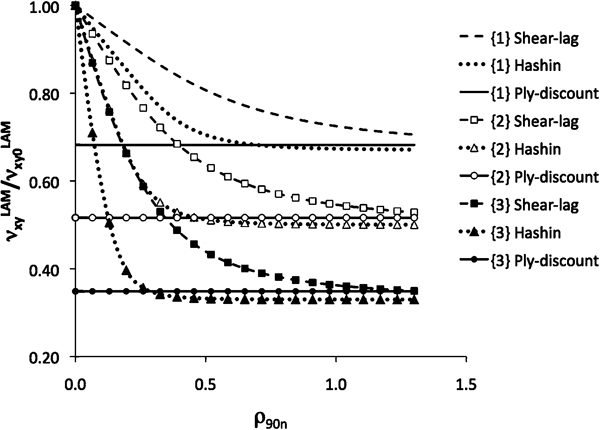
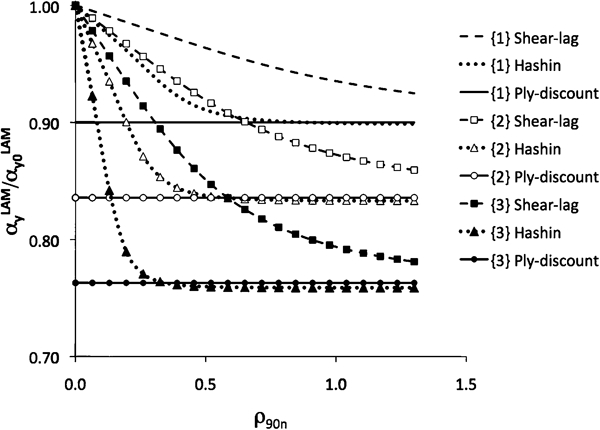
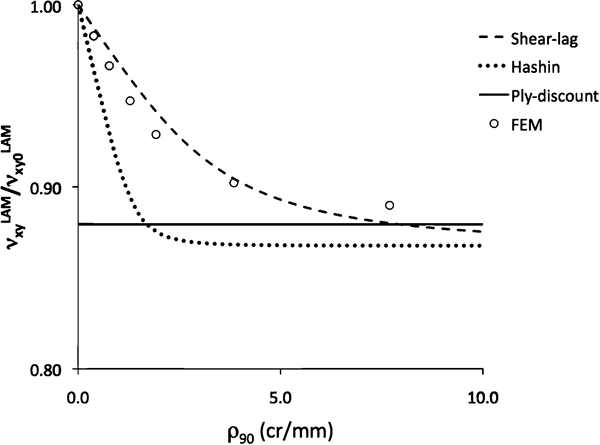
Similar results for the normalised Poisson's ratio are given in Figs. 7 and 8. For this property, the asymptotic value does not depend on the used material but the rate of approaching to these values is material dependent, especially according to the shear lag model. The asymptotic value for damaged cross-ply laminate depends only on ply thickness ratio.
Simulation results showing changes in Poisson's ratio of laminate vxyLAM for GF/EP
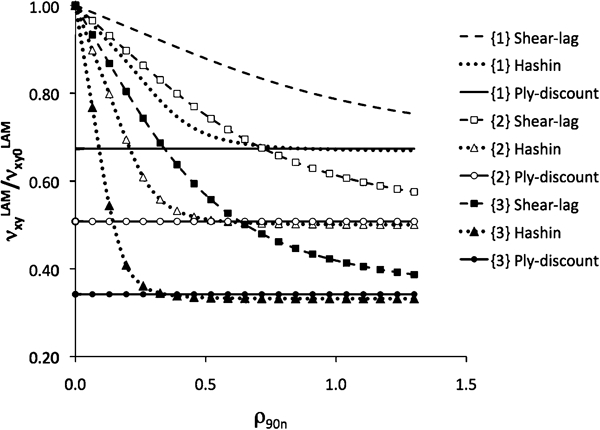
Simulation results showing changes in Poisson's ratio of laminate vxyLAM for CF/EP
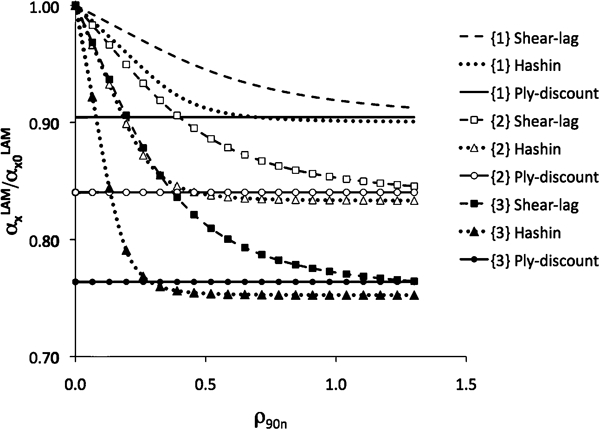
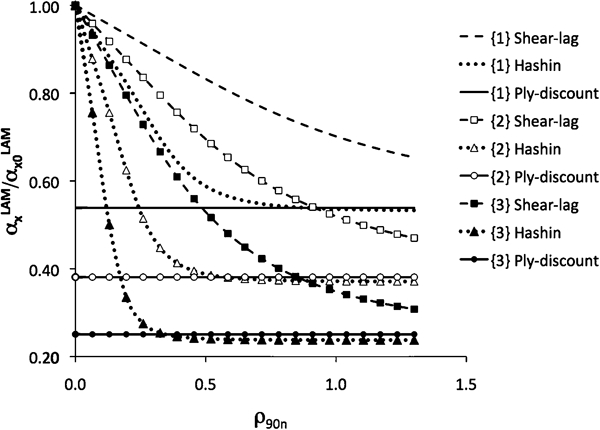
The change of thermal expansion coefficients, which is seldom discussed in analytical models, is shown in Figs. 9 and 10 for
 and in Figs. 11 and 12 for
 . The relative change is much larger for CF/EP laminates but the absolute values are, certainly, much smaller. The trend is the same: Hashin's model predicts much faster properties reduction. It is noteworthy that for CF/EP laminate, the transverse thermal expansion coefficient change is >20% (for lay-up with thickest 90-layer).
Simulation results showing change in axial coefficient of thermal expansion of laminate αxLAM for GF/EP
Simulation results showing change in axial coefficient of thermal expansion of laminate αxLAM for CF/EP
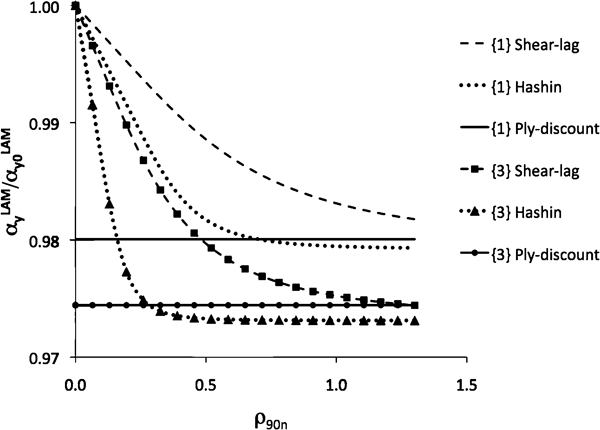
Simulation results showing change in transverse coefficient of thermal expansion of laminate αyLAM for GF/EP
Simulation results showing change in transverse coefficient of thermal expansion of laminate αyLAM for CF/EP
Comparison between simulations and experimental data
The shear lag model and the Hashin's model predictions are compared with experimental data in Figs. 13–16. It is obvious that for both GF/EP2 laminate lay-ups ([02/904]s and [±15/904]s), Hashin's model describes the axial modulus and Poisson's ratio reduction more accurate than the shear lag model. Still, the Hashin's model gives conservative values, especially for the [±15/904]s lay-up. The shear lag model by far underpredicts the reduction in these constants.
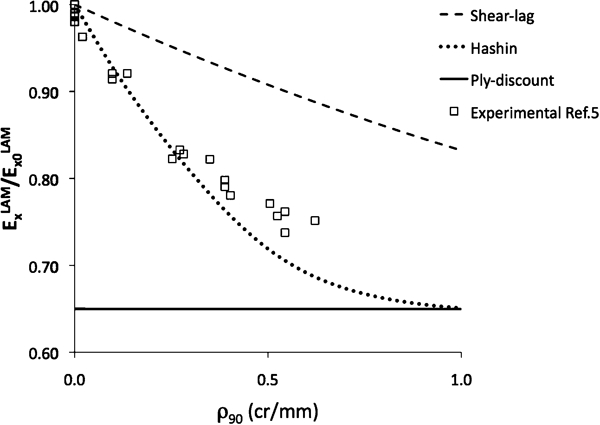
Simulations and experimental data showing change in axial modulus ExLAM of GF/EP2 [02/904]s laminate
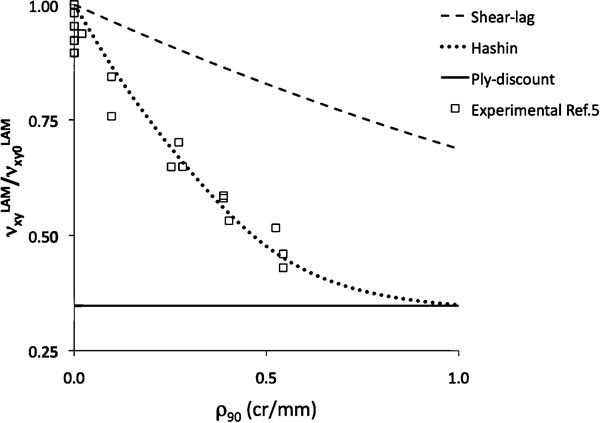
Simulations and experimental data showing change in Poisson's ratio vxyLAMof GF/EP2 [02/904]s laminate
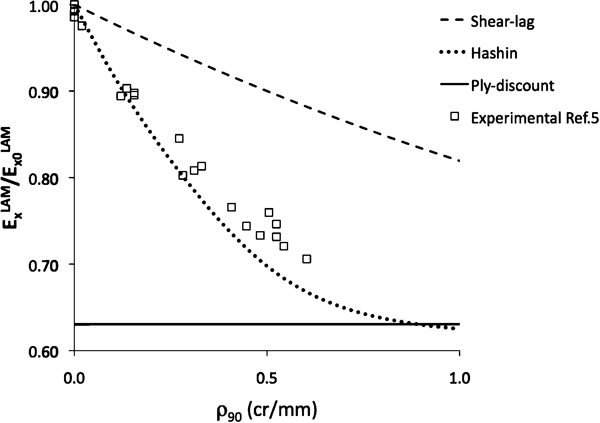
Simulations and experimental data showing change in axial modulus ExLAM of GF/EP2 [±15/904]s laminate
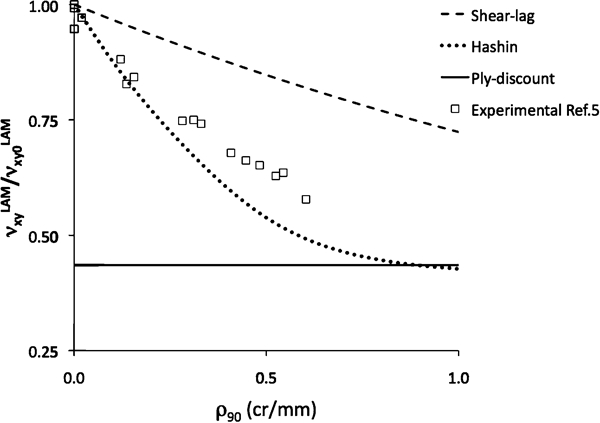
Simulations and experimental data showing change in Poisson's ratio vxyLAM of GF/EP2 [±15/904]s laminate
The excellent agreement between the test results and the predictions of the Hashin's model, which suppose to give a lower bond to stiffness, requires an explanation. The thickness of 90-layer was rather large (1·15 mm) and much thicker than the constraint layer. Laminates with such geometry are prone to local delaminations starting from transverse crack tip. These local delaminations would increase the crack opening and lead to more modulus reduction than in the case without delaminations and improve the agreement with Hashin's model. The FEM results for this laminate presented in Ref. 5 are higher than experimental data, indicating that in this case indeed the crack model without delaminations may not correspond to reality.
Comparison between analytical simulations and FEM data
To validate the results and trends presented in the section on ‘Parametric analysis on cross-ply laminates’, FEM analysis was performed and the thermoelastic properties of damaged laminates were analysed directly from the FEM model or indirectly (e.g. thermal expansion coefficients), determining COD with FEM and using equations (7)–(12). Results are presented in Figs. 17– Figure 23 24.
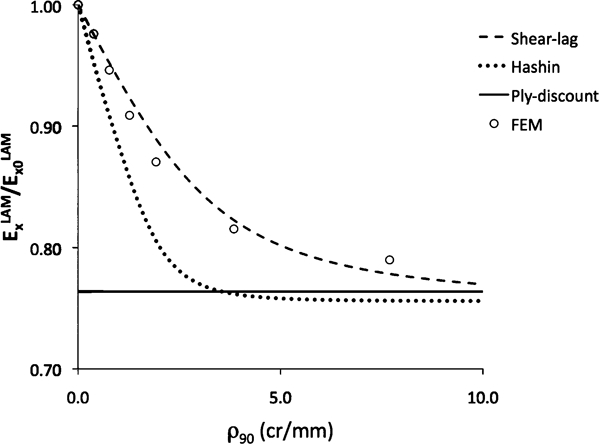
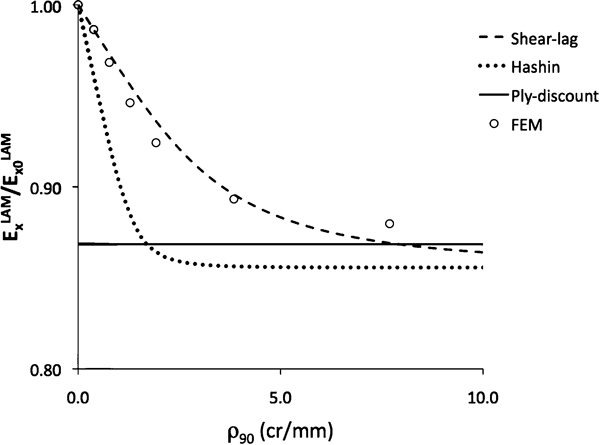
Simulations and FEM data showing change in axial modulus ExLAM of GF/EP [0/90]s laminate
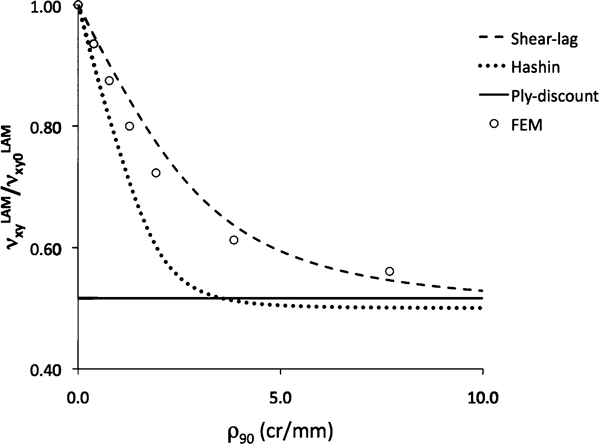
Simulations and FEM data showing change in Poisson's ratio vxyLAM of GF/EP [0/90]s laminate
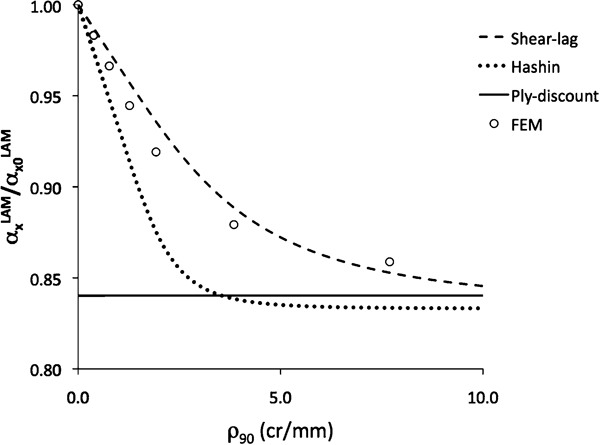
Simulations and FEM data showing change in axial coefficient of thermal expansion αxLAM of GF/EP [0/90]s laminate
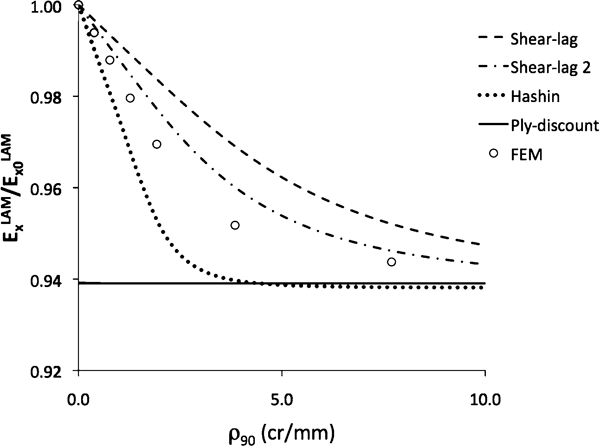
Simulations and FEM data showing change in axial modulus ExLAM of CF/EP [0/90]s laminate: ‘shear lag’ corresponds to d0 = 0·0035 mm, and ‘shear lag 2’ to d0 = 0·007 mm
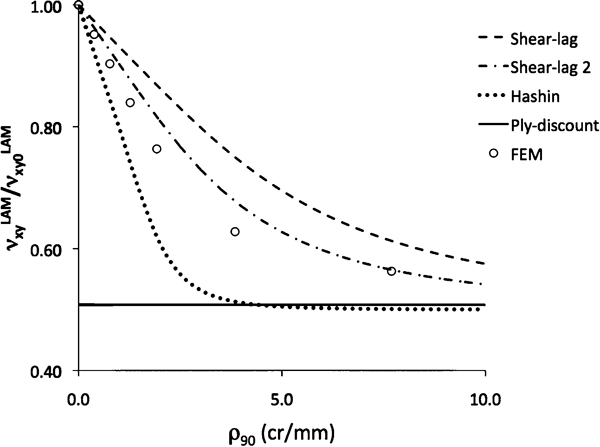
Simulations and FEM data showing change in Poisson's ratio vxyLAM for CF/EP [0/90]s laminate: ‘shear lag’ corresponds to d0 = 0·0035 mm, and ‘shear lag 2’ to d0 = 0·007 mm
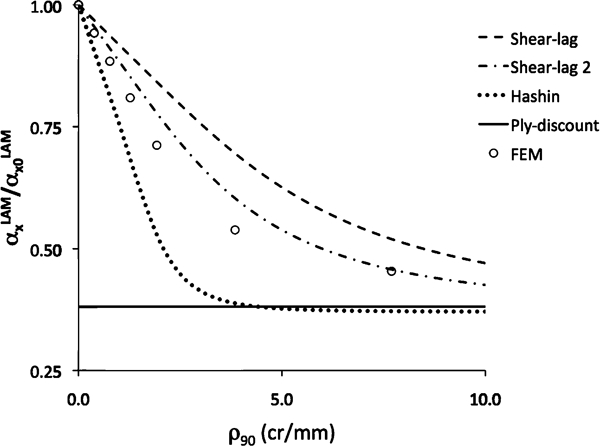
Simulations and FEM data showing change in longitudinal coefficient of thermal expansion αxLAM of CF/EP [0/90]s laminate: ‘shear lag’ corresponds to d0 = 0·0035 mm, and ‘shear lag 2’ to d0 = 0·007 mm
Simulations and FEM data showing change in longitudinal modulus ExLAM of GF/EP [0/±45/90]s laminate
Simulations and FEM data showing change in Poisson's ratio vxyLAM of GF/EP [0/±45/90]s laminate
Comparison for GF/EP [0/90]s laminates can be based on data presented in Figs. 17–19. The shear lag model with the selected resin layer thickness of 0·007 mm gives excellent accuracy for axial modulus and for thermal expansion coefficient and slightly larger differences for Poisson's ratio. Noteworthy, the differences have the same trends with crack density change for all three properties. Hashin's model largely overestimates changes of all three properties.
In CF/EP [0/90]s laminate (see Figs. 20–22), the situation is different: the shear lag model with d0 = 0·0035 mm (half of the carbon fibre diameter) gives very poor prediction. Voluntarily taking it two times larger (equal to the value for glass fibre radius) improves the agreement but it still underestimates the properties reduction.
The lower bond from Hashin's model is much lower than the FEM data. Figures 20–22 reveal the features of the shear lag model: using the resin layer thickness as a fitting parameter, we could find a value which gives a very good fitting for all three considered properties. This is useful result suggesting approximate procedure: find this fitting parameter from FEM data for axial modulus and use it for all thermoelastic properties.
Unfortunately, the value, which gives the best fit, will be different for different materials and lay-ups. In addition, this value of resin layer thickness in our case has no physical meaning because it is too large (more than one fibre diameter).
Application of the suggested calculation approach to quasi-isotropic laminates is demonstrated in Figs. 23 and 24. The material is GF/EP and the 90-layer thickness is the same as for cross-ply laminates analysed in Figs. 17–19. The agreement of the shear lag model with FEM results is as good as in the case of cross-ply laminates (using the same resin layer thickness). The Hashin's model even in this case strongly overestimates the rate of the reduction.
Ply discount model and asymptotic behaviour of stiffness reduction
In this section, we will address the observation from all presented figures that both models predict asymptotic values of thermoelastic properties that are slightly lower than the ply discount value calculated using CLT. It seems to be theoretically impossible. Nevertheless, it is possible because in both analytical models, the stress analysis is two-dimensional, neglecting Poisson's interactions in layers and stress components in the specimen width direction. The ply discount model used was based on the use of CLT which accounts for these interactions. In other words, the comparison of asymptotic values in the way that we did is inconsistent. The ply discount model used to compare asymptotic values should be based on the same assumptions as the stress analysis. In this particular case instead of CLT, we should use rule of mixtures, for example, to calculate degraded laminate axial modulus with ply discount.
The results presented in Figs. 25 and 26 show that the asymptotic values coincide with the ply discount values based on rule of mixture analysis (instead of CLT).
Simulation results showing change in axial modulus of laminate ExLAM for GF/EP
Simulation results showing change in axial modulus of laminate EXLAM for CF/EP
This result explains the observed discrepancies but it does not mean that the rule of mixtures based ply discount value is more accurate than the CLT based.
Conclusions
Methodology has been developed for approximate evaluation of all thermoelastic constants of general symmetric laminates with cracked 90-layers. It is based on the use of stress solutions from shear lag and Hashin's models in a general framework where laminate macroscopic properties are expressed through average stress perturbation between two cracks. This methodology has been validated with FEM and experimental data.
As expected, all predicted curves approach to the ply discount model predictions which assume almost zero transverse and shear properties of the damaged layer.
The predictions of the Hashin's model are always conservative but may be close to experimental data if the layer is relatively thick and local delaminations occur.
Comparing the shear lag model with FEM, the accuracy of axial modulus determination is the same as the accuracy of thermal expansion coefficients. The shape function of the elastic property reduction from shear lag model can give a good agreement to FEM results if the shear lag parameter (thickness of the resin layer in our case) is used as a fitting parameter. For given material and lay-up, all properties can be fitted with the same value of the parameter. It applies even for quasi-isotropic laminates if the ply thickness is the same.
Footnotes
This paper is part of a special issue on 22nd Annual International SICOMP Conference