
Abstract
We present fatigue experiments performed on filled natural rubber and study the correlations between crack growth dynamics and fracture morphologies imprinted by an irregular crack path. Slow crack growth dynamics is obtained by cyclic fatigue in a pure shear test. We will show that an unstable crack growth regime exists for high loads. We will also discuss the appearance of sawtooth striations which follow a scenario that significantly differs from previous results reported in the literature.
Introduction
Although there is a good knowledge of factors that can affect the fatigue life of rubbers,1–5 crack propagation in filled rubbers is still not well understood. 6 In filled elastomers, rupture dynamics is a much more complex process than in pure elastomers due to the intrinsic heterogeneous mixture of a rubber matrix with filler particles at submicronic scale. In the case of natural rubber, an additional source of heterogeneity affecting fatigue life and damage type is the strain crystallisation effect.7, 8 How rupture dynamics and crack path are affected by filler particles and strain crystallisation is still a matter of debate. Actually, understanding how rupture dynamics and crack path are correlated to each other is probably an important key in order to improve long time resistance of reinforced rubbers.
We present fatigue experiments performed on filled natural rubber and study the correlations between crack growth dynamics and fracture morphologies imprinted by an irregular crack path. Slow crack growth dynamics is obtained by cyclic fatigue. In order to control properly the crack growth dynamics, we use a pure shear test. The goal of this study is also to understand how rupture dynamics and morphologies depend on the control parameters of a fatigue experiment (frequency, stress or strain, strain rate, temperature). We will discuss in particular the appearance of sawtooth striations and will show that their formation follows a scenario that significantly differs from previous results reported in the literature.
Experimental protocol
The material considered is a 50 phr silica filled natural rubber. The material is moulded into a pure shear test piece of height h = 20 mm, length L = 220 mm and thickness e = 1·4 mm (Fig. 1). An initial crack of length ℓi = 30 mm is precut with a razor blade at one end of the sample. In mode I loading, fracture mechanics predicts that the elastic energy release rate is independent of the crack length at constant applied strain. In this case, crack growth is expected to occur at constant velocity. Uniaxial fatigue tests are performed using an Instron 8800 servohydraulic test machine. Fatigue cycles are applied using a trimodal control with the applied force returning to zero at the minimum position of the cycle and a constant applied displacement amplitude ue with respect to this minimum position (Fig. 2). In that way, we take into account plastic creep elongation up and avoid any compression of the sample at later stages. In contrast with a standard fatigue loading procedure where the minimum and maximum displacement are fixed, the trimodal control allows us to obtain a rather stable elastic strain ue/h during the entire experiment while the total displacement uT = ue+up applied to the sample increases progressively. 3
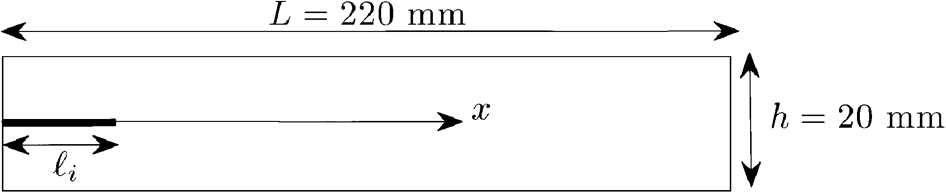
Sketch of pure shear sample geometry
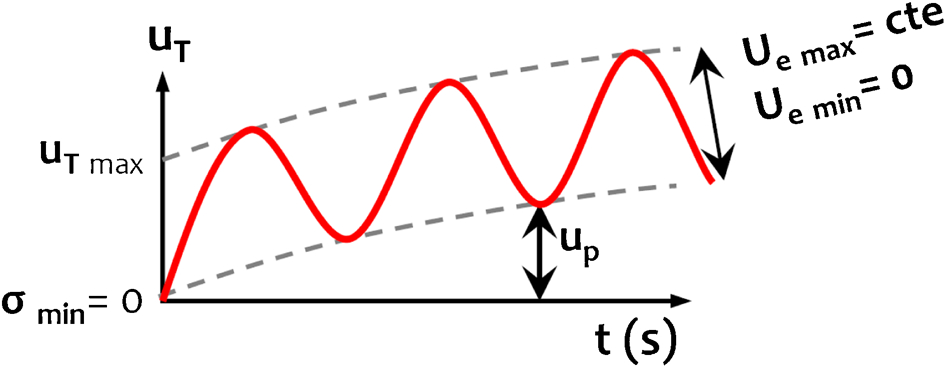
Sketch of trimodal fatigue procedure: total displacement uT increases progressively as plastic elongation up occurs so as to keep constant applied displacement ue
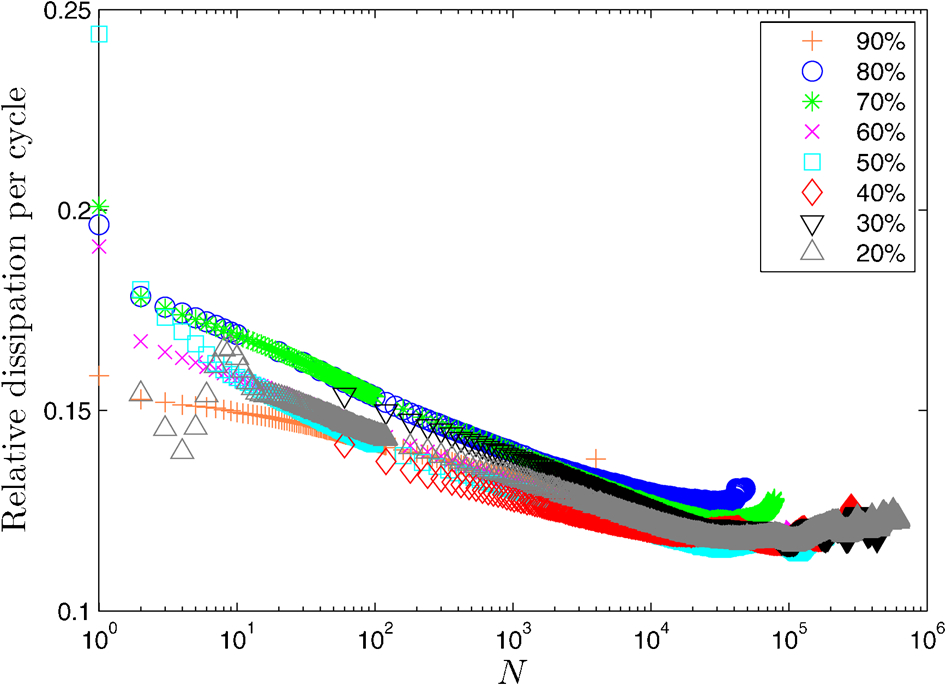
Relative dissipation per cycle is decreasing as function of cycle number N
Video tracking of the crack growth is done with an Imperx 4872×3248 pixel camera allowing a spatial resolution about 50 μm. Image acquisition is phaselocked to the fatigue cycles. Image analysis allows us to extract the crack tip position and measure the instantaneous crack velocity. In this paper, only the component of the velocity along the x axis will be considered. Scanning electron microscopy (SEM) fractography measurements have been used to characterise postmortem the crack path at spatial resolutions of 1 or 2 μm.
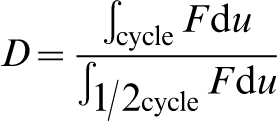
Relative dissipation
The relative dissipation per fatigue cycle D is computed from the force F versus displacement u relation during a fatigue cycle as
Crack growth dynamics
Here, we present results obtained at room temperature for fatigue cycles at a frequency of 1 Hz. In Fig. 4, we plot as a function of the crack tip x coordinate the instantaneous crack velocity (actually its x component). In contrast with the expected behaviour, the crack velocity is not always stationary. At large strains, it fluctuates a lot between two main distinct velocity levels. This multistable behaviour is reminiscent of the well known intermittent crack growth behaviour observed in the trouser test geometry for SBR samples for a given range of mean velocity. 10 When decreasing the maximum applied strain, we observe that the multistable crack growth regime eventually disappears, although relative fluctuations in velocity of about 20% are still observed.
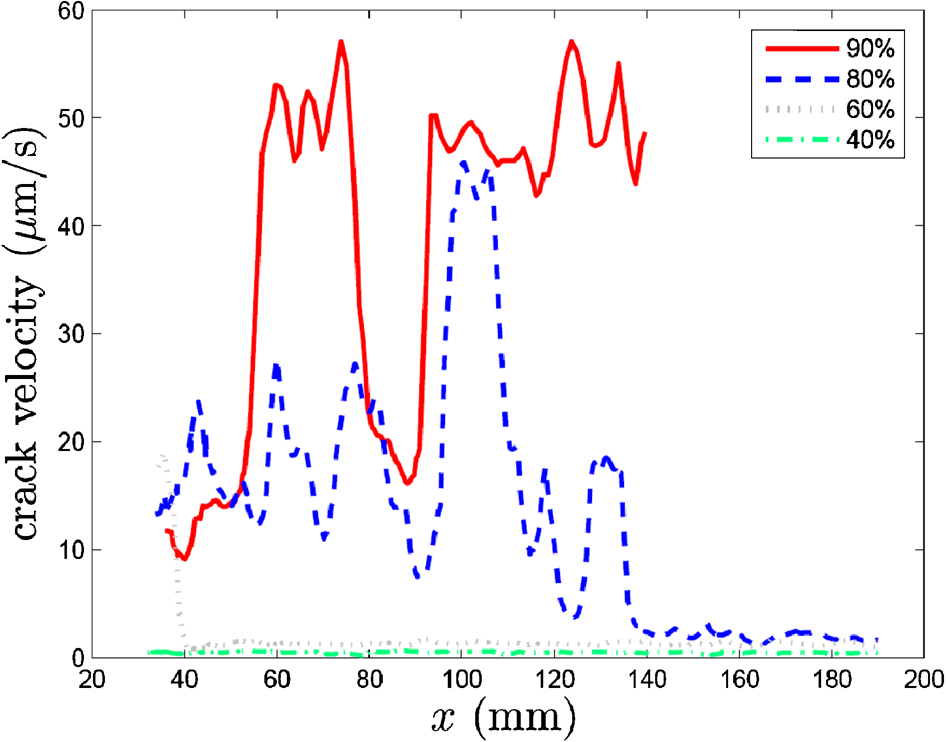
Instantaneous crack velocity as function of crack tip position along x axis: crack growth at high applied strain is unstable (amplitude of fluctuations 100%) and rather stable at low strain (amplitude of fluctuations 20%)
Fracture morphology
Fracture morphologies observed by SEM depend on the crack velocity and can be split into four main types (Fig. 5):
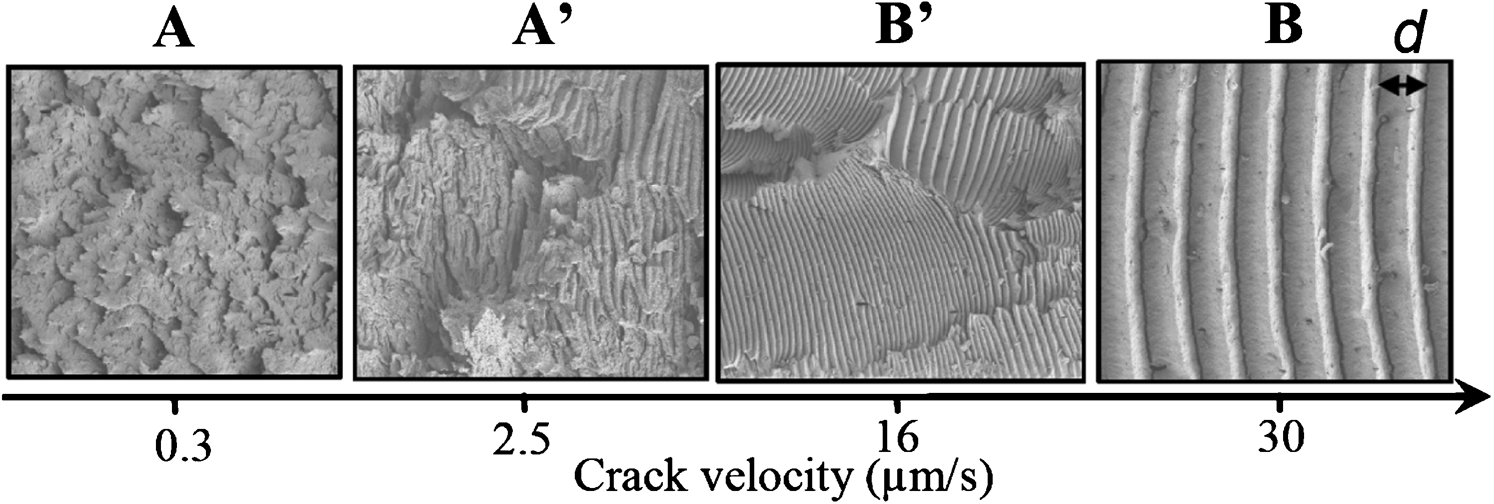
Micrographs (SEM) of rupture interface showing effect of crack velocity on morphology (A: rough disordered surface. A′: mixture of sawtooth striations and rough disordered surfaces; B′: several zones of smaller sawtooth striations; B: large sawtooth striations across sample)
at very low velocity, a rough disordered interface with a ‘leaves’ like structure 11 is observed (A)
at high velocity are observed very regular and mainly straight sawtooth striations oriented perpendicularly to the crack propagation direction and extending across the whole sample thickness (B)
increasing the velocity starting from type A is observed a mixture of a rough disordered interface with small, slightly irregular, sawtooth striations (A′)
decreasing the velocity starting from type B are observed sawtooth striations that split into several zones across the sample thickness and are distributed in size, orientation and curviness (B′).
From the SEM images, we can extract the striation width d (Fig. 5) as a function of the crack tip x position. In Fig. 6, we plot the half striation width d/2. An excellent correlation is observed between the instantaneous crack velocity v and the striation half-width so that we can write: vT = d/2, where T is the duration of one fatigue cycle (here T = 1 s). Note that the correlation is very good in the zones noted B of Fig. 6 where morphologies B and B′ are observed. In the zones noted A where morphologies A and A′ are observed, a measurement of striation size is sometimes possible at a local scale but does not correlate well with the macroscopic crack velocity. It is likely that the crack front velocity is not uniform and can locally be high enough to trigger striations locally without affecting much the overall crack velocity.
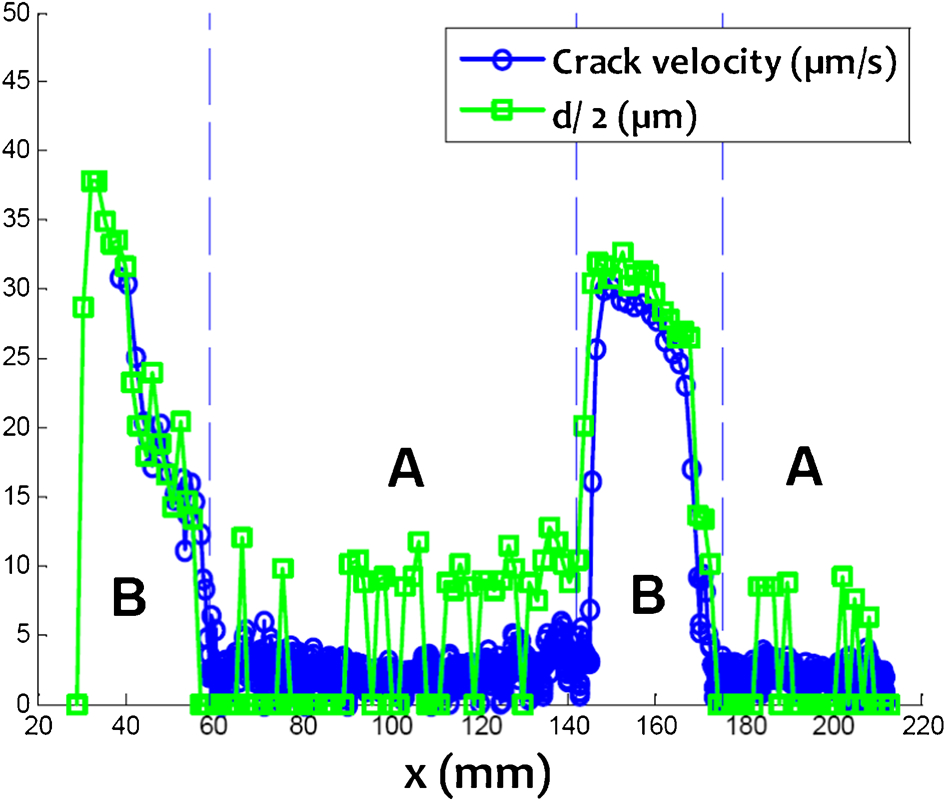
Instantaneous crack velocity and half-width d/2 of sawtooth striations: A and B refers to morphologies shown in Fig. 5; excellent correlation between two sets of data in A shows that exactly two fatigue cycles are needed to form sawtooth striation
Tear energy
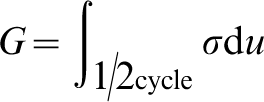
The tear energy G (or elastic release rate) in pure shear geometry is defined as: G = Wh where W is the elastic energy density and h the sample height. It can be estimated for each fatigue cycle as
As shown in Fig. 7, the tear energy computed according to equation (2) has a stable value during most of the experiment, whatever is the amplitude of the applied strain. Deviations are found during the first cycles, probably due to an initially strong Mullins effect, and also at the end of the experiment when the crack length is so large that the geometry cannot be considered pure shear anymore. Note that for each curve in Fig. 7, the data have been plotted up to the cycle number for which the crack length has reached 190 mm.
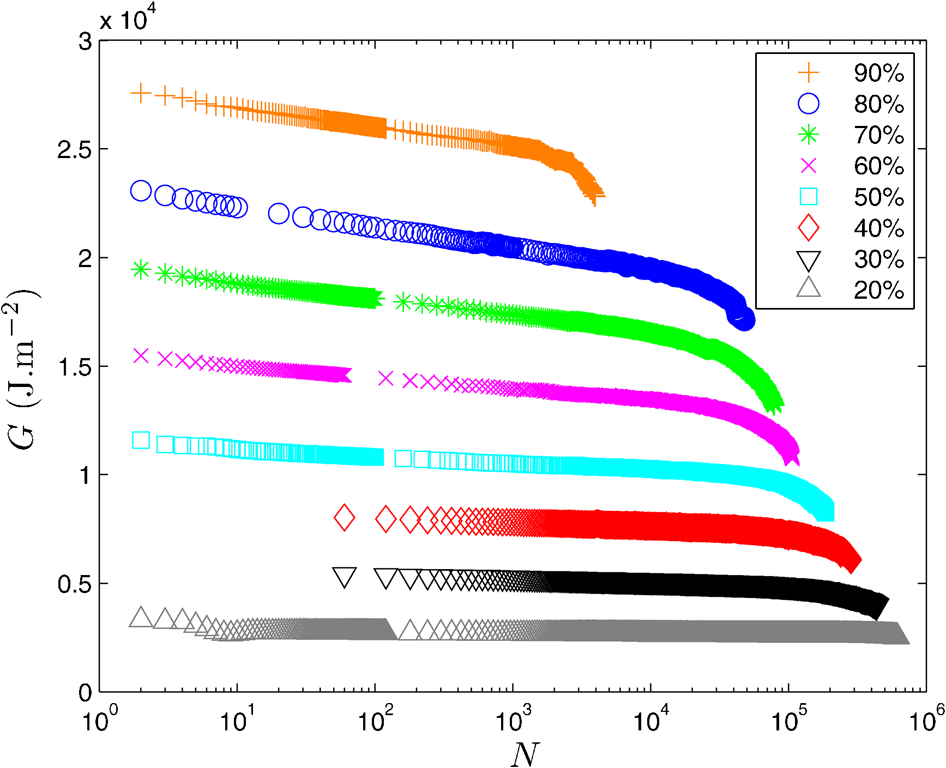
Estimated tear energy G as function of cycle number N for various applied strains
Tear energy versus crack velocity
In Fig. 8, we report the tear energy G as a function of crack velocity. More precisely, the tear energy G corresponds here to the average over an experiment of the values reported in Fig. 7. For the crack velocity, we report the mean crack velocity value when crack growth is stable, and we report the two extreme velocity values in the case of unstable crack growth. In the unstable regime, the high velocity branch (square symbols) also corresponds to a fracture morphology with sawtooth shaped striations as described in the section on ‘Fracture morphology’. Thus, there is a strong correlation between the apparition of a faster crack growth dynamics and a change in the crack path morphology. The origin of this change in behaviour is at the moment still unexplained.
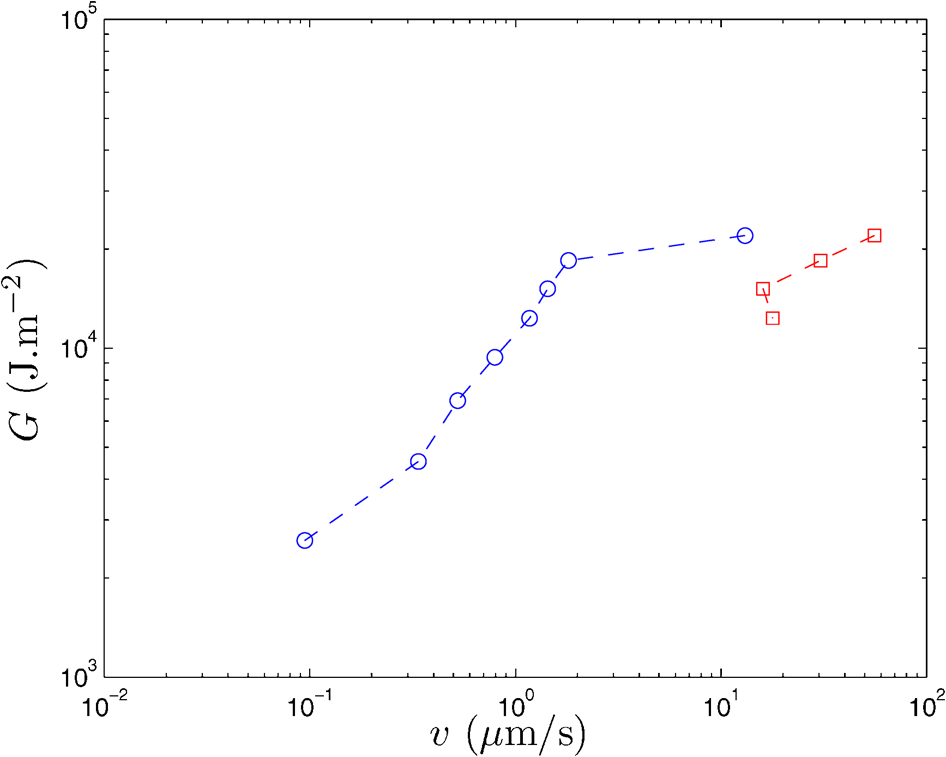
Tear energy G as function of crack velocity: for high values of G, minimum (circles) and maximum (squares) velocities observed during crack growth have been reported
We are currently checking how the existence of the unstable regime depends on the loading characteristics (frequency) and the material properties of the samples.
Conclusions
We have described fatigue experiments in filled natural rubber and analysed both the crack growth dynamics and morphology. We have shown that there exists a range of tear energy above which the crack growth is unstable and statistically evolve between two different regimes. We have shown that fracture morphology and crack growth velocity are strongly correlated, especially in the unstable regime. In contrast with previous works claiming sawtooth striations occur in one fatigue cycle,12, 13 we clearly show that it takes two cycles to form a striation as shown also recently by Flamm et al. 14 Our results suggest that striations result from the alternative selection of two symmetric inclined rupture planes. More work is in progress to validate the generality of these observations.
Footnotes
Acknowledgement
This work was originally presented in: S. Jerrams & N. Murphy (eds), Constitutive Models for Rubber VII. 2012 Taylor & Francis Group, London, UK and subsequently peer-revised and extensively revised for publication in Plastics, Rubber and Composites: Macromolecular Engineering.