
Abstract
The present work concerns three-dimensional modelling of a filler network microstructure in rubber compounds. The model represents the carbon black filler in three states: primary fractal aggregates consisting of spherical over-lapped particles; secondary structures or agglomerates; and partially broken fragments of micropellets. The information about the structure hierarchy of the filler and its distribution in the matrix was obtained from the analysis of atomic force microscopy images of the material surface.
Keywords
Introduction
Accumulation of reliable information on filled rubber morphology, filler distribution and dispersion at micrometre and submicrometre levels is currently a topical problem in rubber science and technology. Recent three-dimensional transmission electron microscopy investigations of Japanese researchers 1 made it possible to visualise the spatial structure and to determine the distances between the closest aggregates in the carbon black networks of rubber compounds; yet some important morphological characteristics of rubber compounds were disregarded in these works. Moreover, the size of the analysed images (1×1 μm) gave no quantitative information concerning the state of filler distribution and microdispersion.
The prevailing paper introduces a new concept of computer reconstruction of a three-dimensional filler (carbon black) network using atomic force microscopy (AFM) based data.
Experiments and data processing
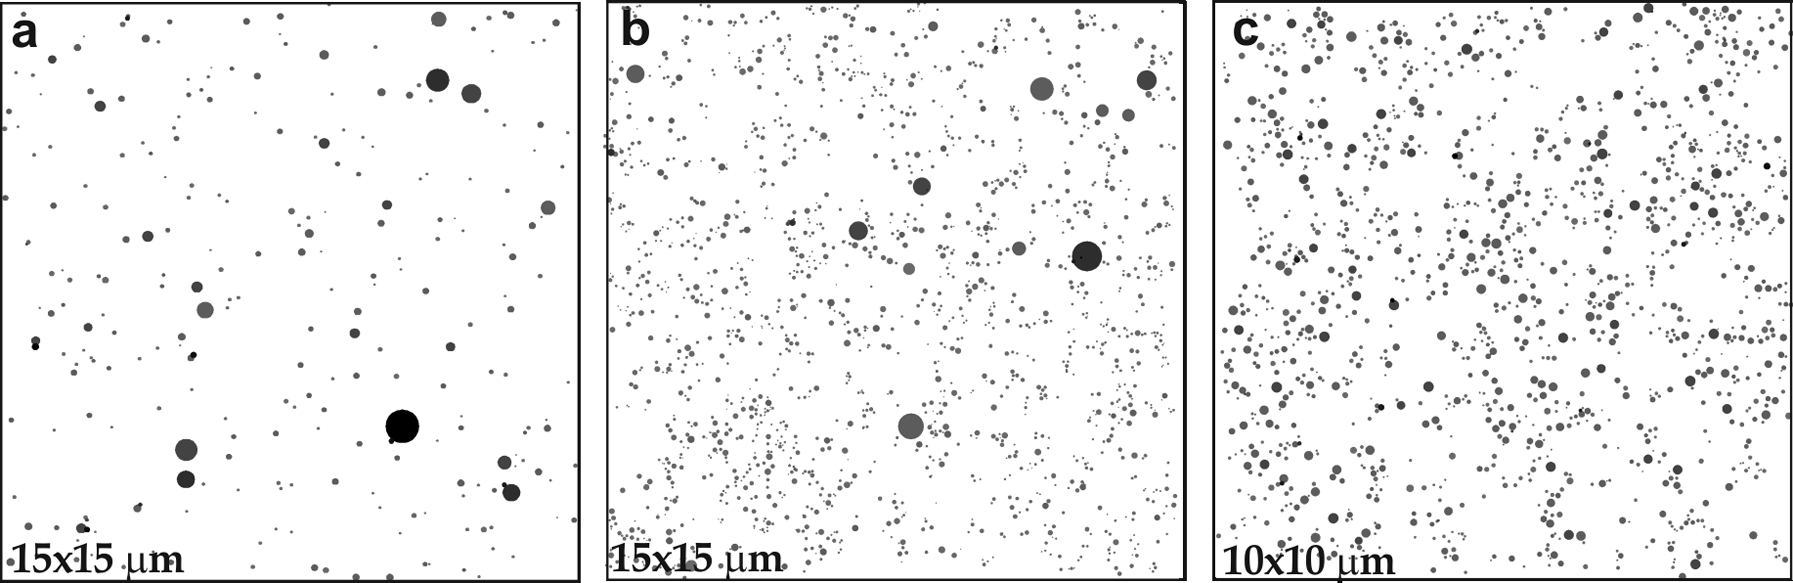
The surfaces of fresh cuts of the materials prepared with cryoultramicrotome Leica UC7 at −90°C were studied. For each specimen, several high quality AFM images of 20×20 μm were scanned for further analysis. The minimal distance between two points in the xy plane was ∼13 nm. The experiments were carried out on Dimension Icon AFM. Custom algorithms developed in Matlab were employed for image processing and further analysis. This work presents the results of microstructural analysis and simulation of three styrene butadiene rubbers (SBRs) filled with carbon ISAF (N220) with different mass fractions: 10, 30 and 50 phr (Fig. 1). The rubber samples were prepared by Sumitomo Rubber Industries Ltd (Kobe, Japan).
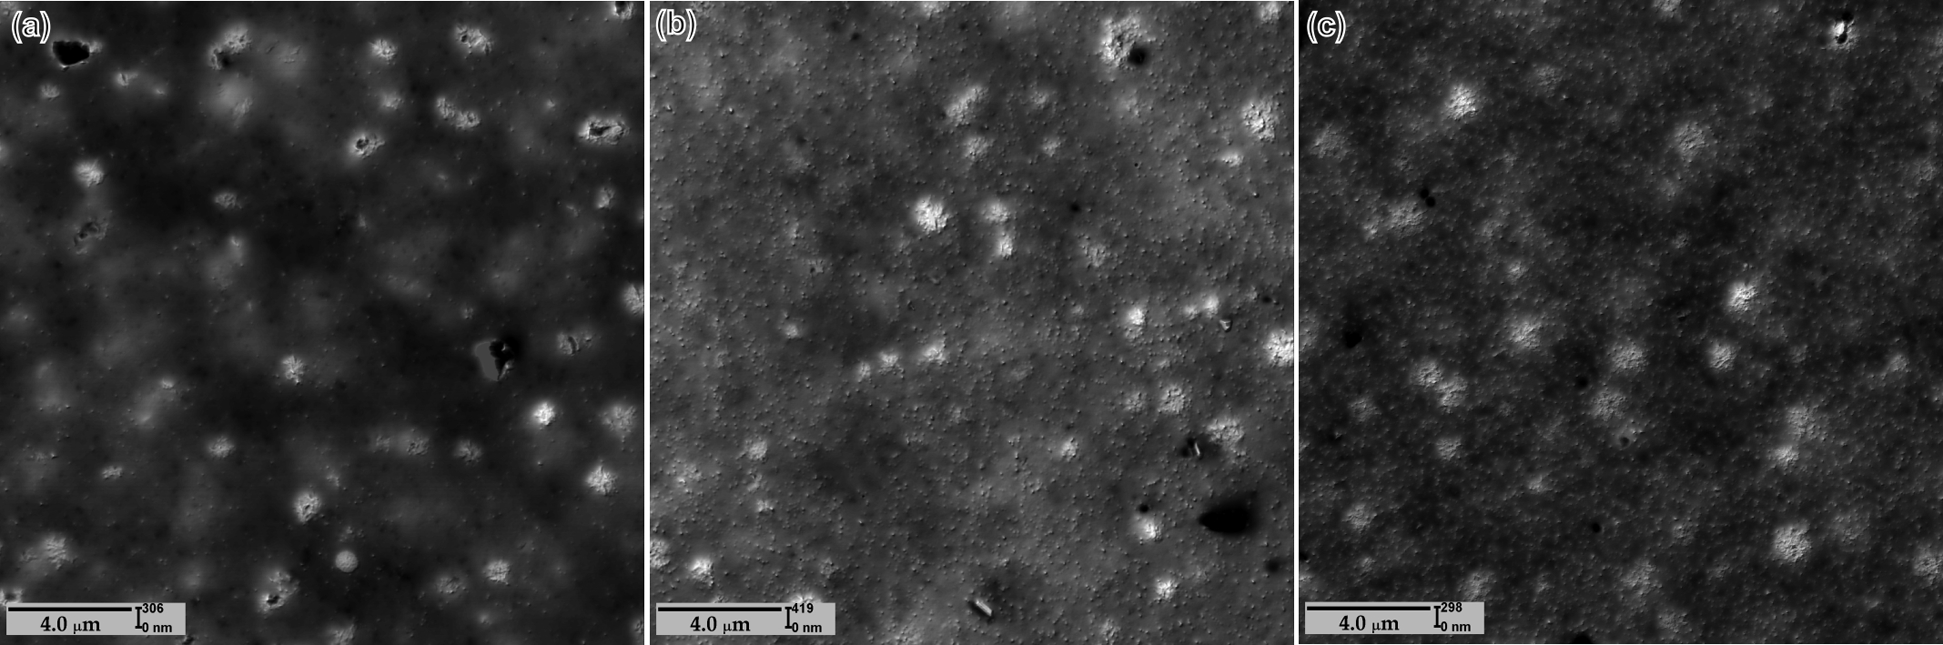
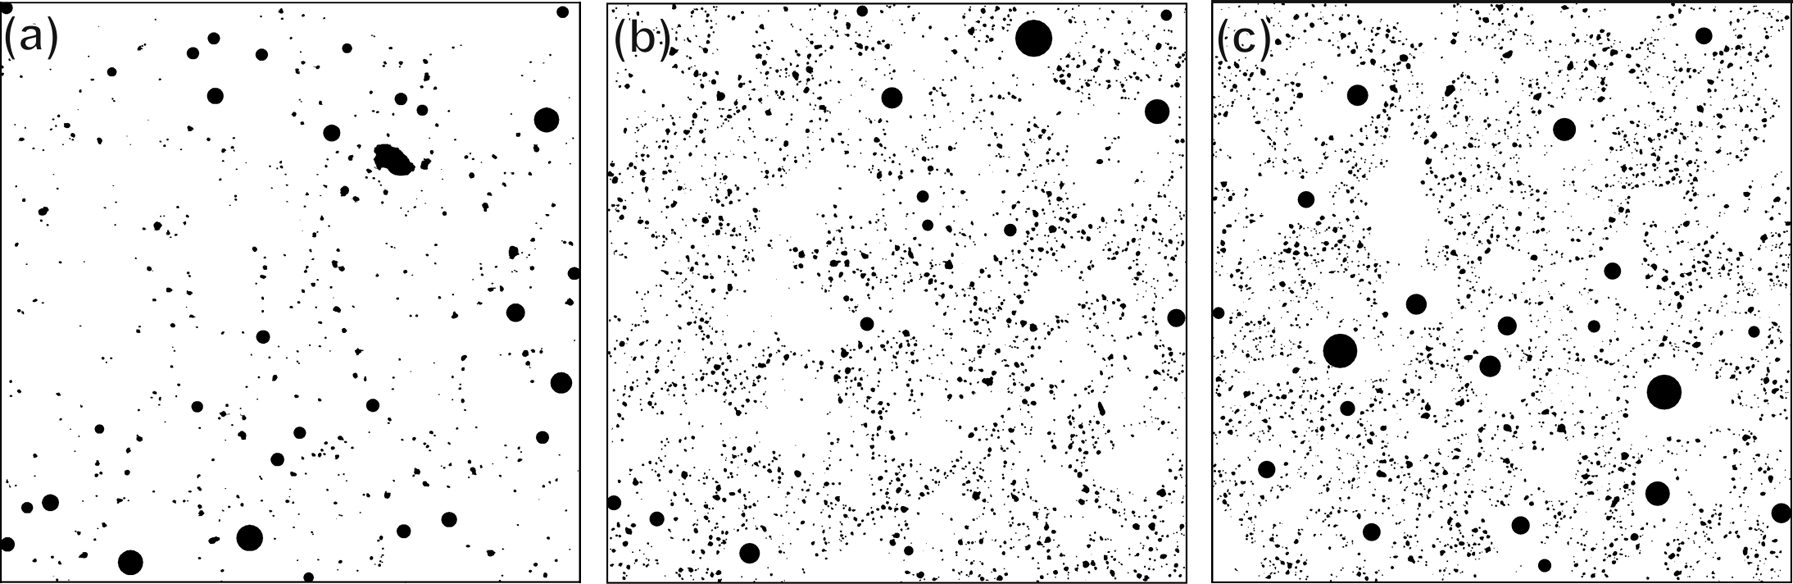
a 10 phr; b 30 phr; c 50 phr
For a 10 phr filled material, we have observed a lot of large, dense objects in Fig. 1, partially broken microgranules of carbon black which almost disappeared in the compound with 50 phr. As a result of applied algorithms, 2 the continuous relief is replaced by the field of discrete structures representing the fragments of the filler network in the material (Fig. 2).
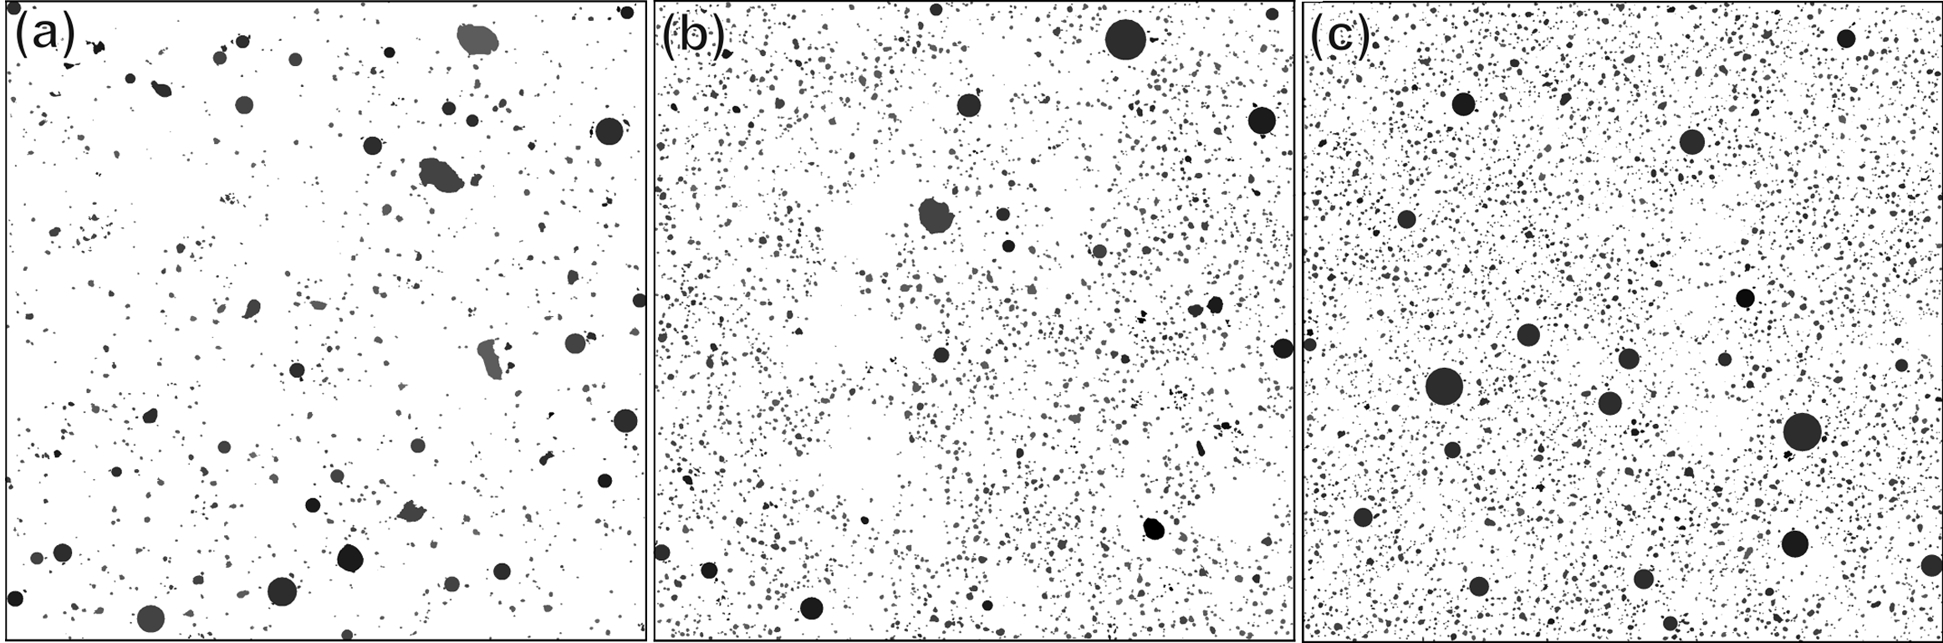
Results of fragmentation of AFM images (Fig. 1): for better visualisation only cross-sections of three-dimensional relief structures are shown; grey scale variation corresponds to different height levels of structures
The algorithm of segmentation involves two steps. Step one is to find any local maxima of the surface under study (vertices of future segments). Step two is to examine the contour lines around the obtained maxima and to determine the boundaries of segments. Hence, the continuous relief is divided into a separate field of segments (Fig. 2).
Examination of the sizes and shapes of segments allowed us to define two types of inclusions in the polymer:
micropellets, for segments of size ⩾300 nm and compactness ⩾0·85 (Fig. 3a)
filler aggregates, for the rest of segments (Fig. 3b).
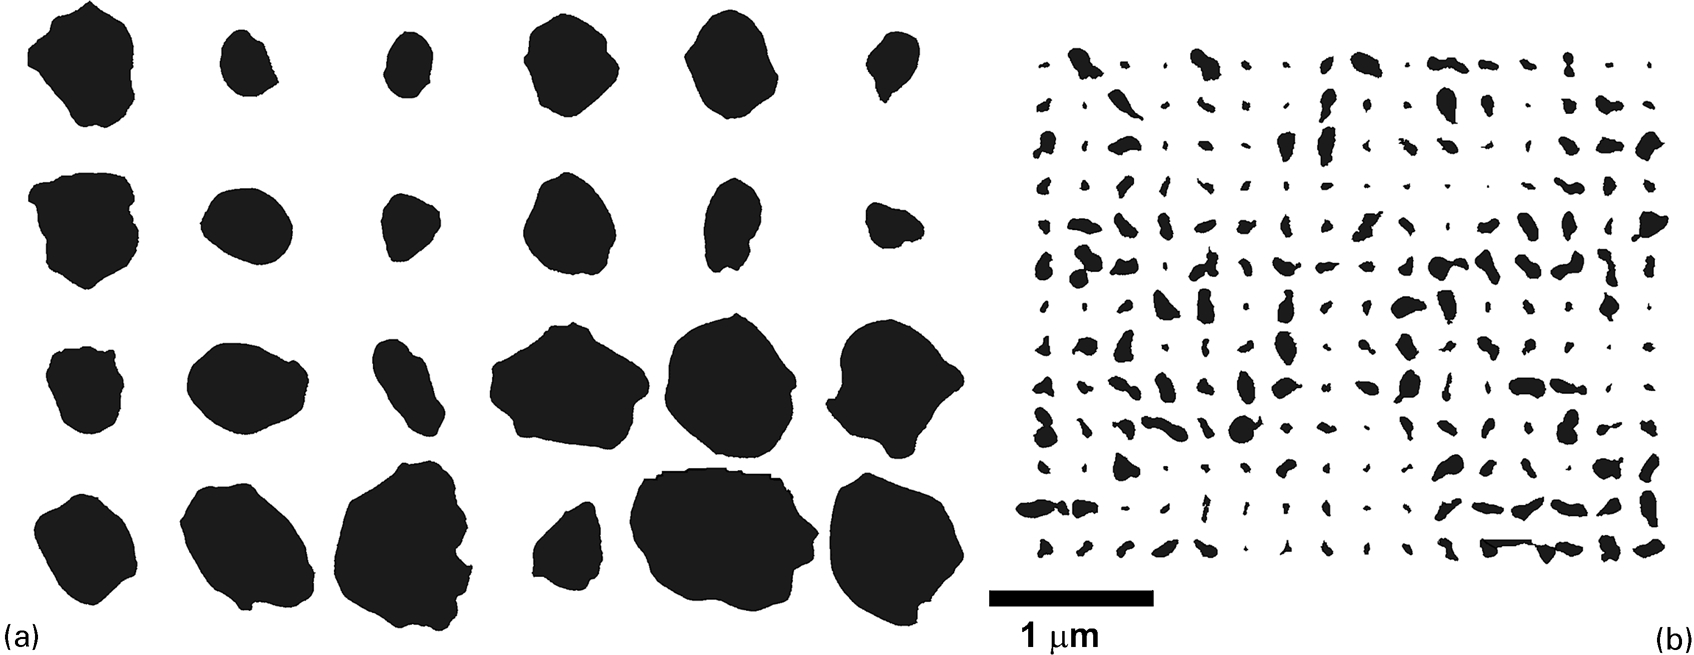
a silhouettes of micropellets and b carbon black aggregates obtained in structural analysis of AFM images
Compactness, mentioned here, is defined as area/perimeter ratio with respect to the circle, for which the corresponding value is equal to unity. Segments, defined as micropellets, are shown in Fig. 2 as round or round-like silhouettes.
The importance of consideration of a rigid phase as aggregates and micropellets can be explained as follows. It was experimentally observed that there are cracks in the vicinity of large and dense inclusions on the surfaces of stretched filled rubber samples. The concentration of the filler in the form of micropellets reduces their contact area with the matrix. Moreover, as will be shown further, the presence of bulk particles increases the inhomogeneity of filler distribution in the matrix. Micropellets are not always associated with fillers; they can also be observed in the unfilled rubber (e.g. zinc oxide or dust particles).
In the following we introduce several notations:
fraction of micropellets φPEL: ratio between the area of segments detected as micropellets and the total area of detected segments
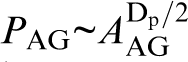
average size, perimeter and area of aggregates RAG, PAG, AAG; and average size of micropellets RPEL (area and perimeter of micropellets are not used in this study)
area–perimeter fractal dimension Dp that connects area and perimeter of aggregates as
 . Ehrl et al.
3
gave next relation between Dp and mass fractal dimension DAG of spatial aggregate of spherical particles
. Ehrl et al.
3
gave next relation between Dp and mass fractal dimension DAG of spatial aggregate of spherical particles

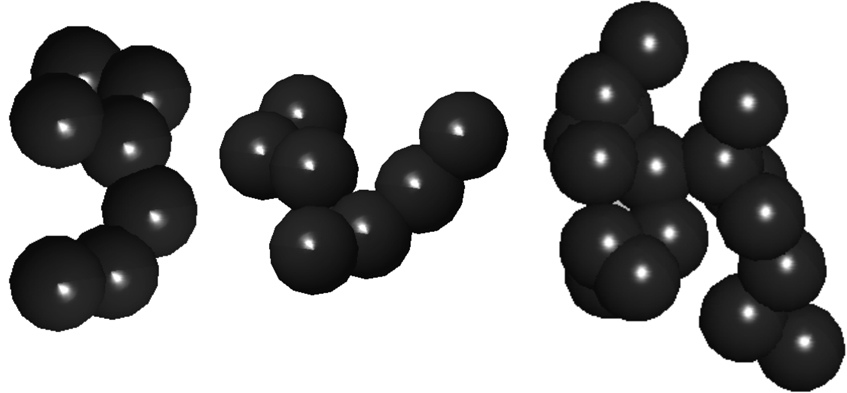
Examples of simulated aggregates
Measured specific surface area of simulated aggregates is ∼113 m2 g−1 which is close to the known CTAB value of the given CB grade (109 m2 g−1) and independent of filler mass fraction.
An AFM relief represents a rough surface, and the filler network fragments (Fig. 2) are situated relative to each other at different heights and even at low filler fraction one can see a lot of network segments located everywhere. To characterise the filler distribution it is necessary to leave only those segments that belong to some fixed height. To do this, the distribution histograms of heights of fragment bases are constructed. The height h corresponding to the maximum frequency (modal) is determined, and only the fragments with z coordinate of the base ∈h±50 nm are chosen. Therefore, one has got a slice of the material of 100 nm thickness. Figure 5 shows the transformation results obtained for the images given in Fig. 2.
Cuts of filler network of a SBR/10 phr, b SBR/30 phr and c SBR/50 phr
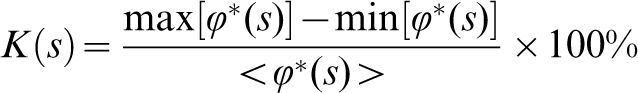
Using cuts one can estimate the size s from which the filler distribution in the material supposed to be homogeneous. In this case, from the examined image randomly n boxes with side s were randomly chosen and fractions φ* of occupied area by segments in each box to the total area s
2
of the box were obtained. The function of the oscillation coefficient K(s) versus s could be used as measure of homogeneous filler distribution
The segmented surfaces are not homogeneous (Fig. 5). It is seen that these surfaces have high filler concentration regions connected by branches, i.e. the visible parts of spatial secondary structures (clusters or agglomerates). The number of primary structures (aggregates) NCL is related to the size of agglomerates RCL, by the fractal distribution law as

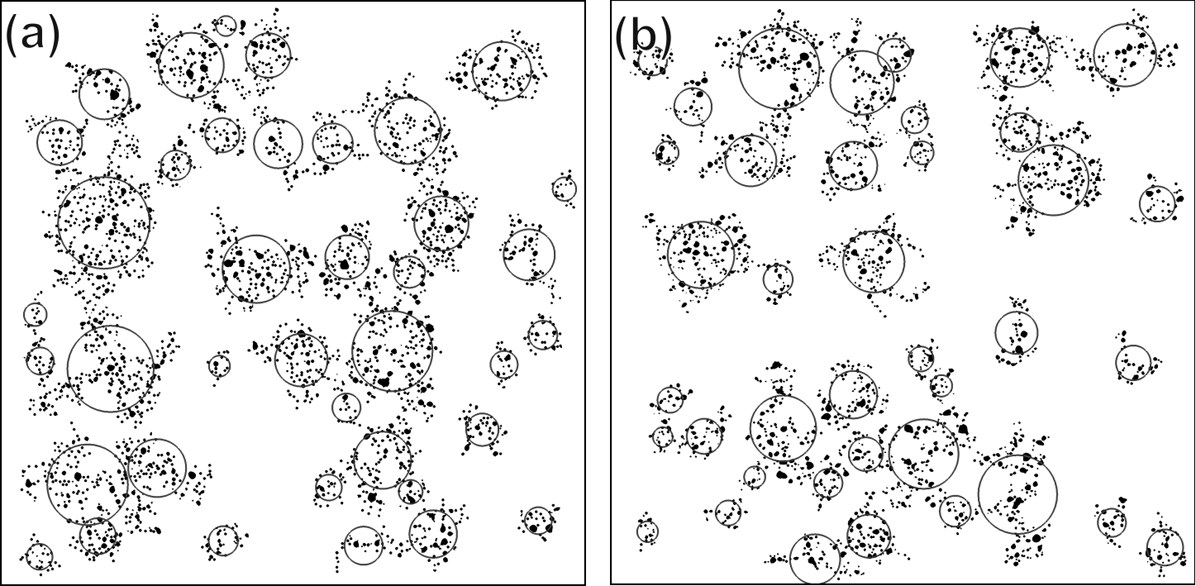
Detected clusters with corresponding sizes in a SBR/30 and b SBR/50
In the low filled rubber SBR/10 it was impossible to detect any reliable fractal clusters. If the fractal dimension DCL of projections of spatial fractal clusters is <2, then this DCL corresponds to the dimension of spatial cluster.
4
In this case one can also estimate the density of clusters ρCL, i.e. the number of clustersper 1 μm
3
of material
 is the volume of an aggregate;
5
〈RCL〉 is the average size of clusters (mean distance between centre of cluster and centres of its aggregates).
is the volume of an aggregate;
5
〈RCL〉 is the average size of clusters (mean distance between centre of cluster and centres of its aggregates).
Results and discussion
Major microstructural parameters of examined materials are summarised in Table 1.
Microstructural parameters of examined materials*
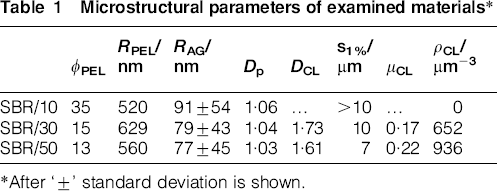
*After ‘±’ standard deviation is shown.
The results show that the fraction of micropellets decreases with increasing filler concentration. This is attributed to the increase in torque during the mixing process, which leads to an increase in friction between the microgranules and the rubber matrix and results in dispersion of micropellets into smaller fragments. Therefore, the fraction of micropellets and their average size decrease. A similar trend (decrease in size) is observed for aggregates; the difference between 10 and 30 phr is found to be greater than that between 30 and 50 phr. Therefore, one can say that, at filler fractions <30 phr, the size of aggregates approaches some stationary level. Moreover, in all cases the size distribution of aggregates can be fairly well approximated with a lognormal density distribution function.
The size of inhomogeneities s1% also falls with increasing filler fraction. In SBR/10 it was impossible to reach K(s)<1% on the reliable maximal size of the box (supposed to be half of image size which is 20 μm).
The area–perimeter fractal dimension Dp of aggregates is smaller than 1·245, which, according to Herrmann et al., 6 is typical for a lot of kinds of carbon black aggregates in the polymer matrix. The values of the mass fractal dimension of the obtained aggregates (2·84 … 2·85) is slightly higher than the nominal values (2·43 5 ), i.e. their shape is almost round. These differences may be attributed to the combined action of such factors like the irregularities of surface aggregates which are filled with a polymer layer, and the finite geometry of the AFM probe which restricts small scale measurements. The influence of the latter factor can be reduced by using probes with a smaller curvature radius.
In the analysis of the fractal dimensions of clusters, two types of aggregation were observed: the diffusion limited aggregation (D≈1·73) and the screened growth aggregation model (D≈1·61). 7 In last case the probability of sticking aggregate with cluster is not uniform, obviously as result of the presence of micropellets. Hence, large and bulk inclusions distort natural growth of filler network.
Finally, we describe briefly the main stages of recovery of the three-dimensional structure of the filler in the volume L3 (L⩾s1%). The fillers (aggregates and microgranules) are presented now as spheres whose size is known from microstructural analysis and the total mass fraction corresponds to the prescribed one (10, 30 and 50 phr). All micropellets and ρL 3 spheres–aggregates (centres of the future agglomerates) are randomly arranged in the volume. The fractal clusters of filler spheres are generated around these centers until all spheres are placed. The distances between adjacent spheres were in accordance with three-dimensional transmission electron microscopy data 1 – 6 … 4 nm.
Because the size s* is quite high, the constructed volumes look like black cubes. For better representation, only the cuts of the obtained materials, the spheres, whose z coordinates are within 500 nm from the centre of the volume, are shown in Fig. 7.
a SBR/10; b SBR/30; c SBR/50
Internal volumes of synthesised structures are shown in Fig. 8.
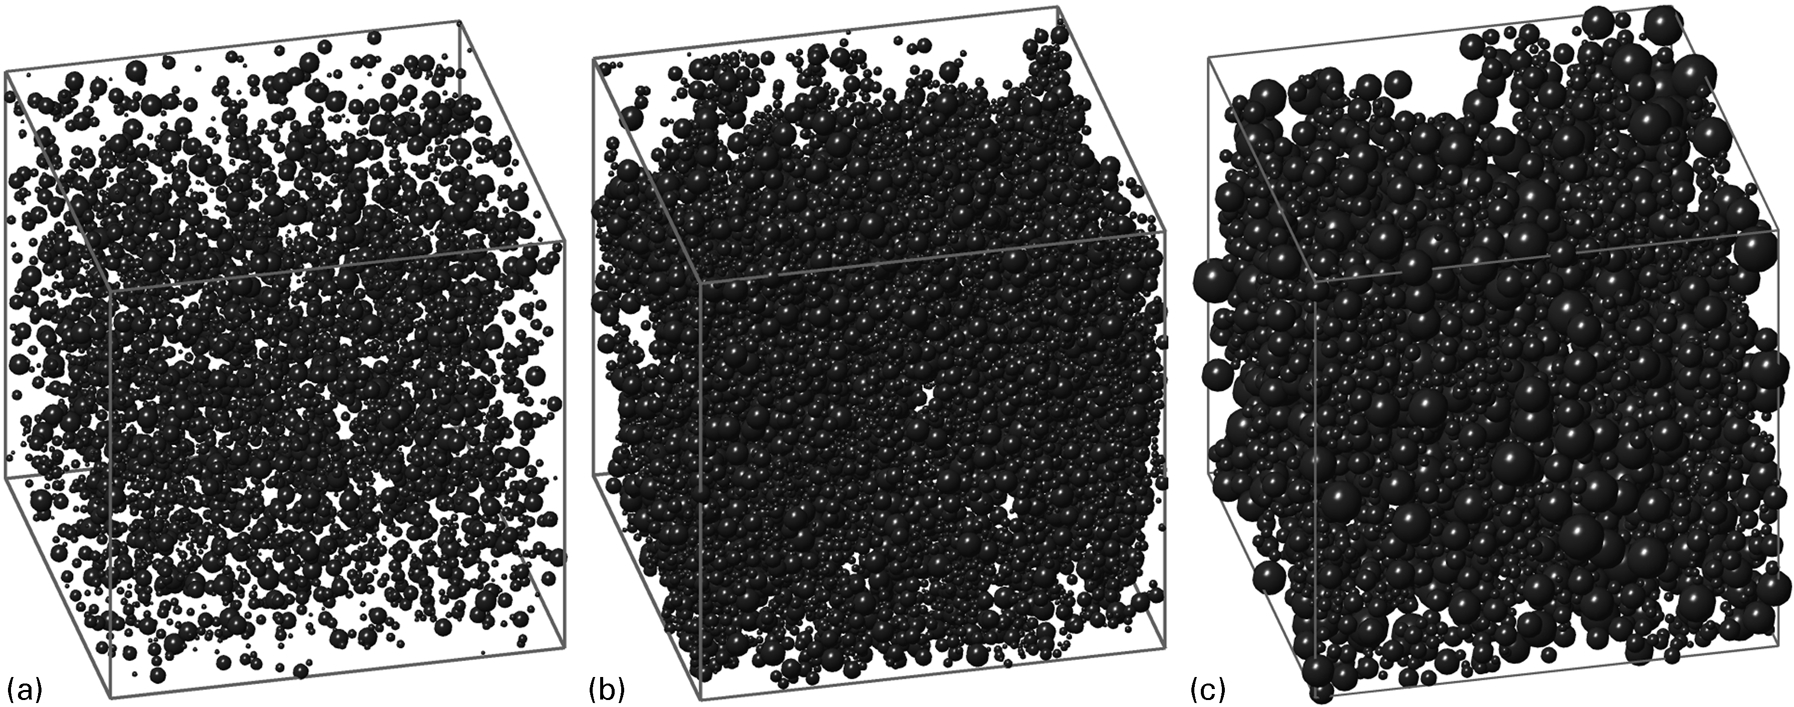
a SBR/10–4 μm3; b SBR/30–3·5 μm3; c SBR/50–2 μm3
Conclusions
An algorithm was developed to construct the spatial structures reflecting the peculiarities of the actual microstructure of filled polymers. The following structural properties were considered: the arrangement of filler particles in secondary structures (agglomerates), the minimum representative size of the modelled volume, the lognormal aggregate size distribution, and the presence of large particles. These input parameters of the model were determined in the structural analysis of the AFM images of the materials under study. To evaluate the size of filler dispersion inhomogeneity, a new characteristic, the heterogeneity index [function K(s)], was introduced.
Further research will include replacement of spheres with real shape aggregates (Fig. 6) and the structural–mechanical modelling of materials with allowance for the interaction forces between aggregates during tension and compression of model volumes.
Footnotes
Acknowledgement
I. A. Morozov grateful for support of RF president grant for state support of young Russian scientists no. MK-3914·2011·8 and the RFBR grant no. 11-08-00178-a. This work was originally presented in: S. Jerrams & N. Murphy (eds), Constitutive Models for Rubber VII. 2012 Taylor & Francis Group, London, UK and subsequently peer-revised and extensively revised for publication in Plastics, Rubber and Composites: Macromolecular Engineering.