
Abstract
Since the pioneer works of Gough and Joule, the thermal characterisation of elastomers under mechanical loading has been investigated by numerous research teams. This is not surprising as the thermal signature of rubber is very useful data to investigate the dissipation mechanisms as well as the thermodynamical variables and couplings. In former recent studies dealing with fatigue investigations, an experimental protocol was developed. This protocol imposes cyclic loading to hourglass shaped samples, takes into account the large displacements and permits dissociation between the intrinsic dissipation, responsible for the mean temperature variation (called heat build-up in the literature) and thermomechanical couplings responsible for the temperature variation around this mean value during one cycle. Up to now, the mean temperature has been investigated in order to feed an energetic fatigue criterion. The aim of the present study is to investigate the thermomechanical couplings and the ability of thermal measurements to exhibit some specific thermomechanical properties observed for rubberlike materials. The materials studied are natural rubber and styrene butabiène rubber compounds filled with several amounts of carbons blacks. The experimental data clearly exhibit interesting features such as the thermoelastic inversion point and difference in the temperature signal between mechanical loading and unloading. This rich database is analysed and correlated to other results from the literature. The main results obtained are dealing with the ability of accurate measurements to characterise the thermodynamic couplings and to detect the stress induced crystallisation.
Keywords
Introduction
The mechanical characterisation for engineering purposes is usually limited to a stress and strain analysis, which is clearly not enough to describe the thermodynamics ruling the material behaviour. This is especially true for rubbery materials where energetic and entropic contributions are both at work, with possible changes of the microstructure (crystallisation, fillers network…). The description of the dissipation and coupling terms is therefore required to enhance the understanding and the modeling reliability. The classical ways to do so are to measure the temperature changes of a sample submitted to a mechanical loading or to measure the evolution of the mechanical variables during a non-isothermal test. This is not an easy task, whatever the material considered because the temperature evolution is not an intrinsic property of the material, and clearly depends on the geometry and on the mechanical and thermal boundary conditions. Moreover, the temperature changes are usually very low, requiring specific experimental care. Moreover, elastomeric materials are complex to analyse due to their specific behaviour involving low thermal conductivity (leading to temperature gradients in massive samples), large changes in shape (large displacements, large change of the boundary conditions), cyclic softening and numerous sources for dissipation (viscosity, crystallinity, damage, etc.).
Since the pioneer works of Gough 1 and Joule, 2 the thermal characterisation of elastomers under mechanical loading has been focusing on two main issues: the evaluation of the thermomechanical couplings and of the intrinsic dissipation. The first issue has been investigated for long and is a basis for the understanding of the thermodynamics of rubbery materials, commonly based on the entropy change of a chains network, with a negligible change of the internal energy between the strained and unstrained states. Various experimental data from the literature and reference works 3 show that this strong assumption is justified for a wide range of strain, but is very far from the truth at low strain (<20%) and high strain (if crystallisation is involved). Furthermore, other reference works by Joule, 2 Anthony et al., 4 Caston, 5 Peterson, 6 James and Guth 7 or Dart and Guth, 8 took advantage of the thermal measurements to illustrate that the volumic change, commonly supposed to be negligible, was to be accounted for in order to describe the thermal behaviour at low strains (thermoelastic inversion). The second issue deals with the temperature rise observed under cyclic loading, which is related to the complex phenomena involved in the hysteretic mechanical loop. In this field, the problem is to split the intrinsic dissipation and the couplings involved9, 10 and to identify the contributions of several sources to the intrinsic dissipation (viscosity, damage, crystallisation…), for example, to use thermal measurements to feed an energetic fatigue criterion. 11
In former recent studies dealing with fatigue and heat build-up investigations (Le Saux and co-workers11, 12), an experimental protocol was developed, which allows to follow the temperature field evolution under cyclic loading for large displacements, and to reach a very good spatial and temperature resolution. Up to now, the focus was given on the mean temperature evolution along time in order to investigate the link between the dissipated energy and the hysteretic mechanical loop. In the present study, the temperature variation along one cycle, performed for stabilised mechanical and thermal states, has been studied. The protocol has been applied for several amplitudes to natural rubber (NR) and styrene butabiène rubber (SBR) compounds filled with various amounts of carbon blacks. The accurate measurements obtained have been analysed and compared to the results from the literature to discuss the detection of thermoelastic inversion and of the mechanically induced crystallisation.
Experimental
Materials
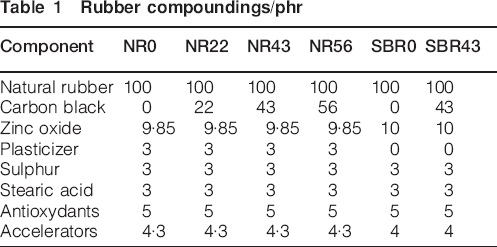
In this study, several compounds of NRs and SBRs filled with different amounts of carbon black have been considered. Table 1 gives some information on the material compoundings.
Rubber compoundings/phr
The choice of hourglass shaped samples (called AE2 in the following, see Fig. 1), was motivated by the former studies dealing with fatigue. This geometry proved to provide an effective balance between the volume of material tested, the thermal exchange conditions and the section which is low enough to avoid a high temperature gradient between skin and core. Moreover, the strain localisation induced by the geometry allows reaching high local strain for a range of grip displacement low enough to keep the measured area within the observation field of the fixed camera, despite a single grip is moving. The severe change of the geometry also eases the tracking of the central section during the cycles.
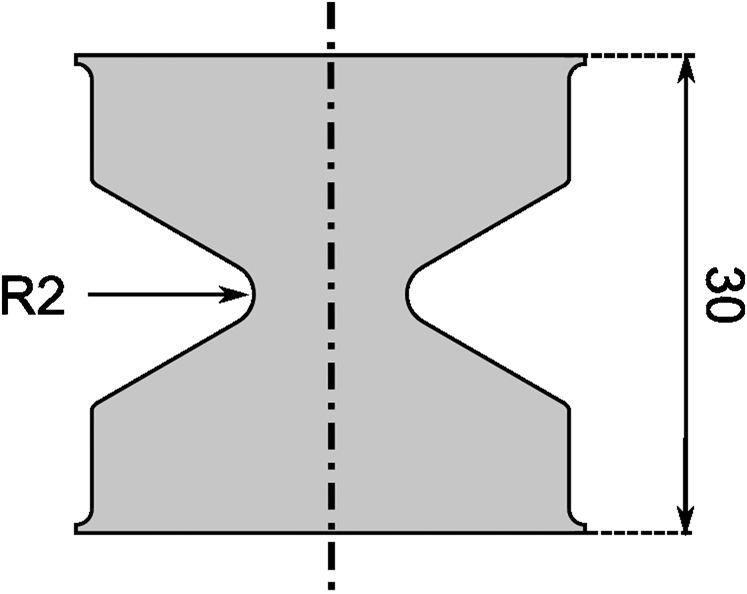
Geometry of samples used in this study: dimensions are given in mm
Experimental devices
The tests have been achieved on an INSTRON hydraulic testing machine (model 1342) equipped with a 100 kN cell force. All the experiments have been displacement controlled and conducted under a null displacement ratio Rd at a frequency of fr = 0·5 Hz. In order to avoid any transient mechanical and thermal effects, the thermal measurements were performed on a cycle performed under stabilised mechanical and thermal states. The main reasons that lead to this choice are:
the thermal and mechanical response is stabilised for each displacement amplitude, which is very important to insure the reliability and repeatability of thermal measurements 4
a low frequency is needed to limit the well known heat build-up effect that occurs on rubber-like materials under cyclic loadings 11 and to limit the influence of temperature on mechanical and microstructural variables. 13 The maximum temperature variation measured at the skin is <3°C. Moreover, finite element analyses using the model developed by Le Chenadec et al. 14 and validated by Le Saux et al. 12 were performed and illustrated that the maximum temperature rise in the sample volume does not exceed 5°C, which means that the mechanical and crystallisation couplings to the temperature can be neglected
the stabilised thermal state is reached after a low number of cycles (≈650 cycles at 0·5 Hz), so that no fatigue damage is affecting the thermal measurements
a null load ratio will avoid an evolution of the crystallinity from one cycle to another: at the beginning of each cycle, the material should be in an amorphous state.
The Table 2 gives the maximum displacements tested on the different compounds.
Experimental conditions used in this study*
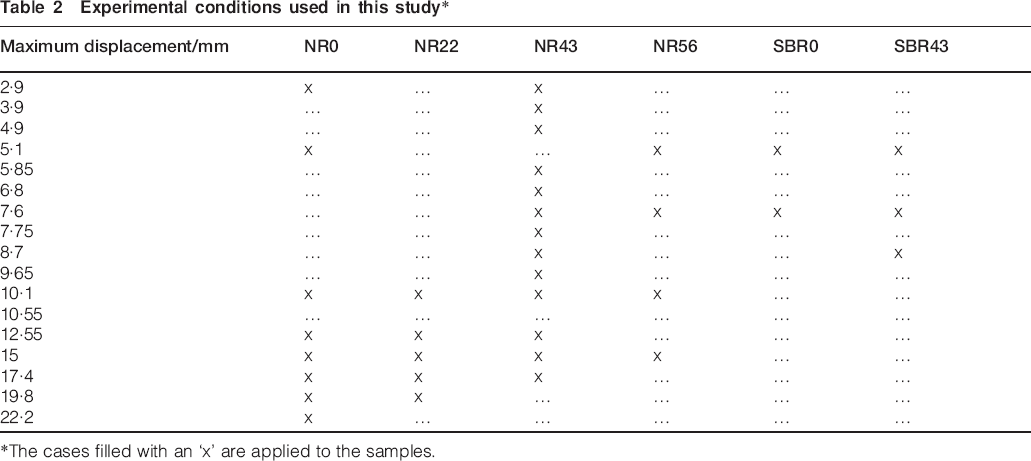
*The cases filled with an ‘x’ are applied to the samples.
The temperature measurements have been performed with an MWIR 9705 FLIR infrared camera. This device is equipped with a stirling cycle cooled indium antimonide focal plane array. The focal plane array is a 256×320 array of detectors digitised on 14 bits and sensitive in the 3–5 μm spectral bands. In order to convert the thermosignal into temperature (in °C), a preliminary calibration operation was performed with an HGH DCN1000 N4 extended black body and a classical two points non-uniformity correction has been applied to the array of detectors. A specific care was taken to minimise the influence of the external environment on the measurements by the use of a black box around the sample and the grips of the testing machine. The relative measurement precision is ∼20 mK. Emissivity measurements have been performed on our materials according to a protocol already proposed by Poncelet 15 and based on reflectivity measurements. 12 These tests revealed that the natural emissivity of our materials is very close to 0·98 whatever the material considered (which is also the emissivity of the black body used for the calibration). Consequently, no specific surface preparation of the samples is needed. More information are given in Le Saux et al. 12
Measurement protocol
The samples are submitted to a sinusoidal loading using the experimental conditions given in the previous section and an IR movie is performed once the thermal and mechanical stabilisation state is reached. For this movie, the frequency capabilities of the camera are fully exploited (at the acquisition rate of 50 Hz) and only the central zone (in the thinner section, see Fig. 2) of the samples is analysed. To reduce the measurements noise, an average on 15–20 pixels is performed for each movie. A finite element analysis using a cyclic behaviour law previously calibrated allows the conversion of the displacement of the specimen to a local value of the first principal strain measured in the area analysed during the thermal measurements.
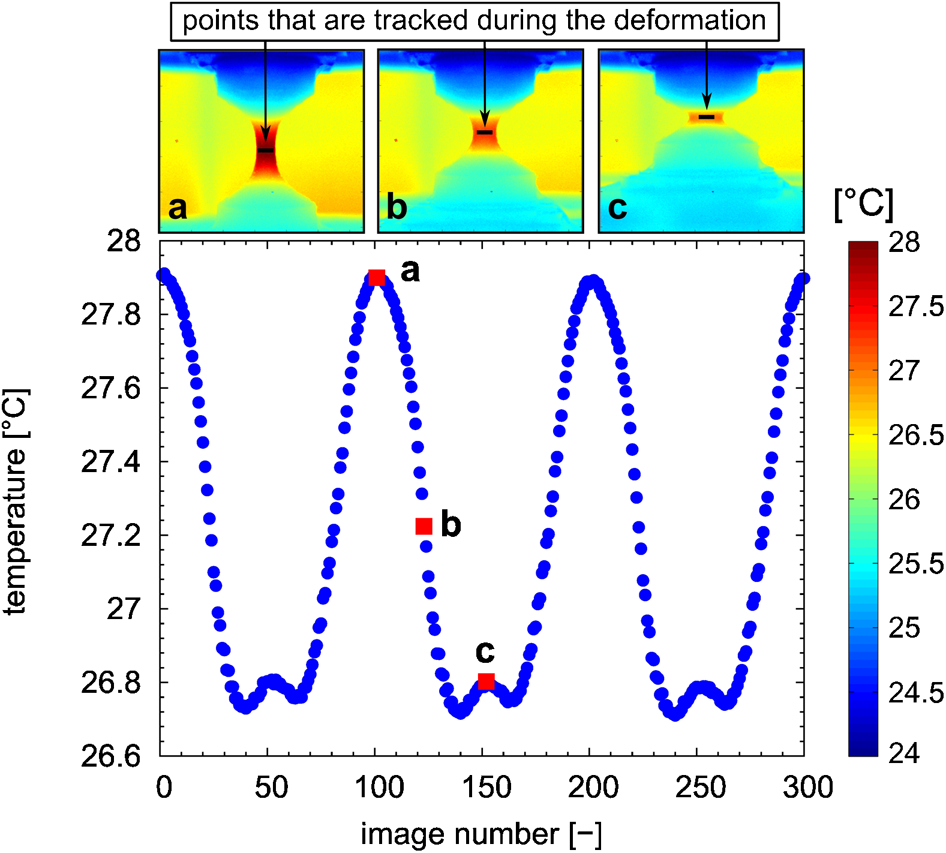
Evolution of temperature measured in central section of specimen along cycles and illustration of investigated zone
Results
Evolution of temperature along time
Figure 2 shows the raw data obtained during a mechanical cycle and the evolution of the sample geometry and of the investigated zone.
Figure 3 presents the evolution of the temperature variation (ΔT = T−T0, T0 being the temperature measured when the sample is not deformed) along time for several amplitudes, measured on all the compounds tested. As expected, due to the various mechanical and physical properties of the compounds, the thermal signatures measured are different. The maximum temperature reached is evolving accordingly to the maximum loading amplitude. Moreover, this value is increasing with the amount of fillers in the material, which is consistent with the evolution of the mechanical stiffness.
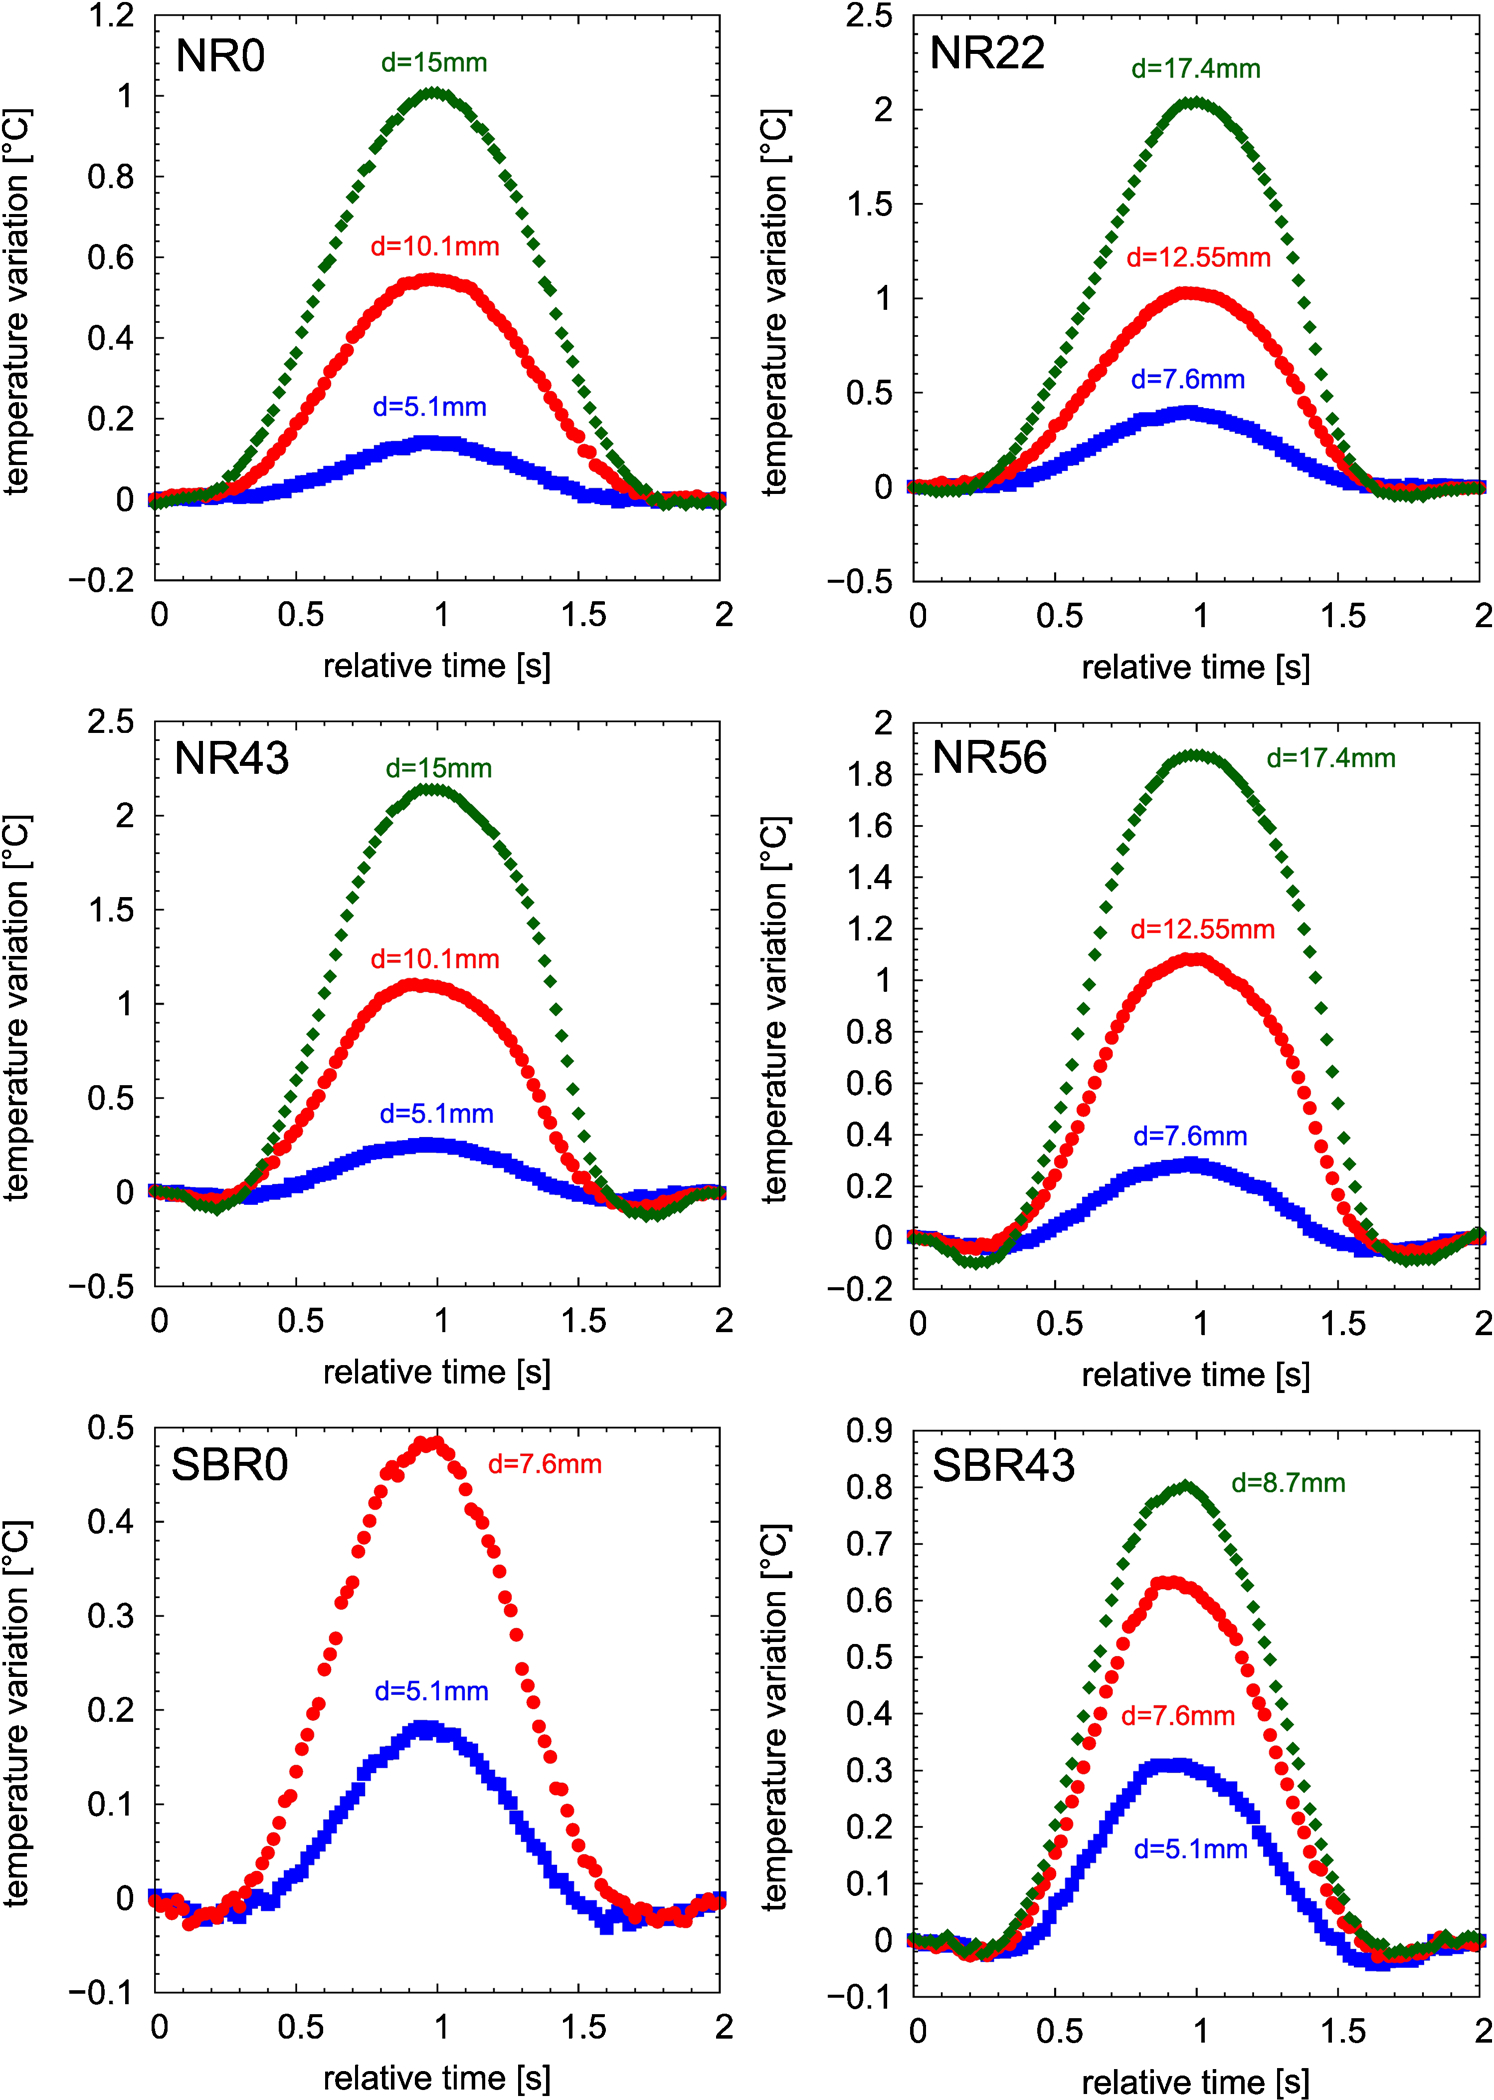
Evolution of temperature variation in central section of specimens for several maximum displacements
Two main features are striking on these curves. The first one is the clear detection of the thermodynamic inversion both for loading and unloading, for most of the compounds. The second one is the non-symmetrical thermal response along the time, despite that the displacement signal was a well mastered sinus.
Load curves
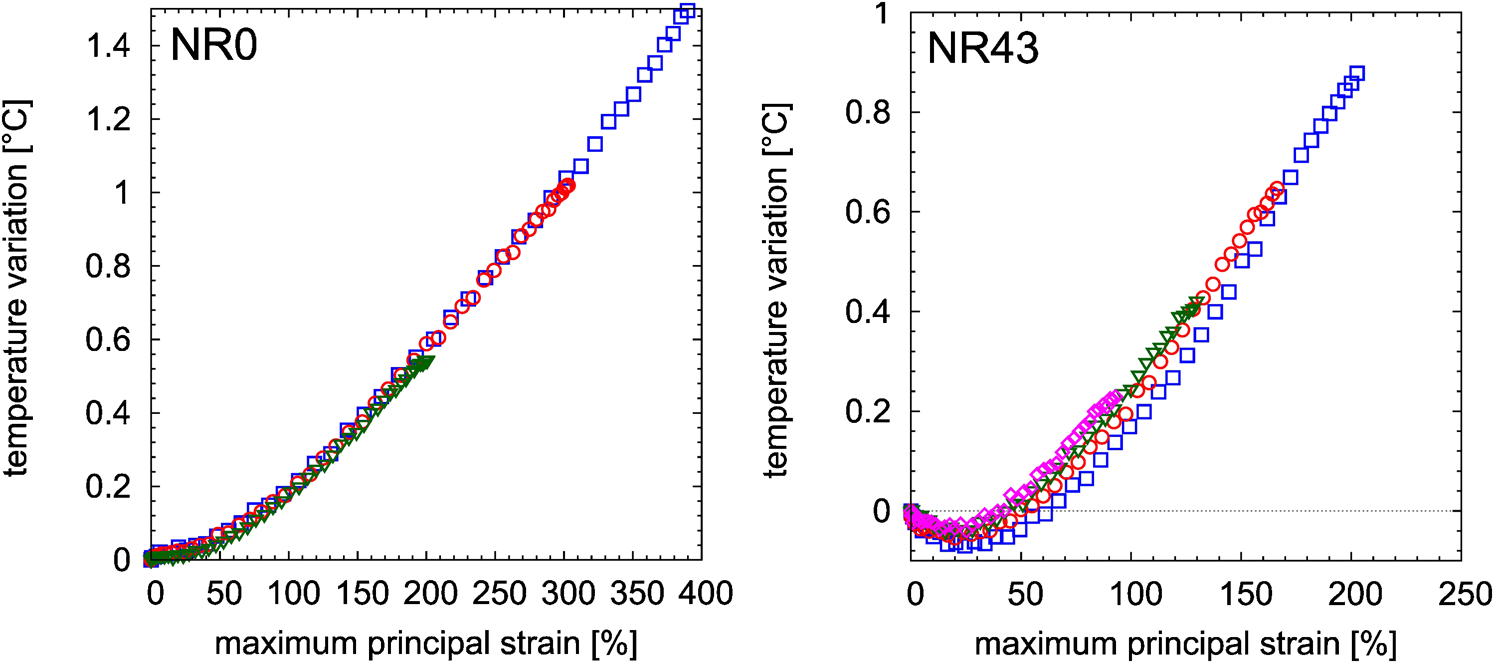
In this section, a focus is given on the load curve, which is usually used to identify the so called thermoelastic inversion strain, for a filled and unfilled rubber compound. Figure 3 plots the evolution of the temperature variation for several maximum displacements.
Figure 4 illustrates that the evolution of the temperature is not sensitive to the maximal strain reached in the case of NR0, but that the evolution of the curves is significant for NR43: as the maximum strain increases, the curve is shifted to higher strains and exhibits a stronger initial decrease. The shift of the inversion point is clarified in Fig. 5, which plots the evolution of the thermoelastic inversion point as a function of the maximum strain reached during the cycle. The increase in the inversion strain with the maximum strain reached during the cycle is clearly visible. It is worth noting that the range measured is very similar to the values found in the literature.2, 9
Comparison of load curves measured for several maximum loads
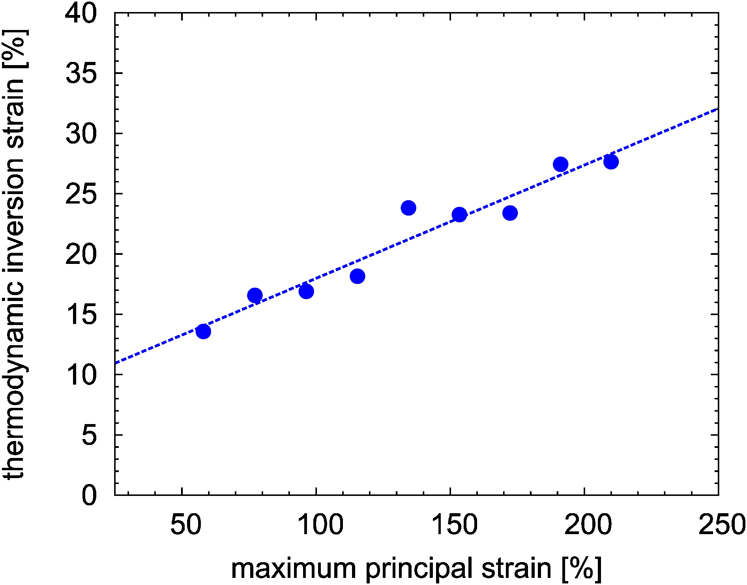
Illustration of Mullins effect consequences: evolution of thermoelastic inversion strain (NR43)
This phenomenon could be related to the consequences of the Mullins effect, as the overall stiffness is decreasing, which is supported by the fact that this effect is not observed on the unfilled compound, but it could also be explained by a possible permanent strain inducing a slight compression state for a null displacement of the sample. This point therefore clearly needs further investigations and tests using a specific driving procedure (imposing the displacement amplitude and the minimum load) will be achieved in order to include the influence of this parameter.
Load/unload curves
This section focuses on the non-symmetrical thermal response observed for the loading and unloading steps, as shown in Fig. 3. The evolution of the temperature variation is this time analysed versus the local strain. Figure 6 presents the results obtained for the different compounds for a comparable maximum strain. Two main observations can be highlighted and will be discussed in the following.
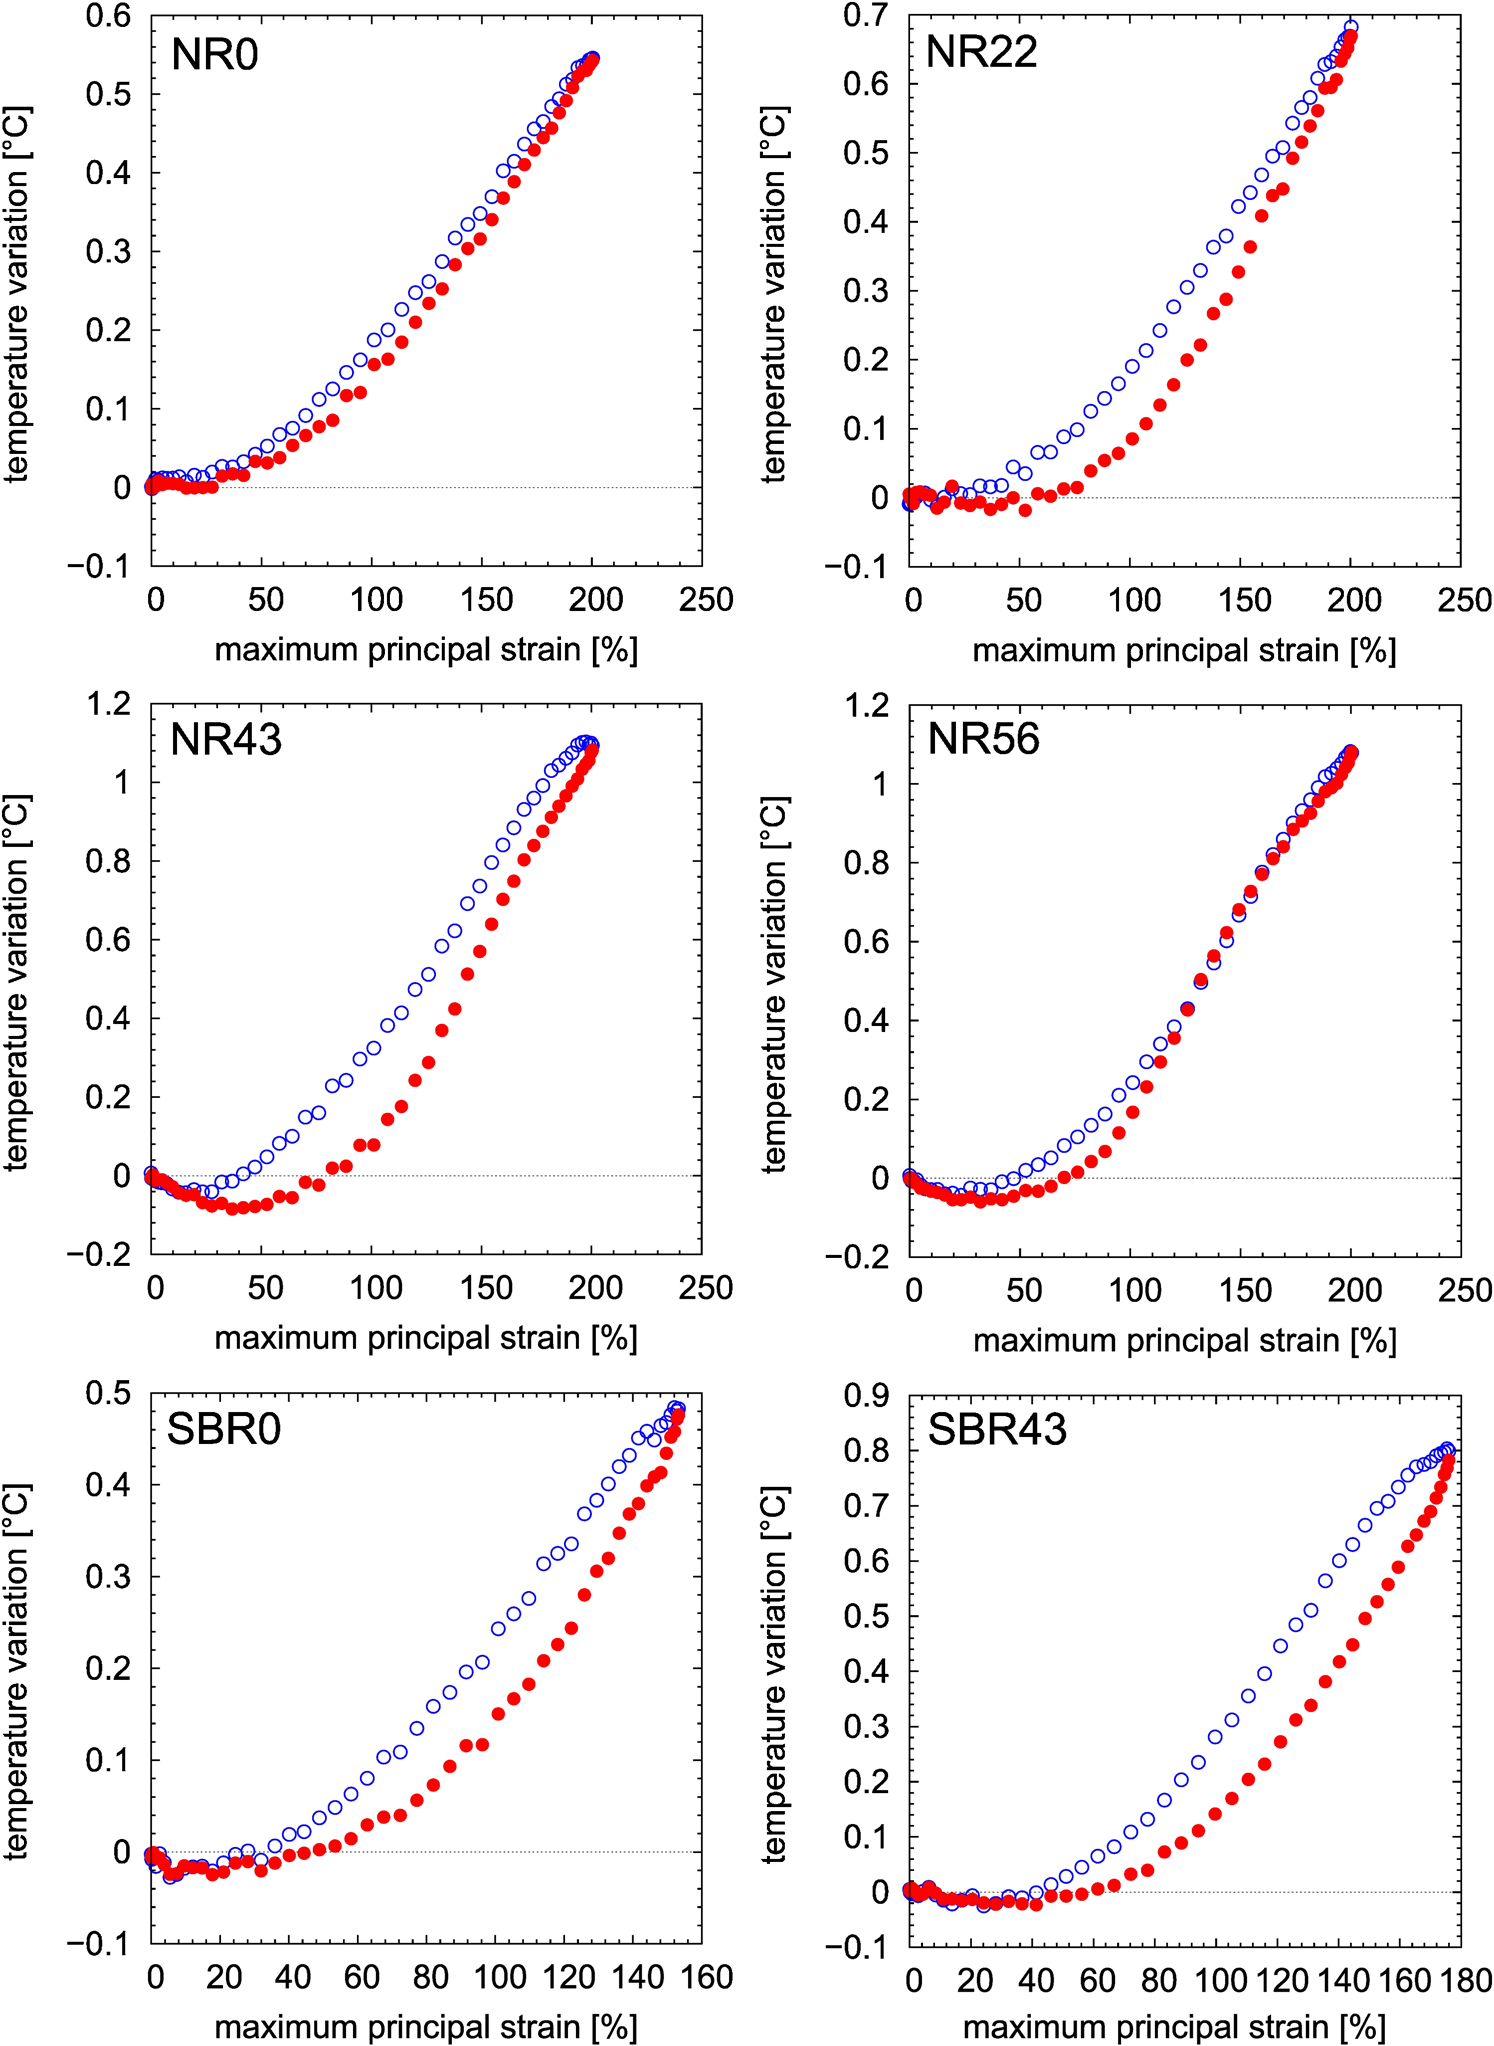
Evolution of temperature variations with local strain for different materials: unload curves are filled symbols
The first one is the fact that all the compounds exhibit a lack of reversibility between the loading and unloading curves. Moreover, the increase in the thermal hysteresis is well correlated to the increase in the carbon black content, which is consistent with the increase in the mechanical hysteresis. This changes between the loading and unloading thermal response have already been observed 8 and explained by strain induced crystallisation.3, 8 This is not the only explanation here, as this difference is observed for non-crystallising compounds as well as for crystallising compounds tested under the minimum strain needed to detect crystallisation (evaluated to 300% by Marchal 16 for unfilled natural rubber).
Another interesting idea would therefore be to analyse the thermal response, not according to the strain, but to the stress, in order to check if the thermal loading and unloading curves could be unified. This is not an easy task in the present case as the sample geometry is complex. Nevertheless, a first attempt could be performed by assuming that the central section, for which the temperature evolution is measured, is submitted mainly to uniaxial tension. The hysteretic data coming from a classical uniaxial test performed for the same range of deformation could therefore be used to analyse the thermal hysteresis measured in the central section. These two curves are given in Fig. 7.
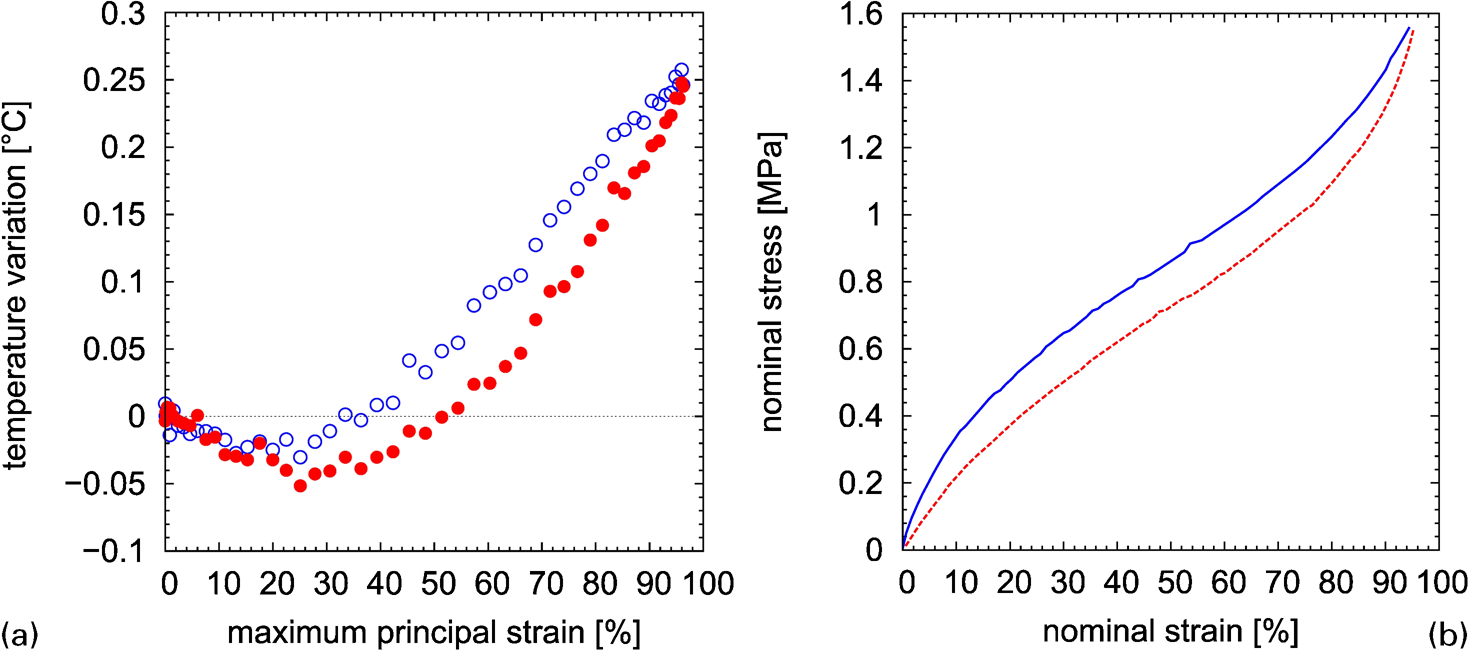
Comparison of hysteretic loop observed on a thermal and b mechanical responses
If we now use the loading and unloading curve of the tensile test to plot the evolution of the temperature variation versus the tensile stress, it can be observed in Fig. 8 that no more thermal hysteresis is to be seen. As underlined previously, this is not a definitive proof and further investigations are needed to assess this idea.
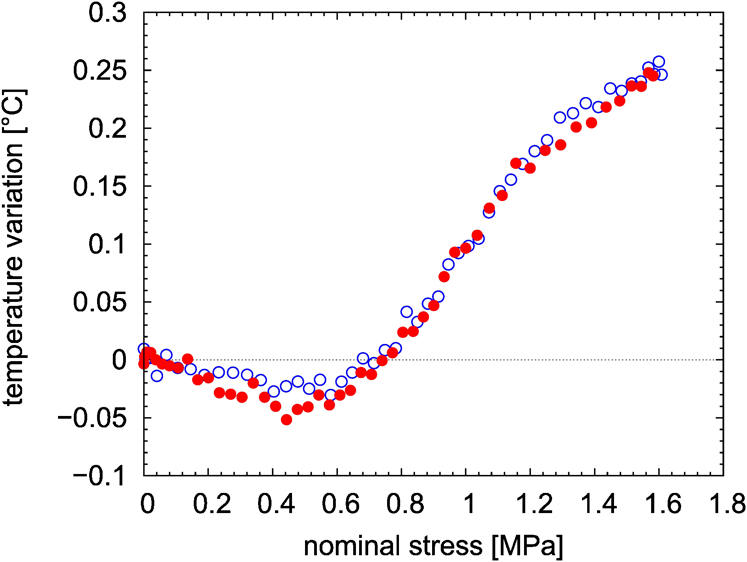
Evolution of temperature variation versus evaluated nominal stress in central section
The second observation deals with the shapes of the loading and unloading curves. If they seem comparable for SBR and NR0 compounds, one can see in Fig. 6 a clear inflexion of the thermal response during the unloading step for the NR56 and 43 compounds, which is also detectable on the NR22 compound. This effect can be attributed to crystallisation under strain that gives rise to the evolution of a latent heat. 3
To investigate this interpretation, the influence of the maximum strain on the shape of the loading and unloading curve is described in the following. Figure 9 shows the evolution of the temperature variation for the natural rubber compounds. For the sake of clarity, only three different loading cases per compound are presented. This figure illustrates that the inflexion point on the unloading curve observed previously is observed systematically, as soon as a given strain is reached. When the strain is high enough, the unload curve can even get higher than the loading curve, which has been already observed by Dart and Guth. 8
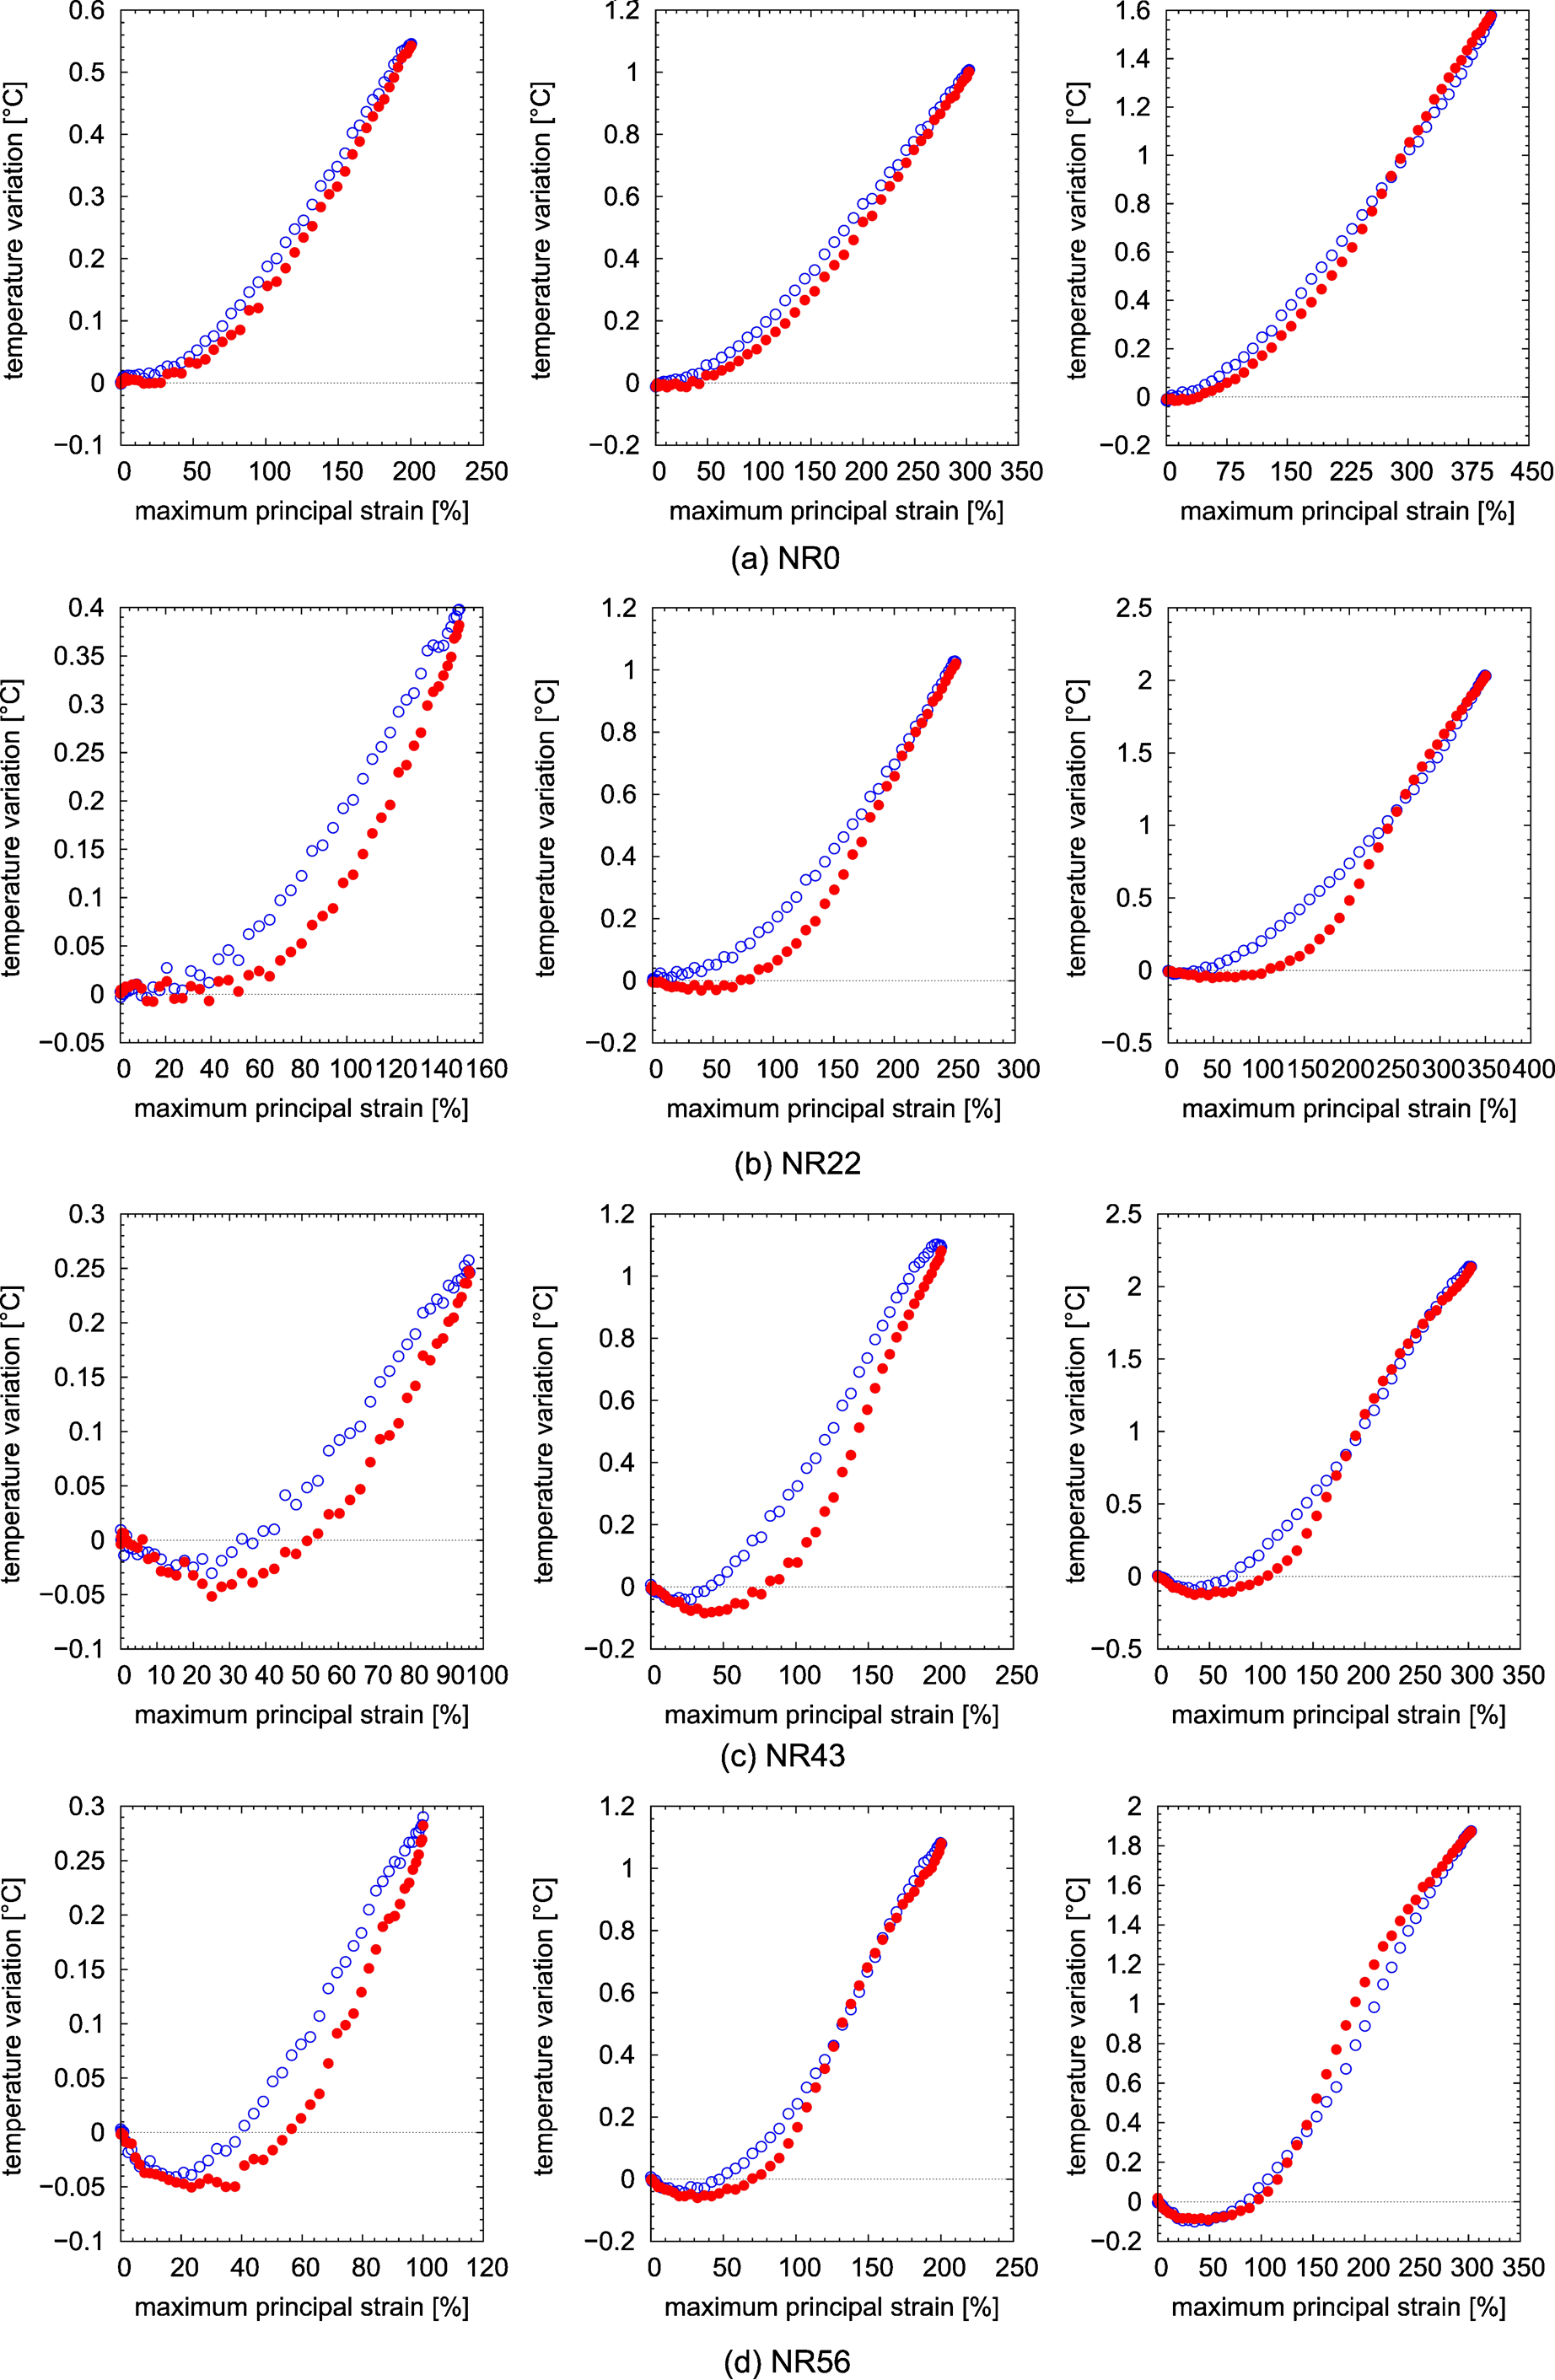
Evolution of thermal responses with maximum strain for crystallisable compounds
These observations are clearly pleading for an explanation based on crystallisation. To further analyse these data, it seemed relevant to compare the minimum strain needed to observe an inflexion of the unloading curve to the so called deformation threshold, i.e. the minimum strain needed to observe a partial crystallisation of the material. The data are issued from the literature, more specifically from Marchal's PhD thesis. 16 The methodology employed to identify the deformation threshold from her results is presented in Fig. 10.
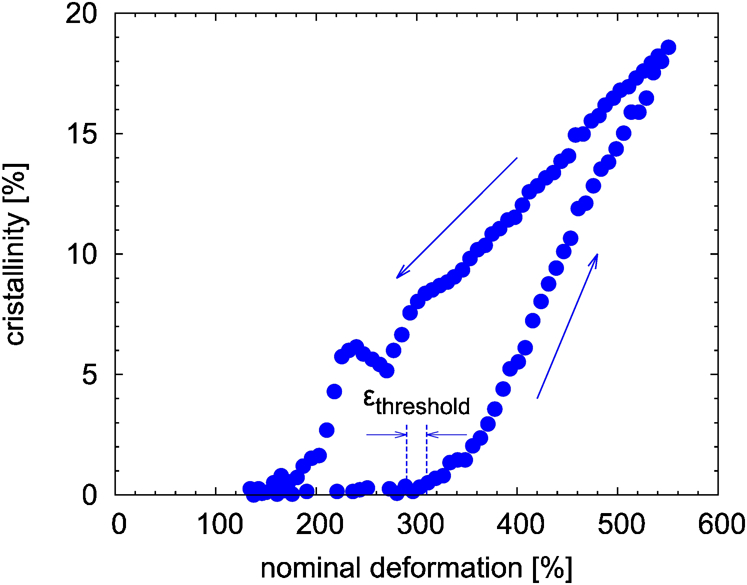
Illustration of identification of deformation threshold from X-ray measurements (data from Marchal 16 )
It is worth noting that both Marchal 16 and Chenal et al. 17 showed a dependency of the crystallisation under strain to the number of cycles. The main consequences of this phenomenon is a slight increase in the deformation threshold with the number of cycles until a stabilisation is reached (typically 3–5 cycles according to their results) and a reduction of the crystallinity for a given strain, in other words, a shift of the crystallinity curve (Fig. 9) to the right. However, the influence of the number of cycles is low enough to allow the comparison between our result (obtained after stabilisation of the Mullins effect) and the Marchal's ones (obtained on the first load).
As illustrated in Fig. 11, a fairly good agreement between both approaches is found for all the compounds. Moreover, the reduction of the crystallisation threshold with the rise of the carbon black content is also correctly captured. These results validate the detection of the crystallisation strain threshold from careful thermal measurements. The next step to quantify the crystal amount seems also possible but clearly calls for further investigation and modelling.
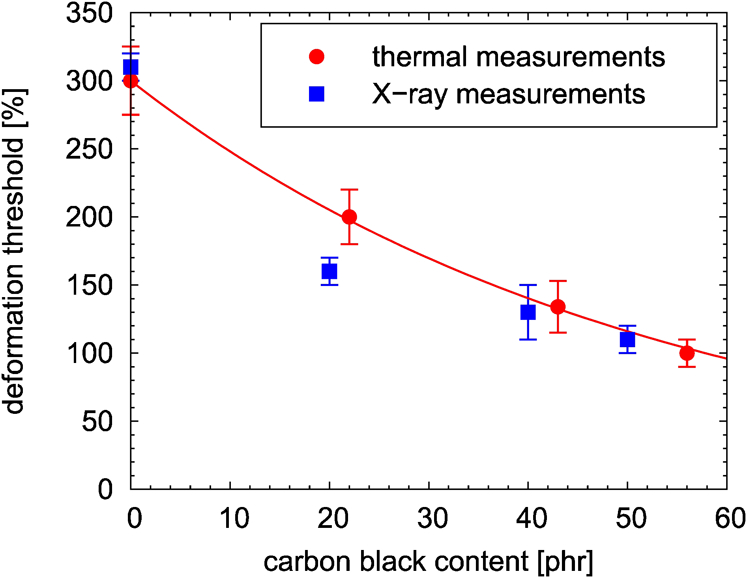
Dependency of deformation threshold to carbon blacks content: X-ray measurements come from Marchal 16
Conclusions
In this paper, a specific protocol was applied to measure the reversible variation of temperature during cyclic loading. The experimental care on the thermal measurements and on the device calibration allowed for a good temperature resolution. This protocol was applied for various loading amplitudes to crystallising and non-crystallising compounds, for several contents of carbon blacks. Several specific features of elastomeric materials have been highlighted: the evolution of the thermoelastic inversion with the maximum strain reached during the cycle, the fact that the thermal hysteresis under cyclic loading is coming from mechanically induced crystallisation but also from the mechanical hysteresis, and finally, the detection of the crystallisation threshold, well correlated with data coming from X-ray measurements. The perspectives of this work are of course numerous, ranging from a better testing protocol in order to dissociate the influences of the Mullins effect from a possible permanent set, to a stress based analysis of the thermal curves rather than the classical one based on strain and to the modelling of mechanically induced crystallisation in order to evaluate the amount of crystals from thermal measurements.
Footnotes
Acknowledgement
The authors would like to thank Dr Cédric Doudard from École Nationale Supérieure de Techniques Avancées (ENSTA) Bretagne for helpful discussions on infrared thermography. This work was originally presented in: S. Jerrams & N. Murphy (eds), Constitutive Models for Rubber VII. 2012 Taylor & Francis Group, London, UK and subsequently peer-revised and extensively revised for publication in Plastics, Rubber and Composites: Macromolecular Engineering.