
Abstract
Hollow carbon black (HCB) is introduced in this work. It has a special hollow structure, high specific surface area, high structure and high electric conductivity. Hollow carbon black is used to fill styrene–butadiene rubber (SBR). The bound rubber test results show that the bound rubber of SBR/HCB can be measured when the HCB content reaches 25 phr because a strong filler network is formed, which indicates good electric conductivity of SBR/HCB. In comparison, the bound rubber of SBR/N330 can not be measured even when the N330 content is 40 phr. The mechanical measurements show that HCB has very good reinforcing effect on SBR especially when the filler content is low. The electric conductivity and thermal conductivity increase with the increase in filler content. At the same filler content, the properties of SBR/HCB nanocomposites are better than those of SBR/N330 nanocomposites, which suggests that HCB has good application potential.
Keywords
Introduction
It is well known that elastomers become more and more important and are widely used in the tyre industry. However, because of the big free volume and low intensity of elastomers, they generally need to be strengthened by nanofillers.1–4 As a result, it is important to develop novel nanofillers for elastomer applications. Traditional nanofillers are carbon black and silica, which can significantly improve the mechanical properties of elastomers.5–7 These fillers will play a very important role in the rubber industry for a long time. However, their applications and service life are limited by their high density, low functional properties and poor electric and thermal conductivity. The accumulation of static electricity and dynamic heat will adversely affect the performance and useful life of rubber products used under dynamic conditions. Nanofillers with good electric and thermal conductivity can reduce the accumulation of static electricity, dynamic heat and temperature gradient to minimise or eliminate internal frictional heating and heat concentration.
However, lightweight and functional nanofillers have rarely been reported.8 In this study, we investigated a special carbon black named hollow carbon black (HCB), which is produced by No. 2 Fertilizer Factory of Qilu Petrochemical Company Co., Ltd (China). Hollow carbon black is a byproduct of the gasification of vacuum residue in Rochelle furnaces and has the following fundamental performance parameters: hollow structure (low density), particle size of 33 nm, high specific surface area (Brunauer–Emmett–Teller surface area, 1080 m2 g−1; cetyltrimethylammonium bromide surface area, 828 m2 g−1; and iodine adsorption, 944 mg g−1), high structure [high n-dibutyl phthalate (DBP) absorption value, 5·86 mg g−1] and good conductivity (specific resistance, 0·27 Ω cm).9 In this work, the structure and morphology of HCB were investigated. Hollow carbon black was then used to fill styrene–butadiene rubber (SBR). The effects of HCB on the mechanical properties and the electrical and thermal conductivity of SBR were studied in an attempt to provide a basis for the preparation of novel rubber/HCB nanocomposites.
Experimental
Materials and formula
Styrene–butadiene rubber (SBR-1502, supplied by Jilin Chemical Industrial Co., Ltd, China) 100 (parts by weight, the same below), zinc oxide 5, stearic acid 2, accelerator D 0·5, accelerator DM 0·5, accelerator TT 0·2, antiager 4010NA 1, sulphur 2, HCB (supplied by No. 2 Fertilizer Factory of Qilu Petrochemical Company Co., Ltd, China) variable and carbon black N330 (from Tianjin Dolphin Carbon Black Co., Ltd, China) variable were used.
Sample and testing
The samples investigated in this study were composed of SBR-1502 compounded with different amounts of HCB and N330. The rubber and fillers were mixed on an open two-roll laboratory mill. Curing characteristics of the obtained compounds were determined by an oscillating disc rheometer (ODR) at 150°C, according to ASTM D2084. Then, the compounds were vulcanised at platen press with 15 MPa pressure at 150°C for the optimum cure time T90, according to the ODR results.
Scanning electron microscopy (SEM)
A scanning electron microscope (Hitachi S-4700, 20 kV) was used to examine the HCB particles and the fracture surfaces of SBR/HCB vulcanisates. The particles were bonded to conductive adhesive for the test, and vulcanised rubber samples were prepared by freeze fracture in liquid nitrogen. All the samples were gold plated before the test.
High resolution transmission electron microscopy (HRTEM)
The morphology of the HCB particles was examined by a JEM-3010 high resolution transmission electron microscope. The particles were dispersed in acetone by ultrasound, and then a drop of the dispersion was put on a copper grid for testing.
X-ray diffraction (XRD)
The XRD was carried out using a diffractometer (D/Max-III C; Rigaku, Japan), with Cu K radiation operating at 40 kV and 200 mA. The scanning range was from 2θ = 5° to 40°.
Bound rubber test
To test the bound rubber, the uncured SBR/HCB compound, after being placed at room temperature for at least a week, was cut into small blocks ∼1 mm3. The sample (0·5±0·0025 g) was weighed (M1) and packed by a copper mesh through which the linear rubber molecules could permeate but the rubber gel could not. The packed sample with the copper mesh was weighed (M2) and put into a sealed flask containing 100 mL of benzene at room temperature for 24 h. The benzene was replaced by 100 mL of fresh benzene, and the samples were kept in contact with the benzene for four more days. The sample with the copper mesh was dried in an air oven at room temperature for 24 h and then in a vacuum oven at room temperature for another 24 h. The dry sample with the copper mesh was weighed (M3), and the bound rubber content BR (%) was calculated according to the following equation
Transmission electron microscopy (TEM)
The TEM observations were performed on ultrathin sections of the samples with an H-800 transmission electron microscope (Hitachi, Japan) at an acceleration voltage of 200 kV at room temperature. The ultrathin sections were prepared with a cryo-ultramicrotome under liquid nitrogen cooling.
Tensile and abrasion properties
Tensile tests were carried out on a CMT4104 electronic tensile tester (SANS, Shenzhen, China) according to ASTM D638. Abrasion tests were carried out on a MZ-4061 Akron abrader (Jiangdu Mingzhu Testing Machine Factory, Jiangdu, China) according to Chinese standard GB 1689-1989. For each abrasion test sample, at least two specimens (213·5×12·7×3·2 mm) were tested to give the average value.
Volume resistivity test
Determination of the conductive properties of the vulcanised rubber was carried out by a DC bridge tester (QJ84; Shanghai Zhengyang Instrument Factory, China). The volume resistivity ρv was calculated from the volume resistance R according to the following equation

Thermal conductivity tests
The thermal conductivity of the vulcanisates was measured at steady state by a FOX50 heat flow meter from Laser Comp., Inc., USA. The specimen was wafer shaped, 51 mm in diameter and 6 mm in thickness, and was placed between two flat isothermal plates maintained at two different temperatures: 20 and 40°C. After the uniform temperature field was established, the thermal conductivity of the specimen was then measured.
Result and discussion
Analysis of structure of HCB
A filler has a great influence on the processing and performance of rubber and composite materials.10 The particle size, structure and surface activity are the most important factors determining the effectiveness of a filler. The HCB used in this study is a lightweight, high surface area and high structure filler with good electric conductivity, strongly suggesting that the mechanical properties, abrasion resistance and electric conductivity of the SBR can be improved by this new filler.
Morphology of HCB
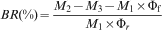
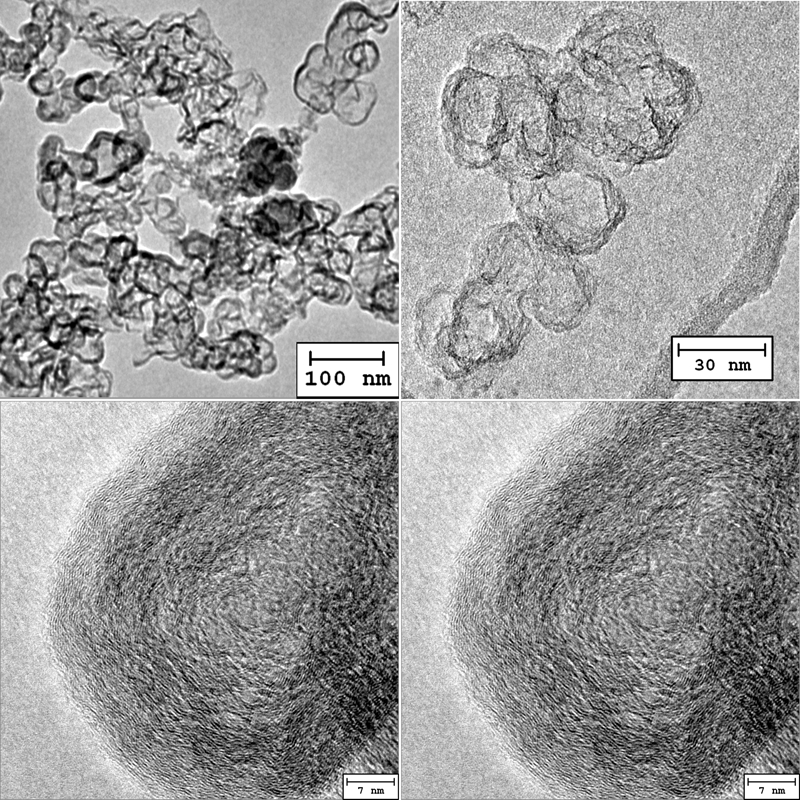
The particle size of a filler is the most important factor in rubber reinforcement.1, 2 High resolution TEM and SEM were used to observe the primary particle size, structure and morphology of the aggregates and agglomerates of HCB particles. The HRTEM images of HCB are shown in Fig. 1, and for comparison, the HRTEM images of N330 are shown in Fig. 2. Figure 1 shows that HCB has an obvious hollow structure, the average primary particle size of HCB is ∼30 nm, the shell thickness is ∼6 nm and the surface is rough and has a gully structure. The aggregates contain more than a dozen primary particles and have a branch chain structure and certain aspect ratio, and the ‘capsule’ structure reported in the literature11 can be observed under high magnification.
High resolution TEM images of HCB particles
High resolution TEM images of carbon black N330 particles
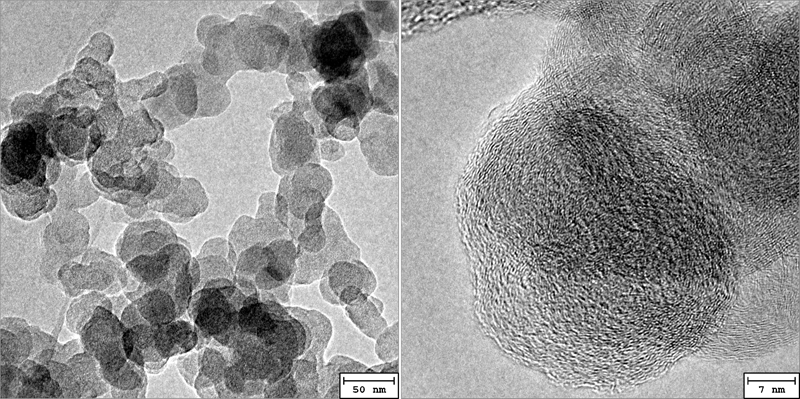
Figure 3 shows the SEM images of HCB. From this figure, we can see that the nanoparticles tend to reunite into microparticles during the storage process. We can also see the primary nanoparticles, the sphere shaped structure and the branch chain structure under high magnification.
Images (SEM) of HCB particles
X-ray diffraction analysis of HCB
Figure 4 shows the XRD patterns of HCB, carbon black N330 and graphite. From this figure, the distance between parallel graphite layers of HCB is 0·3498 nm, whereas the interlayer distances for carbon black N330 and graphite are 0·3663 and 0·337 nm respectively. The interlayer distance for HCB is between those for carbon black N330 and graphite, an indication that HCB has a certain degree of graphitisation during the production process, leading to good conductivity.
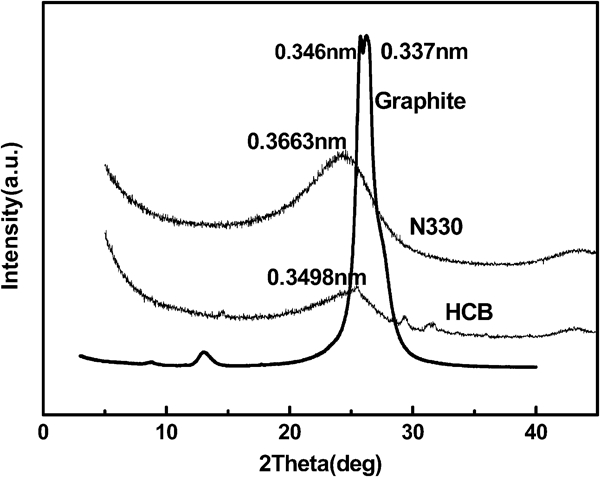
X-ray diffraction patterns of graphite, N330 and HCB
Analysis of structure of SBR/HCB composites
Bound rubber test
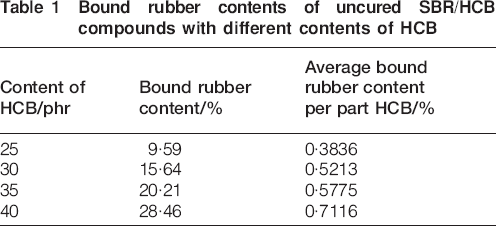
Figure 5 shows the photographs of the bound rubber test of the uncured SBR/HCB compounds with different filler contents. It can be clearly seen that the solutions in the bottles are black at filler contents <25 phr, which indicates that the fillers in the uncured compounds fluxed out the copper mesh. Under such conditions, we cannot get the bound rubber data, and the bound rubber test fails. The results of bound rubber content of the compounds with filler contents of ⩾25 phr can be found in Table 1. With increasing filler content, the bound rubber content increases gradually, an indication that the bound rubber content is related to not only the interaction between filler and rubber but also the filler network.12–15 At low filler contents, the number of particles in the rubber matrix is small, and the distance between particles is long. Although a rubber chain can be adsorbed on a single particle, the filler particles can flux through the copper mesh because the filler network is weak. As a result, the bound rubber content cannot be measured. As the filler content increases, the distance between particles decreases. One rubber molecular chain may be adsorbed on the surface of several particles, and a strong filler network is gradually formed because of the ‘holding’ effect of the rubber chains. Therefore, the complete filler network contains many occluded rubber chains, which cannot pass through the copper mesh, and the bound rubber data can be obtained. The average bound rubber content per part of filler (by weight) was also calculated and is presented in Table 1. The average bound rubber content per part of filler increases with the increase in filler content. This increase in bound rubber content indicates that the filler network at high filler contents favours the formation of bound rubber. Figure 6 illustrates the bound rubber test of the SBR/N330 compound with 40 phr N330. The black bottle is the evidence that even at an N330 content of up to 40 phr, we still cannot get the bound rubber content. These bound rubber test results clearly show that HCB has a higher structure than N330, and the stronger filler network in SBR/HCB compounds indicate the better electric conductivity of SBR/HCB nanocomposites than that of SBR/N330 nanocomposites.
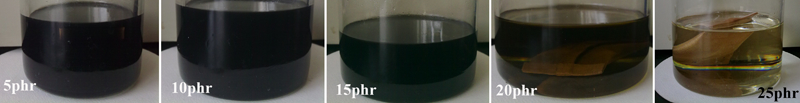
Photographs of bound rubber content test of uncured SBR/HCB compounds with different amounts of HCB
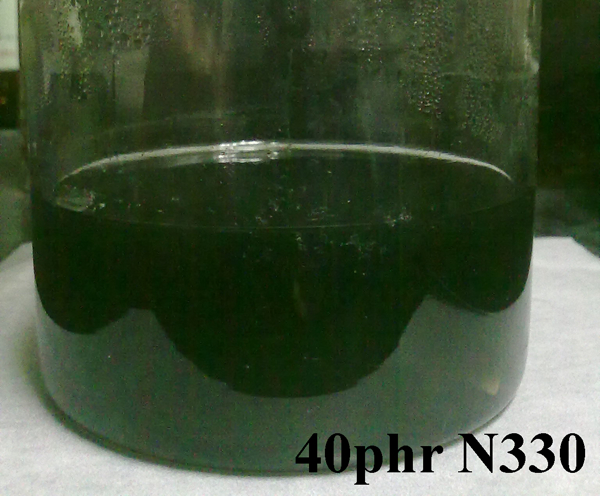
Photograph of bound rubber content test of uncured SBR/N330 compound with 40 phr N330
Bound rubber contents of uncured SBR/HCB compounds with different contents of HCB
Scanning electron microscopy images of SBR/HCB composites
Figure 7 shows the SEM images of SBR/HCB nanocomposites with different filler contents. The light coloured sphere particles are the HCB particles, and the dark portion is the rubber matrix. From Fig. 7, it can be seen that HCB is nanodispersed in the rubber matrix at small HCB contents. However, the dispersion is not very uniform. Particle aggregates can be found in some areas and fewer particle aggregates in other areas, probably because there are some filler particles packed by rubber chains and are invisible as a result of the good interaction between HCB and the rubber matrix. When the filler content increases to 40 phr, the fillers are evenly dispersed in the rubber matrix, and a strong filler network can be seen.
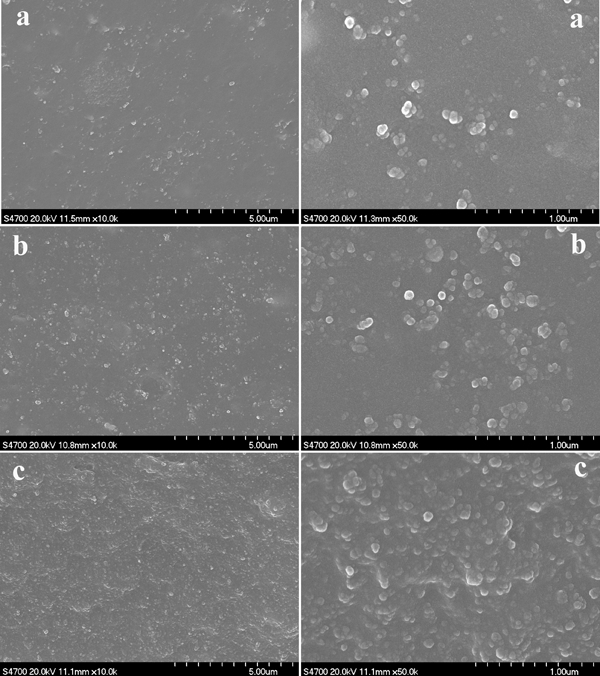
Images (SEM) of SBR/HCB nanocomposites with different HCB contents
Transmission electron microscopy images of SBR/HCB composites
Transmission electron microscopy images of SBR/HCB nanocomposites with different filler contents are shown in Fig. 8, in which the small dark spheres are the HCB particles, and the light coloured portion is the rubber matrix. The high dispersion and the clear hollow structure of the HCB particles can be seen under high magnification. At a filler content of 40 phr, the particles tend to aggregate.
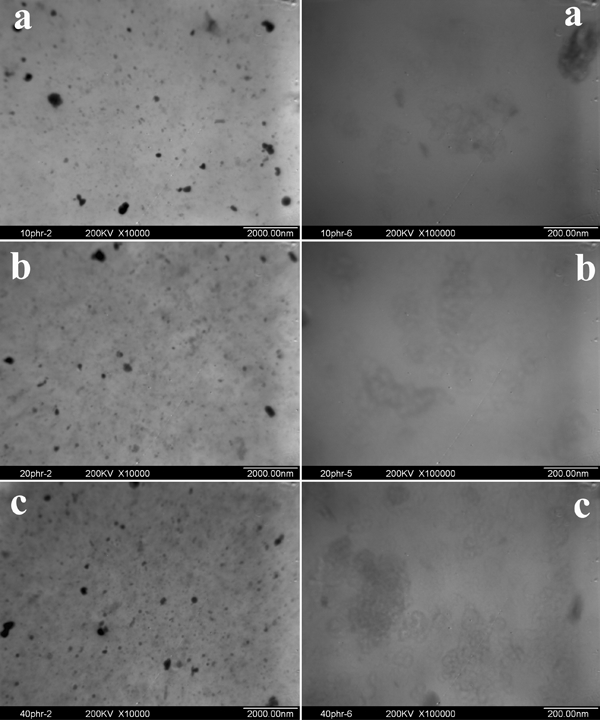
Images (TEM) of SBR/HCB nanocomposites with different HCB contents
Properties of vulcanisates
Mechanical properties
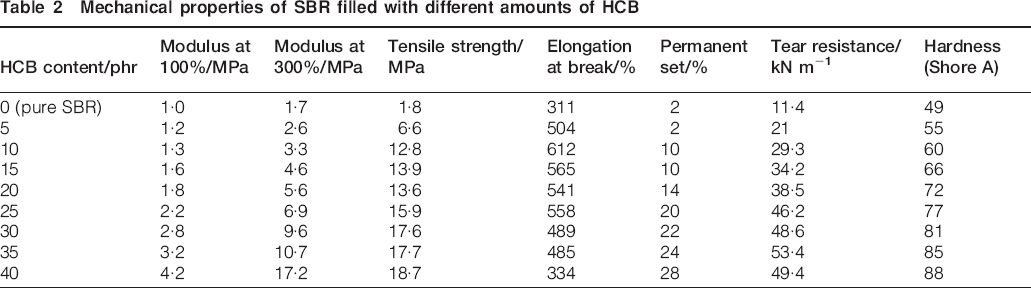
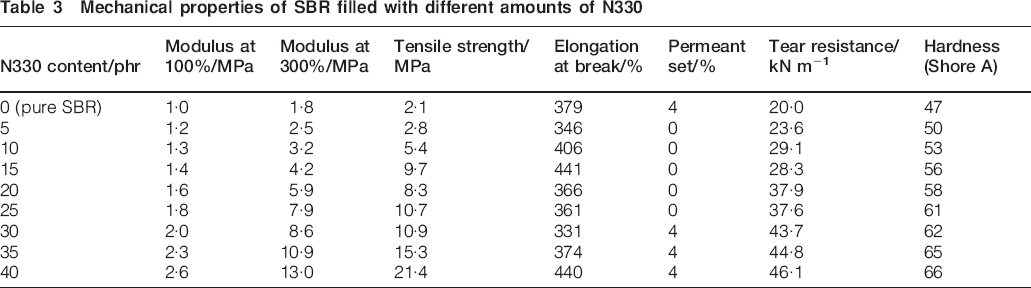
The mechanical properties of SBR/HCB and SBR/N330 composites are shown in Tables 2 and 3 respectively. The addition of a filler (HCB or N330) increases the mechanical properties of the nanocomposites, such as modulus at 100% elongation, modulus at 300% elongation, tensile strength, elongation at break and tear strength, over those of pure SBR. The mechanical properties of HCB/SBR nanocomposites are significantly improved even at low filler contents. For example, the tensile strength at 5 phr of HCB and that at 10 phr of HCB are three times and six times respectively higher than that of pure SBR. With further increases in the HCB content, the tensile strength increases further, but at a lower rate. At high filler content (40 phr), the composite shows very high modulus, as the fibre does at small strains.
Mechanical properties of SBR filled with different amounts of HCB
Mechanical properties of SBR filled with different amounts of N330
The elongation at break is significantly improved at low HCB contents, an indication of high reinforcement performance of the filler. The permanent set increase is caused by the destruction of the filler network and irreversible slip between the polymer chains and the surface of filler particles. The improved filler network with the increased filler content leads to the linear increase tend of the hardness.
Figure 9 compares the tensile strength curves of SBR/HCB and SBR/N330 nanocomposites. From Fig. 9, it can be seen that the tensile strength of SBR/HCB is higher than that of SBR/N330 at the same filler content, and the two tensile strength curves appear to cross at a filler content of ∼40 phr (corresponding to a volume fraction of ∼0·15).
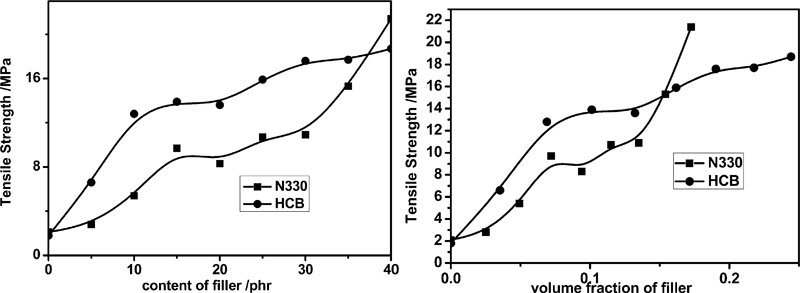
Tensile strength of SBR filled with different amounts of filler
Akron abrasion
Abrasion resistance is influenced by the hysteresis properties of the vulcanisates, magnitude of the frictional force and the resistance of rubber to rupture.16 This property is one of the important indicators of the performance and the use life of rubber products. The Akron abrasion loss, expressed as a volume loss, versus the filler content is given in Fig. 10. It can be seen that the Akron abrasion loss decreases sharply as the filler content increases to 15 phr and then decreases at a smaller rate with further increases in filler content. At the same filler content, the Akron abrasion loss of SBR/HCB nanocomposites is lower than that of SBR/N330 nanocomposites.
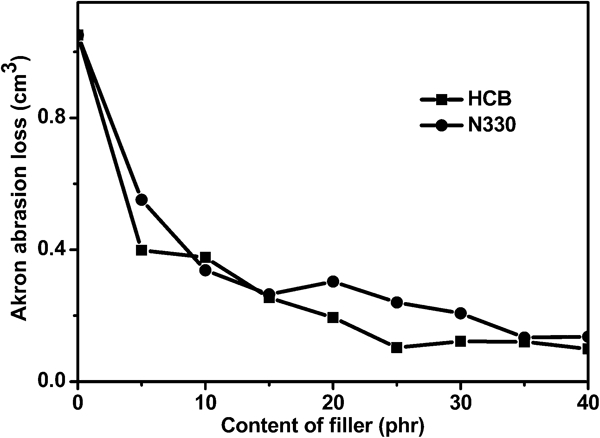
Akron abrasion loss versus filler content
Electrical conductivity
A rubber filled with special carbon black with high porosity and small particle size has a high electrical conductivity.17 At the same filler content, the distance between porous particles is smaller than that between solid particles. A kind of carbon black named Ketjenblack EC with high conductivity18 as a result of the hollow structure of the particles was reported. The HCB investigated in this study also has a typical hollow structure and high DBP absorption value; it can be inferred from the results on Ketjenblack EC that SBR/HCB composites have good electrical conductivity.
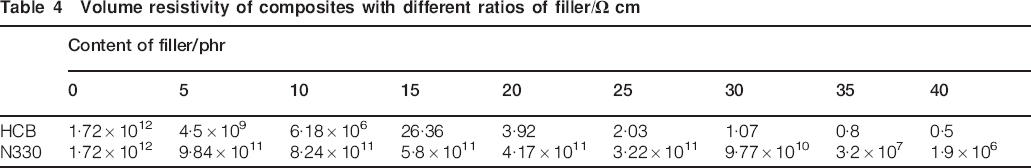
Table 4 shows the volume resistivity of SBR/HCB and SBR/N330 nanocomposites with different filler contents. With the increase in filler content, the volume resistivity of the nanocomposites decreases. As the filler content reaches 15 phr, the composites with HCB are changed into conductor, the volume resistivity of SBR/HCB decreases to 26·36 Ω cm and SBR/HCB changes into conductor. At the same time, the carbon black particles or aggregates form a three-dimensional conductive network, with distance between the particles being negligibly small. At an HCB content of 40 phr, the volume resistivity of the composite declines to 0·5 Ω cm.
Volume resistivity of composites with different ratios of filler/Ω cm
Since HCB has a hollow structure and its density is lower than that of solid N330, the volume resistivity of filled SBR versus the content of filler and the volume fraction of filler are shown in Fig. 11. It can be seen from Fig. 11 that the volume resistivity of SBR/N330 nanocomposites is significantly higher than that of SBR/HCB nanocomposites at the same filler content and the same filler volume fraction. What is more, we cannot even see the percolation point of SBR/HCB nanocomposites. With the addition of HCB to SBR, the volume resistivity declines sharply until the volume fraction reaches 10%, and then the decrease rate slow down and the volume resistivity decreases gradually to a stable value. For the SBR/N330 nanocomposites, the percolation point of volume resistivity is at a volume fraction of 10%. The volume resistivity remains in a downward trend at 18% volume fraction of N330. Accordingly, the conductivity of SBR/HCB is higher than that of SBR/N330.
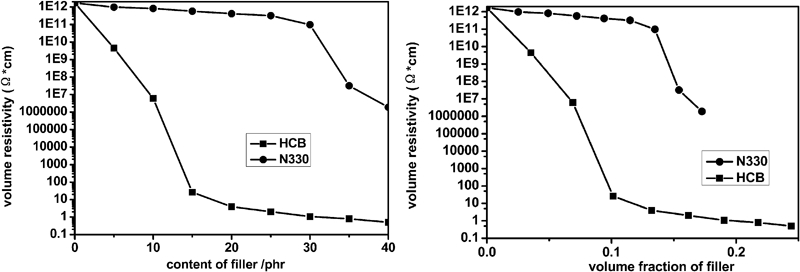
Plots of volume resistivity versus volume fraction of filler for SBR/HCB and SBR/N330
Thermal conductivity
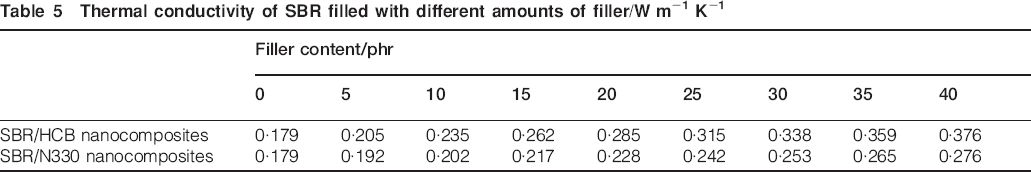
As mentioned in the literature,19 there is a correlation between the structure of carbon black as characterised by DBP absorption value and the thermal conductivity: the thermal conductivity of high structure carbon black is higher than that of low structure carbon black. The electric furnace black has a high structure and high electric conductivity, but its thermal conductivity is not high because of the porous structure, which is heat insulating. The HCB used in this study has a hollow structure, but it has a higher thermal conductivity than the solid carbon black N330, as shown in Table 5 and Fig. 12. The explanation for the high thermal conductivity of HCB is still not clear and needs further research. From Fig. 12, it can be seen that the thermal conductivity of the composites increases linearly with the increase in filler content for both fillers.
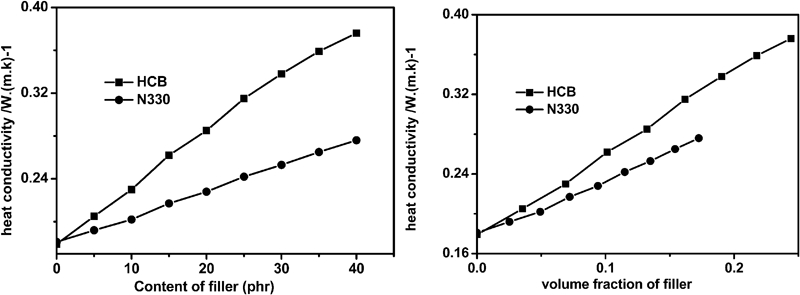
Thermal conductivity versus filler content for SBR/HCB and SBR/N330
Thermal conductivity of SBR filled with different amounts of filler/W m−1 K−1
Conclusions
Compared with the traditional carbon black N330, the HCB introduced in this study has a special hollow structure, high specific surface area, high structure and high electric conductivity. The SBR/HCB nanocomposites can be obtained by the traditional method on a two-roll mill. As HCB possesses a hollow structure (low density) and a high structure (high DBP adsorption value), the filler network in the rubber matrix gradually completes with the increase in the HCB content, the bound rubber can be measured when the HCB content reaches 25 phr and the mechanical properties and conductivity of SBR/HCB nanocomposites can be improved. What is more, the composites have a significant increase in performance from pure SBR when the HCB content is low. The abrasion volume loss and the volume resistivity decrease with increasing HCB content. The SBR/HCB nanocomposites change into conductive materials when the filler content reaches 15 phr. The thermal conductivity of the composites increases linearly with the increase in filler content. The tensile strength, thermal conductivity and electrical conductivity of SBR/HCB nanocomposites are better than those of SBR/N330 nanocomposites at the same filler content. Based on the above results, HCB has potential applications in the tyre tread area.