
Abstract
The deformation induced stress softening strongly influences the material behaviour of the filled rubber and is a very complex issue. For the description of the anisotropic Mullins effect, there is still a lack of suitable experimental data. For this purpose, experiments with carbon black filled chloroprene rubber (CR) were carried out using multiple load steps. After repeated stretching in the same direction, a subsequent first loading in any other direction is characterised by a different stress–strain behaviour compared to the stabilised curve of the previous load. In order to emphasise the influence of the secondary loading direction on the material behaviour during that loading process, characteristic values are defined.
Keywords
Introduction
The mechanical behaviour of filled rubber is characterised by the fact that the quasi-static stress–strain behaviour changes after the initial loading. This stress softening depends distinctly on the deformation history and is well known as the Mullins effect for many decades now.1 The stress–strain function has its maximum value in the first cycle and reduces in the subsequent cycles till it reaches a stabilised state. Experimental results show that the Mullins effect at the same strain amplitude depends decisively on the filler content in the rubber compound.2
In rubber compounds, fillers are as important to the mechanical performance of the final product as the rubber polymers are. There are two networks, namely, the polymer network and the filler network. Besides the hydrodynamic reinforcement, filler/polymer and filler/filler (filler network) interactions have to be considered. The required properties such as higher stiffness, tensile strength and abrasion strength can be achieved using active fillers, like carbon black or silica. The size and structure of the filler particles (agglomerates) and the structure of the filler network have been studied in detail by many authors. Nevertheless, the micromechanical effects of the fillers on the stress softening and on the mechanical behaviour are not totally understood yet.
Furthermore, the direction dependence of the deformation induced Mullins effect can be observed. This anisotropic stress softening was first observed by Mullins and has been confirmed by many authors since then.3–6 The anisotropic Mullins effect cannot be detected by classical one-directional tensile tests. Hence, Mullins and Tobin3 and Pawelski5 used a large sample, which was prestretched in the first step. From this specimen, a smaller specimen was cut out in different directions and the stress–strain behaviour in those particular directions was measured. Besdo et al.7 confirmed the anisotropic stress softening by making use of a cylindrical specimen, which was subjected to shear in positive and negative directions.
In addition to that, the other authors have described the direction dependence of the Mullins effect and have developed many constitutive material models. In most cases, the description of the stress softening effect is referred to as the idealised Mullins effect. This means that the resulting permanent set and subsequent hysteresis are neglected. Recent research works consider the permanent set, which is very important, while considering the anisotropic Mullins effect.8, 9 Experimental results show that the direction dependent stress softening correlates significantly to the permanent set.10 In summary, the authors, dealing with this topic, have had limitations due to the lack of suitable experimental results till now. The authors have started an extensive study of the deformation induced anisotropy of the Mullins effect in cooperation with the Department of Continuum Mechanics (LF KM), Professor Itskov, at RWTH Aachen University. The research project of LF KM is to constitute material models based on micromechanical theory as well as models that are based on phenomenological theory.6, 11 Thus, to understand the influence of the micromechanical effects of the fillers on the anisotropic Mullins effect, suitable experimental results are required.12, 13
This paper describes experiments that aid us in understanding the deformation induced anisotropy of the stress softening properly. The main focus is on the observation of uniaxial stress–strain behaviour in different loading directions after the material has been softened beforehand in one direction. Simultaneously, the influence of the filler content on the direction dependent material behaviour is investigated. Moreover, suitable dimensionless values and a way of graphical representation are proposed in order to point out the anisotropic Mullins effect and the necessity of considering it in the dimensioning processes of rubber parts.
Experimental
Rubber material used for experimental tests
In this paper, chloroprene rubber (CR) with different concentrations of the filler content is used in order to study experimentally the deformation induced anisotropy of the Mullins effect. The composition of the rubber compound is specified in Table 1.
Recipes of chloroprene rubber
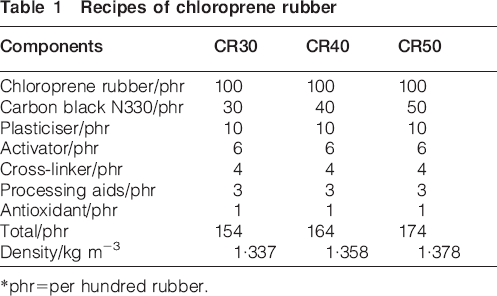
*phr = per hundred rubber.
The carbon black that is used is characterised by a small sized particle size and a medium structure (N330). The additional ingredients are not varied, and therefore, it is expected to have the same effect on the mechanical behaviour of the rubber compound. Their quantities are shown in Table 1. From these rubber compounds, square shaped test sheets of the dimensions of 200×200×2·0 mm are made by compression molding so that anisotropic effects caused by the production process can be excluded. The analysis of the uniaxial material behaviour using specimen that has been cut out in different directions from the virgin square shape sheets confirms that the production process related anisotropy can be neglected.
Carbon black filled CR exhibits a good oil, heat and weather resistance. It has good mechanical behavior, and thus, it is one of the widely used special rubbers. It is used in tubes, seals, sportswear, as well as in the automotive and electrical industry. One of the peculiar properties of CR is strain crystallisation. When the rubber specimen is stretched, the polymer chains are oriented along the loading direction. In strain crystallised rubbers, cross-links in the form of nanoscaled crystallite structures are built.14–16
Test set-up
The uniaxial tensile tests are performed on a spindle driven tensile testing machine Z010 (Zwick/Roell, Ulm, Germany) with a 1 kN load cell U2A (Hottinger Baldwin Messtechnik, Darmstadt, Germany). Pneumatic grips provide a constant clamping force of 6 kN, which avoids slipping effects in the clamping area in the course of the experiment. This ensures the precision of the measurement and the reproducibility. Additionally, pneumatic grips allow fast clamping and unclamping and minimise any unwanted effects, which can be a hindrance while performing multiple load steps.
Strain values are measured online and contactless by means of an optical measuring system. It tracks two points, which are previously marked on the specimen. In this way, an area at the centre of the specimen is measured, as this is the small area that is subjected to the pure uniaxial deformation. Non-contact measurement methods17 are preferred for the evaluation of the mechanical properties of rubbers because there is no change in stiffness due to the presence of a sensor. Non-contact measurement has been adopted to examine the deformation and mechanical behaviour of engineering materials.18, 19 The experimental results, which are referred to in this paper, are performed at room temperature and with a constant strain rate of 40% min−1.
Specimen shapes
The specimen used and the experimental design are based on the research work of Pawelski.5 A large rectangular specimen (dimensions excluding the clamping area, 150×50×2·0 mm) is uniaxially prestretched in the first load step, which is called the primary load step. Preliminary analysis shows that a minimum length/width ratio of 3∶1 is suitable for the uniaxial tension in the primary step. It acts as the uniaxial prestretching with constant strain amplitude in one direction. Then, the rectangular specimen is unclamped and a smaller S3A dumbbell is cut out from the prestretched material. These cutting out directions are varied to reveal the effect of the induced stress softening for different fiber orientations. The S3A dumbbell is cut out from the centre of the large specimen from the small area that is subjected to uniaxial deformation, and thus, its measurement range depends on this area. This smaller specimen is subjected to the same strain amplitude. In this secondary loading procedure, the dependence of the Mullins effect on the loading direction is clearly shown. Between the end of the primary load and the start of the secondary load step, only 2 min elapse; hence, the healing of the Mullins effect can be neglected.
Results
One-directional stress softening
In the first step, the CR50 (Fig. 1), which has high filler content, is investigated. It is proven that the Mullins effect is distinct in the rubber compounds with higher filler content. Therefore, an S1 dumbbell20 is cut out from the rectangular test sheet.
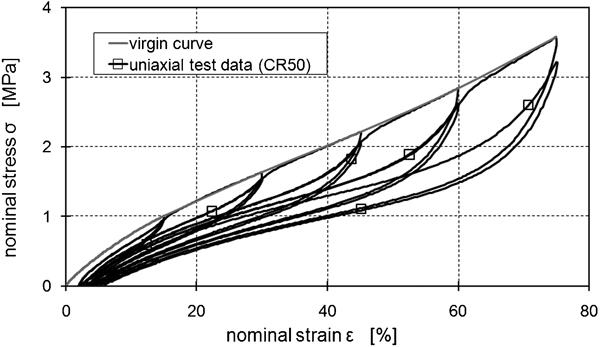
Uniaxial test results (CR50) by increasing strain amplitude
First, the specimen undergoes a uniaxial load and the strain amplitude is increased by 15% strain after the material behaviour is stabilised for the previous strain amplitude. In Fig. 1, the first and the stabilised loading and unloading curves for each strain amplitude are displayed. It shows the typical mechanical properties of rubber. With the increase in the strain amplitude, the stress softening amplifies, so that the Mullins effect depends on the maximum strain amplitude in the deformation history. Furthermore, higher strain amplitude increases the resulting permanent set. Additionally, the experimental results show that the quasi-static test is realised using very low strain rates. Nevertheless, the hysteresis effect cannot be totally avoided, and so the loading and the unloading curves can easily be distinguished.
The relative reduction of the deformation energy is determined in order to quantify the stress softening. Thus, the stabilised and the virgin curves for each strain amplitude are compared, and these values are referred to as the energy reduction (Fig. 2). The energy reduction observed here confirms that the classical Mullins effect depends distinctly on the strain amplitude.
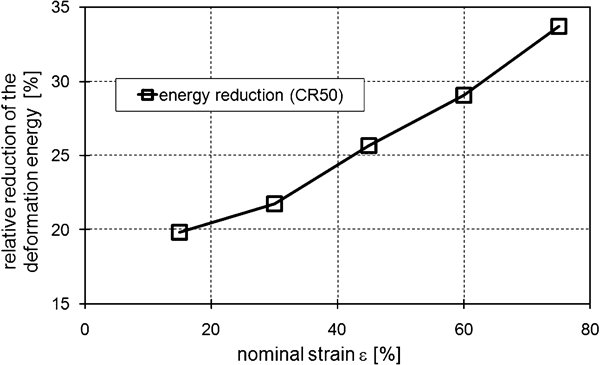
Reduction of deformation energy of virgin curve in comparison with stabilised curve for each strain amplitude
Observation of anisotropic Mullins effect in CR50
Using the same rubber compound (CR50), the anisotropic Mullins effect is studied. Therefore, the test shape described in the section on ‘Specimen shapes’ and the experimental design described in the section on ‘Test set-up’ are applied. The resulting test data for the rectangular shape and for the S3A shape in perpendicular direction (90° direction) are shown exemplarily in Fig. 3.
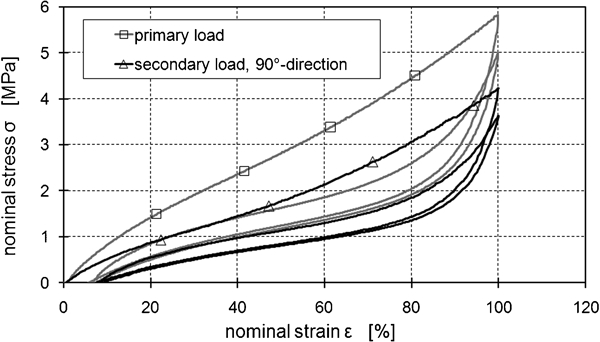
Stress–strain behaviour in 0 and 90° for identification of anisotropic Mullins effect (CR50)
The first loading curve in the new loading direction shows that the material behaviour in this direction deviates from the virgin material behaviour, as well as from the stress softened material behaviour. This means that after having passed through a primary load step, the rubber material behaves strongly anisotropic.
Furthermore, there is an additional stress softening caused by the first loading in the new direction, although in the previous primary load step, the Mullins effect had been induced completely. In this paper, the changes of the loading direction from 0 to 90° relating to the primary loading direction are reported. Similar to the section on ‘One-directional stress softening’, the relative reduction of the deformation energy is computed in order to analyse the direction dependence of the Mullins effect.
On one hand, the first curve of the secondary load step and the virgin curve (primary stress softening) and, on the other hand, the stabilised and the first curve of the secondary load step (secondary stress softening) are compared. Thus, the primary or anisotropic energy reduction and the secondary energy reduction are defined. The introduction of the deformation energies is necessary in order to point out the anisotropic Mullins effect. The deformation energies help us in comparing the stress–strain curves in different loading directions even though the permanent set that occurs due to the primary load step influences secondary loading distinctly.21
It should be noted that the testing machine does not consider the permanent set that occurred during the first loading step in the secondary loading results. That means that the new origin defined by the testing machine is afflicted by the permanent set, which occurs in the primary step. Hence, the permanent set must be computed analytically and must be included in the test data of the secondary load step in order to refer to the virgin origin. By means of continuum equations, the primary permanent set can be considered.
Therefore, let dX be an infinitesimal line element in the reference configuration and dx be its counterpart in the current configuration. Using the deformation gradient F leads to:

Then, it can be written as

For the uniaxial deformation, F has the entries only along the principal diagonal. Subsequently, the infinitesimal line element dX is represented as a function of the angle between the primary and the secondary loading direction
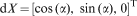
Considering the incompressibility condition, the angle dependent permanent set λres(α) is calculated as follows
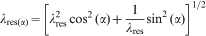
 is the angle dependent permanent set and
 is the primary permanent set.
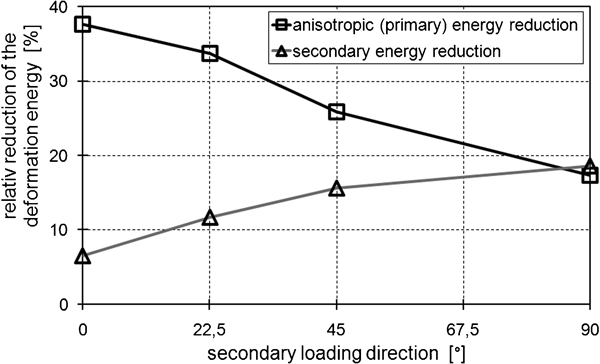
These equations of the continuum mechanics account for the direction dependent consideration of the permanent set. The detailed description can be found in Ref. 21. In Fig. 4, the energy reduction for each loading direction is presented. In the primary loading, the material is prestretched with 100% uniaxial strain.
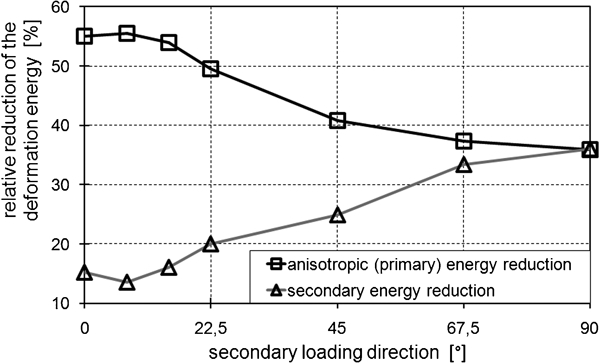
Stress softening of CR50 depending on direction of secondary load step (100% strain)
Results show that the anisotropic energy reduction decreases with increasing change in the angle of the loading direction. For the secondary energy reduction, an opposite correlation can be observed. The occurrence of the secondary stress softening in 0° direction is caused by the permanent set of the primary load step, which generates a higher strain amplitude in comparison to the primary loading.
Influence of filler content on direction dependent stress softening
In the previous chapter, the deformation induced anisotropy of the Mullins effect is clearly detected in highly filled CR (CR50) and its strong dependence on the loading direction is proven. At this point, the influence of the filler content on the anisotropic Mullins effect will be characterised. The test procedure remains unchanged. In Fig. 5, the primary (anisotropic) and the secondary energy reduction for 90° direction are shown.
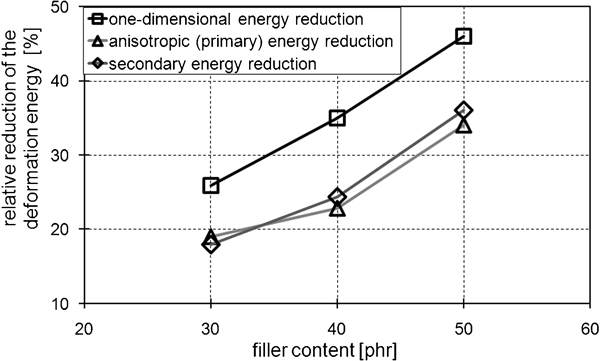
Influence of filler content on anisotropic Mullins effect in carbon black filled rubber (CR30 and CR40: 100% strain; CR50: 75% strain)
Similar to the classical one-dimensional Mullins effect, the filler content influences the direction dependent material behaviour. The anisotropic energy reduction increases with the increase in the filler content. Additionally, in the new direction, the induced secondary stress softening is interestingly more for the rubber compounds with higher filler content. A detailed observation of CR30 shows a similar correlation to the secondary loading direction (Fig. 6). The experimental results show that the more the changes in loading directions are, the lesser is the anisotropic energy reduction and more is the secondary energy reduction.
Stress softening of CR30 depending on direction of secondary load step (100% strain)
Qualitative characterisation of mechanical behaviour
In the previous chapter, the anisotropic Mullins effect has been quantified. Furthermore, suitable values are defined to characterise the influence of different loading directions and the influence of the filler content on the anisotropic phenomenon.
In the current chapter, the experimental results are displayed on the basis of the stretch surface, which is introduced in Refs. 21 and 22 in order to point out the deformation induced anisotropy (Fig. 7). Therefore, the first loading cycles of each load step are taken and the stretch λ is expressed in terms of the measured nominal strain ϵ

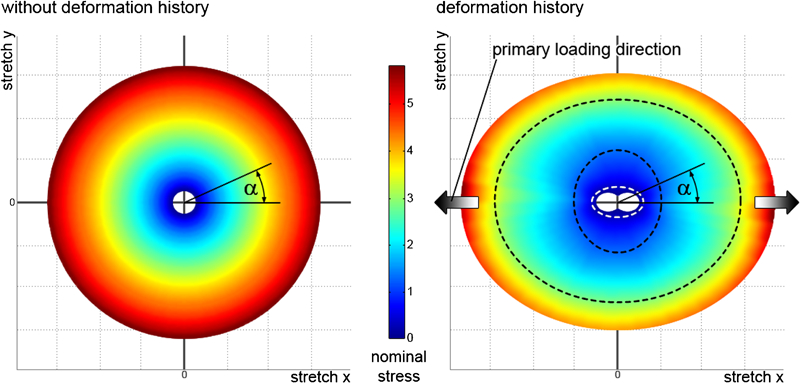
Virgin material behaviour in uniaxial tension (left) and occurring uniaxial material behaviour, after Mullins effect was induced in one loading direction (right), CR50
Later, the stretches converted direction dependently into the polar coordinates form, so that the distance from the pole represents the uniaxial deformation and the angle represents the loading direction. The related nominal stresses are expressed by means of a color map.
In the left figure, the measured stresses and stretches of the virgin material are displayed in a two-dimensional plane. In the section on ‘Rubber material used for the experimental tests’, preliminary studies on a virgin material show that anisotropic effects caused by the processing can be neglected. Therefore, it can be assumed that the material features the same stress/stretch behaviour in each loading direction; that is, it behaves isotropic. The small hole in the center of the graph illustrates the deformation state of the material if it is free of tension. This means that the virgin material is tensionless for the stretch value λ = 1 in any direction.
When the rubber-like material is softened in one direction, then the stretch surface is not circular anymore. The tensionless stretch surface contains the permanent set along the loading direction. Accordingly, in the perpendicular direction, the stretch is less than that for the tensionless state. Hence, the original circular form of the stretch surface now consists of two ellipses (Fig. 7, right).
Thus, the stretch surface for the first loading cycle of the secondary load step is of an elliptical form. The consideration of the primary permanent set in the secondary load step offsets and distorts the stress/stretch curves in different ways. With this illustration of the test results, the anisotropic material behaviour can be highlighted after it has undergone stress softening in the primary load step. After the material has been subjected to the primary loading, the same distances from the pole do not represent the same stresses. For the detailed examination of the colored stretch surface (stress/stretch data), a certain stress level is selected and the related distances (nominal stretches) in each angle (loading direction) are taken. This procedure is carried out for further stress levels. The dashed lines mark the respective stress levels. The orientation of the resulting elliptical dashed lines alters with the increasing stretches. At a small stress level, the stretches in the secondary direction increase with increasing angle. When the stress level is raised, an opposite relationship can be observed. For high stress levels related to the maximum stress of the primary step, the relationship changes again. Thus, it is emphasised that the S shape of the loading curves is strongly influenced by the previous loading direction. In summary, this graphic representation aids us in the comprehensive study of the characteristics of the stress–strain curves.
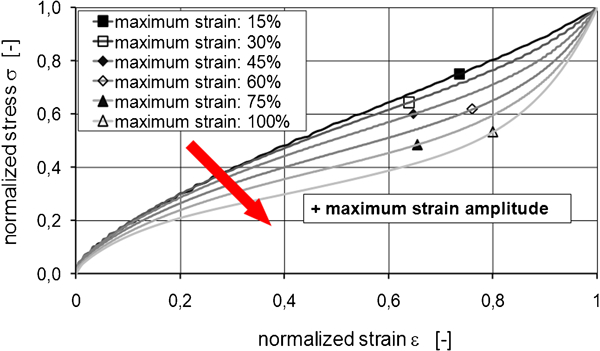
Therefore, the first loading cycles of the selected secondary loading directions are normalised. This means that the stress and strain measuring points are divided by the maximum stress and strain measuring points of the associated curve. The resulting normalised stress–strain curves are displayed in Fig. 8. It shows that the S shape becomes more prominent with the increasing change in the loading directions.
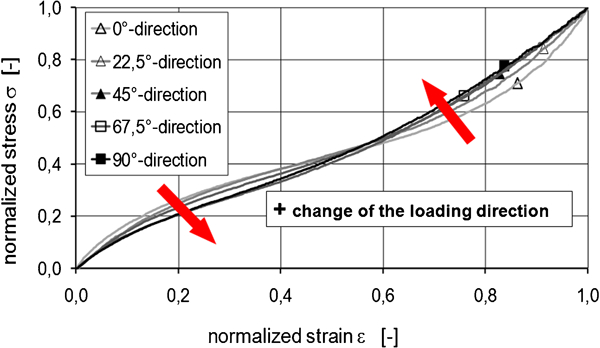
Normalised stress–strain behaviour for different secondary loading direction (CR50)
The same procedure is applied to the one-directional standard test results with different strain amplitudes in the deformation history. It should be taken into account that the loading curves of the standard test are afflicted with permanent sets and must be considered analytically. In order to do this, a procedure opposite to that of the section on ‘Observation of anisotropic Mullins effect in CR50’ was carried out. It is assumed that, when the softening process for the respective strain amplitude is completely induced, the specimen is unclamped and is clamped again. In this way, a new origin of the coordinate system and a new reference length are defined and the test data are not the same as those for the virgin material. Accordingly, the loading curves of the softened material have to be converted. Additionally, in Fig. 9, the new stress–strain curves are normalised. To characterise the S shape, the following equations are proposed
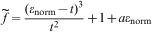
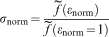
 is the polynomial function.
Normalised stress–strain curves for different maximum strain amplitudes (CR50)
The basis of this equation is a third degree polynomial function. To this function, a linear term is included, which contains one parameter. Subsequently, the polynomial function f is shifted in the field, in which the normalised stress–strain curves are placed. So, the proposed equation contains the parameters a and t. The parameter t describes the turning point and can be derived from experimental results. The parameter a results from fitting and characterises the curvature of the normalised stress–strain curve. When the value of a equates to zero, the curve behaves strongly S shaped. On the other hand, when the parameter a has a high value, then the curve has a linear behaviour.
In Fig. 10, the respective parameter a and the measured turning points (parameter t) are assigned to the related loading curves. Accordingly, in Fig. 11, the parameter a, depending on the maximum strain amplitude, is shown. This parameter reflects the S shape of a normalised stress–strain curve. On one hand, the parameter a drops with increase of the strain amplitude, and on the other hand, it grows with increasing change in the angle of the secondary loading direction. For the anisotropic study with CR30 (CR, 30 phr fillers), a similar correlation can be found. With regard to this function, it is important to note that the proposed equations have no physical relevance.
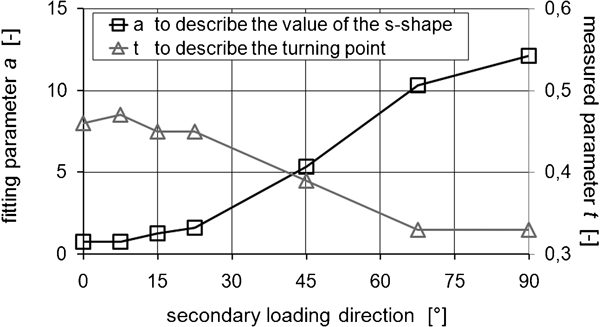
Parameters a and t for different loading directions with same primary strain amplitude (CR50)
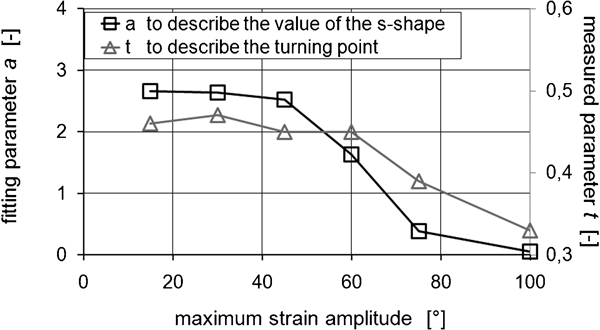
Parameters a and t for different strain amplitudes with same loading direction (CR50)
Conclusions
The quasi-static inelastic mechanical behaviour of carbon black filled rubber is characterised by the Mullins effect. Besides the maximum strain amplitude, the change of the loading direction in a secondary load step relating to direction of the previous load influences the stress softening effect. Hence, the materials investigated here show an anisotropic stress–strain behaviour after the initial softening of the material in one direction.
The first curve in a secondary loading direction distinguishes clearly from the virgin stress–strain curve and from the stabilised one in the primary loading direction. The determination of the required deformation energy for the first loading cycle in the secondary load step shows that this value grows with increasing change of the loading direction, and accordingly, the anisotropic energy reduction reduces.
Furthermore, an additional, secondary stress softening can be observed in the new loading direction. In contrast to the anisotropic energy reduction, the resulting secondary energy reduction grows with increasing change in the loading directions. Similar to the classical one-directional Mullins effect, the impact of the filler on the anisotropic (primary) and secondary Mullins effect is distinctly visible. Both the primary and the secondary Mullins effect are higher for the rubber compounds with higher filler content.
If the direction of the secondary load step is varied, the characteristic of the S shaped stress–strain curves will change. This refers only to the curves for the first loading cycle. The normalised stress–strain curves clarify this note. Furthermore, a parameter is introduced that describes the value of the S shape in each loading direction. The qualitative characterisation of the stress–strain curves can assist and improve the development of suitable and anisotropic material models for rubber parts. So, the finite element analysis of rubber parts can be improved clearly. The interaction of the S shaped stress–strain curves with the relative reduction of the deformation energy predicts the deformation induced anisotropy. So, with a minimum of experimental work, the rubber-like material behaviour can be described comprehensively.