
Abstract
This paper reports measurements of thermal expansion in polyethylene naphthalate films and relates them to the crystal texture. X-ray diffraction shows that the naphthalate ring planes are distributed with a strong maximum in the plane of the film. The crystal c axes are aligned in the machine direction for uniaxially drawn films but have a bimodal distribution for biaxially oriented samples. Parameters extracted from the distributions were combined with experimental and estimated values of the thermal expansion and stiffness constants for the isotropic amorphous and anisotropic crystalline phases to obtain predictions of thermal expansion coefficient using Ward's aggregate model. The Voigt average (crystals and amorphous regions in parallel) is very close to the uniaxial experimental expansion coefficients. In the biaxial samples, the model predicts the widthwise variation of principal directions of the expansivity tensor well. A linear combination of the Voigt and Reuss (series arrangement) averages reproduces the measured values.
Introduction
Polyester film is commonly produced by extrusion followed by biaxial stretching, and as a result, its final semicrystalline microstructure exhibits a relatively complicated morphology. In the case of biaxial film from poly(ethylene terephthalate) (PET), this has been the subject of extensive research, and much interest has focused on the resulting anisotropy in its properties (see, for example, Refs. 1–6). Not surprisingly, poly(ethylene 2,6-naphthalate) (PEN) can be conveniently fabricated into biaxial film using the same process technology and displays a final biaxial microstructure analogous to that present in the PET case.7
In this study, we investigated the anisotropy in the PEN film of one property, the coefficient of linear thermal expansion (CLTE). The approaches used were both modelling and experimentation. The discussion focuses on the values around room temperature, where the irreversible contribution, which may dominate above the glass transition temperature, is negligible.
A morphological model, which was based on the aggregate structure described by Ward,8 was compiled and explored. Some details are included here since the model has been extended to account for both the semicrystalline and orientation features in the biaxial film. We believe that this is the first report of such a model that includes these considerations. The CLTE as a function of direction is predicted for two idealisations of the mechanical behaviour of the assembly of anisotropic units: uniform zero stress and uniform strain. These are the familiar Reuss and Voigt averages, but it is uncertain whether they predict lower and upper bounds because the crystals have a negative CLTE along their c axis. The microstructural characterisation of film from PEN involved X-ray and density methods, while a standard thermal mechanical analysis9 yielded the expansion coefficient.
Texture of polyester films
Films of PET and PEN drawn under the conditions in this work contain crystallites with a typical size of 5 nm.2 The crystal structures are well established.10, 11 In drawn PEN films, the α form predominates.12 The chain direction is along the c axis of the triclinic unit cell, and the aromatic ring plane is close to the (1 0 0) crystal plane in PET and to (1
 0) in PEN. X-ray diffraction applied to both uniaxial and biaxial drawn films shows that there is a main population (>98%) with these planes preferentially oriented in the film plane, i.e. coplanar with it.7, 13 The orientation of the primary population can be probed by the ‘phi scan’, where the intensity of the appropriate reflection is monitored as the specimen is tilted away from the symmetric reflection position. The co-planarity is known to be always high for uniaxially and biaxially stretched films; for aromatic polyesters in particular, the plane of the aromatic ring in the molecular backbone rotates during stretching into coincidence with the macroscopic plane of the film.2
A convenient way of quantifying the c axis or chain orientation in the plane is to measure the intensity of the (0 1 0) reflection with the specimen tilted at the angle between this plane and the aromatic ring plane while it is rotated through 360° about an axis normal to the film plane (the chi scan).13 The (0 1 0) planes contain the crystal c axis. One-way drawn films show a strong c axis orientation along the draw direction, whereas sequential biaxially drawn films show two preferred directions (see Fig. 1). When the second draw is performed with a stenter, these directions are aligned in the machine and transverse directions (MD and TD) only at the centre of the film width. Towards the edges, the first preferred direction moves away from the MD slightly, but the second rotates significantly by ⩾45°.6, 14
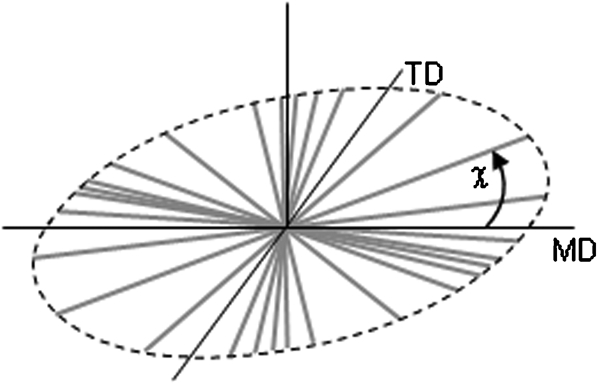
Representation of distribution of angle χ between c axis (chain direction) and MD showing two preferred directions for biaxially stretched film
These methods are not the only ones for obtaining information about the crystal orientation distribution, but they are fairly quick and easy to perform on typical production and development samples. Pole figure methods and using the lower intensity reflections normal to the chain axis such as (
 0 5) in PET3, 14, 15 could give a more complete and accurate information. With the methods used here, the phi scan on the biaxial specimens is unable to distinguish between tilt of the c axis out of the plane and the ‘roll’ of the ring plane about the c axis.
Model theory
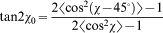
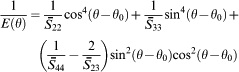
Despite the low symmetry of the crystal c axis orientation revealed by the chi scan, the final CLTE variation with angle θ in the plane follows that predicted by rotating the coordinate system of a strain tensor16

The elastic and thermal expansion properties of materials consisting of one phase dispersed in another are difficult to calculate exactly. This paper describes an aggregate model implemented in Microsoft Excel to calculate the Reuss and Voigt averages of CLTE using assumptions of uniform stress and uniform strain respectively, linking the phase properties given below with the crystal orientation distributions measured by X-ray diffraction. The model predicts the two principal values and the principal directions, allowing the full directional dependence to be calculated using equation (1).
Amorphous phase
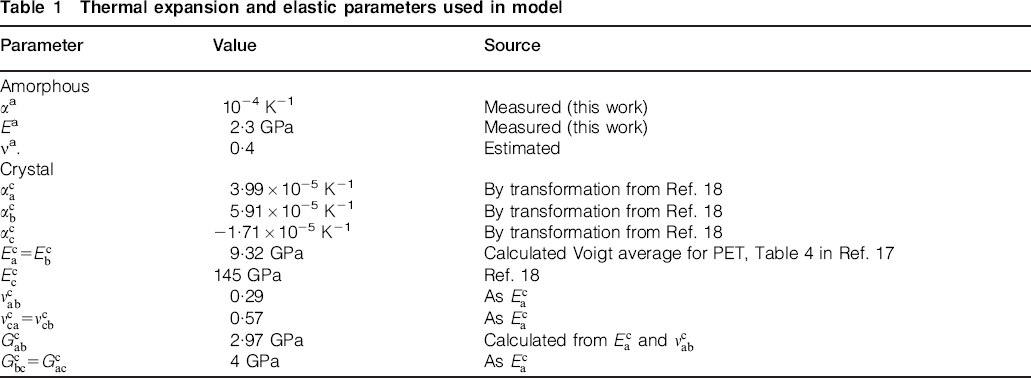
This is assumed to be an isotropic single phase, characterised by a CLTE αa, Young's modulus Ea and Poisson's ratio νa. Table 1 lists the values used: measurements of the first two are reported later, and a typical value νa was assumed.
Thermal expansion and elastic parameters used in model
Crystal phase
Following Ref.17, an orthogonal set of axes can be defined taking the crystal c axis, the b axis lying in the aromatic ring plane and normal to the c vector, and the a axis normal to the ring planes. These are not the principal axes for the thermal expansion or elastic stiffness tensors in the crystal. Nevertheless, they can be treated as the principal axes of these tensors with orthotropic symmetry because the population of crystals contains equal numbers with the c axis pointing in the positive and negative directions. This leads to a cancellation of most off-diagonal terms in the tensor when averaging all crystal orientations obtained by rotating by 180° about each of the a, b and c axes.
The only PEN crystal elastic constant in the literature is the Young's modulus in the chain direction
 .18 In PET, the values in the other two directions
 ,
,
 are similar, so it has been assumed that the PEN crystal has transverse isotropy, with modulus
 equal to the averaged PET value. Likewise, the Poisson's ratios
 and
and
 and shear moduli
 and
and
 were assumed to be same as in PET.
The CLTE components along the orthogonal axes are
 ,
,
 and
and
 . The fractional length increase with temperature <50°C along each of the (1 0 0), (0 1 0) and (
 ) directions as measured by X-ray diffraction can be read off Fig. 5a in Ref. 18 as 5·36, 4·69 and −1·56×10−5 K−1. The first two values and directions can be used in equation (1) to obtain the principal values normal to the chain direction shown in Table 1. Rather surprisingly, the expansion coefficient in the plane of the rings normal to the chain is larger than the value normal to the rings. The value parallel to the c axis direction is then obtained similarly from the three-dimensional equivalent of equation (1). Coupling to the amorphous phase, which would increase the apparent crystal CLTE values, was ignored.
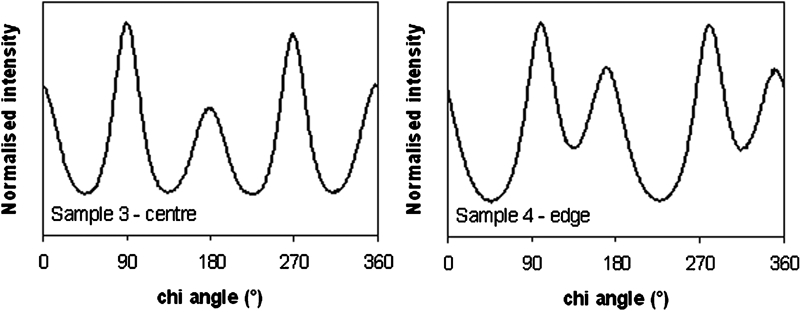
WAXS chi scans of biaxial samples 3 and 4, taken close to full web centre and edge respectively
Data
The model uses the amorphous and crystal parameters defined in the text and listed in Table 1.
Orientation averages
The distribution revealed by the phi scan is made up of two underlying contributions (Fig. 2):
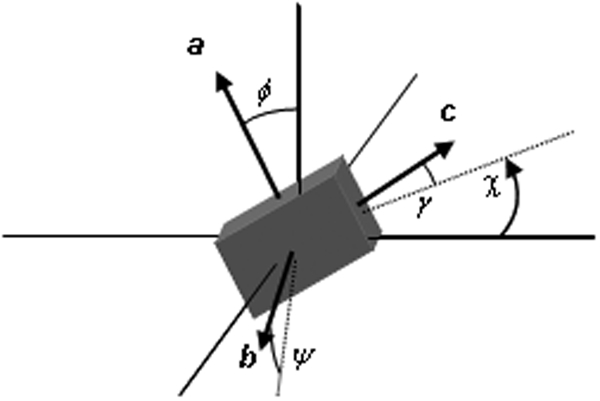
Out-of-plane crystal orientation is specified by Euler angles γ (pitch) and ψ (roll); they combine to give angle φ between normals to {1 −1 0} plane and film plane
b axis lying in the film plane, but the c axis tilted out of the plane by pitch angle γ (chain axis tilted out of the plane but no rotation about the chain)
c axis lying in the film plane, but the b axis tilted out of the plane by roll angle ψ (ring rotated about the chain axis).
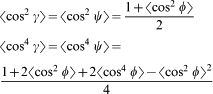
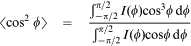
In sequential biaxially drawn PET films, (1 0 0) pole figures show that the half-widths of these two distributions are similar.15 Hence, the orientation averages will be assumed to be identical and related to that of ring normals φ by
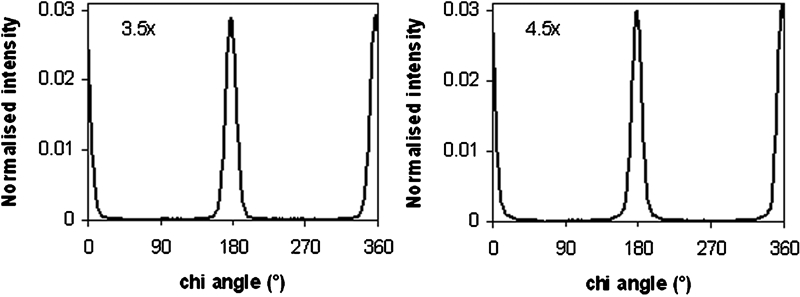
Wide angle X-ray scattering (WAXS) chi scans of uniaxial samples 1 and 2 with stretch ratios 3·5 and 4·5 respectively
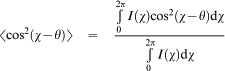
The in-plane orientation of the c axis is characterised by the distribution of angle χ (Fig. 1). Uniaxial film shows a single maximum in the draw direction, but sequential biaxially drawn film shows 2 maxima, whose angles do not correspond exactly with the draw directions. Calculation of the CLTE requires evaluation of the averages over χ of 〈cos2(χ−θ)〉 and 〈cos4(χ−θ)〉, where θ is a chosen angle, using
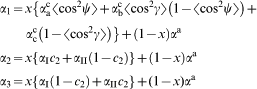
Reuss (uniform stress) model
This average assumes that each phase (and each crystal) expands as if it were isolated, and then the thermal strains are simply averaged, ignoring any transfer of stress between phases. This is an extension of the ‘dispersed crystallite’ model of Choy et al.19 to orthotropic crystallites with a biaxial–planar orientation distribution.
The contribution of crystals to the CLTE in the film plane at any angle is made up of the c component of crystals pointing in that direction and the b component of crystals pointing at right angles. Then, this must be reduced to reflect the tilt of the b–c plane out of the plane, and the small contribution from the a direction added in. The out-of-plane contribution is chiefly that of the a component of the crystals, with small amounts of the b and c components added. The amorphous phase contribution is added in using the rule of mixtures, with a volume fraction crystallinity x.
The final equations for the principal components α1, α2 and α3 of the CLTE are
Voigt (uniform strain) model
In the Voigt average, the components are assembled in parallel. The averaging must take account of the strong anisotropy of the elastic behaviour and the lower modulus of the amorphous phase.
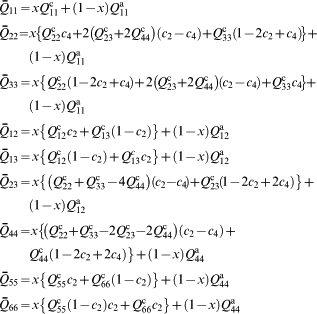
This can be performed by subjecting the material to an imaginary loading sequence. First, each phase develops stresses in response to a temperature change at fixed dimensions. They are calculated from its thermal expansion coefficients and elastic stiffness matrix. Then, the average stress is calculated using the same averaging as for strain in the Reuss model. Next, external stress is imposed to bring the average stress to zero, and the accompanying strain, calculated using the compliance matrix of the composite material, is the negative of the thermal strain, allowing the CLTE to be found. Relaxation of stress between phases is ignored.
The compliance matrix for each phase relative to its principal axes can be simply constructed from the elastic properties in Table 1. Standard matrix inversion is used to obtain the stiffness matrix. The stiffness matrix
 of the composite material is calculated from those of the individual phases by averaging over crystal orientations and using the rule of mixtures. Stiffness, rather than compliance, is used in order to be consistent with the Voigt averaging over thermal stresses. The orientation averaging is carried out about each axis in turn, using two-dimensional equations for coordinate transformation (see, for example, Ref. 20).
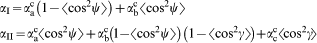
The first average, over the rotation ψ about the crystal c axis, has no effect because the crystals have been assumed to have transverse isotropy. The second average is over γ, the tilt of the c axis out of the plane. Finally, the average over χ, the distribution of c axes in the plane is taken. These two averages are performed sequentially, with identical equations apart from interchange of suffices and the angle used for the orientation averages. For example, the final stiffness components after the third averaging are given in terms of the amorphous stiffness matrix Qa and the crystal stiffness matrix after the second averaging Qc
 , with θ0 as the angle of the 2-axis to the MD as before
Experimental
Materials
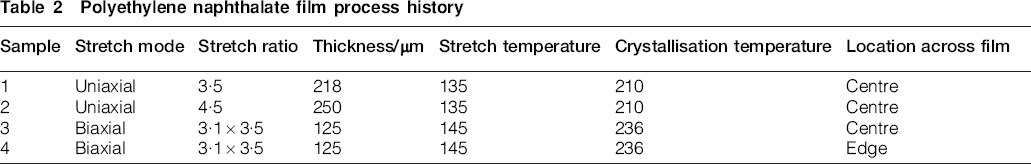
Experimental film from PEN was prepared by two routes: first, using a small scale extruder and drawing between rollers to generate a uniaxially stretched sample, and second, employing a small pilot line to manufacture sequentially biaxially stretched film with width around 1 m. Details of the process history are summarised in Table 2. In both cases, the film was annealed at fixed dimension in order to increase the crystalline level of the sample and improve its dimensional stability.
Polyethylene naphthalate film process history
A further sample of low crystallinity PEN polymer was also prepared in film form using the small extrusion system. It was quenched as a melt curtain onto a cold casting drum to give a 1 mm thick film. Its density was 1331·6 kg m−3, corresponding to 4·5% crystallinity, but there were no crystalline reflections observed by wide angle X-ray scattering (WAXS), imposing an upper limit of around 2% crystallinity. Subsequent sections of this paper will assume that this sample is completely amorphous.
Crystallinity
The density of film was measured using a column containing an aqueous solution of calcium nitrate whose density was graduated with height. Absolute values were measured at room temperature against a series of calibration floats. The volume fraction of crystallinity was calculated assuming a two-phase semicrystalline structure and by assigning densities of 1407 and 1328 kg m−3 to crystalline11 and amorphous21 PEN respectively.
Modulus
A dynamic mechanical analyser (DMA), TA model 800, was used to measure the storage modulus E′ of the amorphous sample and one uniaxial film. Each specimen was mounted in single cantilever clamps and heated between 20 and 220°C at a rate of 4°C min−1. A frequency of 10 Hz and strain of 0·1% were used. The modulus at 20°C was used in the subsequent calculations.
Coefficient of linear thermal expansion
The CLTE was determined using a Perkin Elmer Model 7 thermomechanical analyser (TMA).9 Specimens were heated from 7 to 230°C at a rate of 5°C min−1 under an atmosphere of dry nitrogen. A small preload of 75 mN was applied to 5 mm wide tensile specimens. The measurement of specimen length was corrected for instrument expansion by subtracting a reference scan with a quartz specimen. The CLTE was calculated over the temperature interval 20 to 60°C.
Specimens were cut in directions defined in a convention similar to Ref. 6, where the sample of film was viewed with the ‘air side’, a specific surface relating to the process history, facing upwards. The MD or process direction in the film was designated 0°; the TD or perpendicular direction, 90°; and +45 and −45° intermediate directions located clockwise and anticlockwise from 0°. For the uniaxial samples 1 and 2, the principal directions lie at 0 and 90°. Specimens cut at +45 and −45° should give identical results, so the latter were skipped. For the biaxial samples 3 and 4, all four directions were tested, allowing the unknown principal direction θ0 (equation (1)) to be found.
WAXS measurements
The diffracted intensity of Cu Kα radiation was recorded using a scintillation detector on a Siemens D500 diffractometer. Single film specimens held in a frame were mounted on a Huber Eulerian cradle to perform the scans.
Chi scans
The angular distribution of crystal c axes in the plane of the film was found by measuring the angular variation of (0 1 0) diffraction intensity (2θ = 15·7°) from the specimen tilted at 30° to the beam and rotated in its own plane. The intensity was corrected for background by subtracting a baseline obtained from a 2θ scan at the same tilt angle. The distributions were plotted against the c axis orientation angle χ, calculated by adding 90° to the specimen rotation angle.
The uniaxial samples showed strong peaks indicating c axes aligned in the draw direction. Weak subsidiary peaks around 30° away were attributed to reflection from a different crystal plane, possibly the (0 1
 ), and removed by curve fitting.
The entire distribution was used in the model calculations, but it was characterised simply for comparing biaxial samples by three parameters: MD and TD peak positions, and the ‘chi ratio’ calculated from the peak intensities using chi ratio = TD intensity/(TD intensity+MD intensity).
Phi scans
The extent to which the aromatic rings are oriented in the film plane was measured using the (1
 0) (2θ = 27°) reflection. Preliminary measurements showed that the position and width of the intensity peak as a function of 2θ changed as the specimen tilt angle φ was altered. Therefore, a simple scan at fixed 2θ varying φ would have been inaccurate, and a modified procedure was adopted.
A series of 2θ scans at tilt angles increasing in 5° steps was performed. Each was fitted with a broad amorphous peak and a set of narrow crystal peaks. The area under the fitted (1
 0) peak was corrected for the attenuation due the thickness and tilt angle by comparison with a reference isotropic semicrystalline PEN specimen. Finally, the peak areas were plotted as a function of the tilt angle φ to obtain the phi scan.
Results and discussion
Material properties
Two bulk properties of the sample of low crystallinity PEN polymer αa and Ea, which were measured using TMA and DMA respectively, are recorded in Tables 1 and 3. These were taken as the amorphous phase properties in the aggregate model. The effect of the unwanted but small crystallinity is discussed below.
Material property data
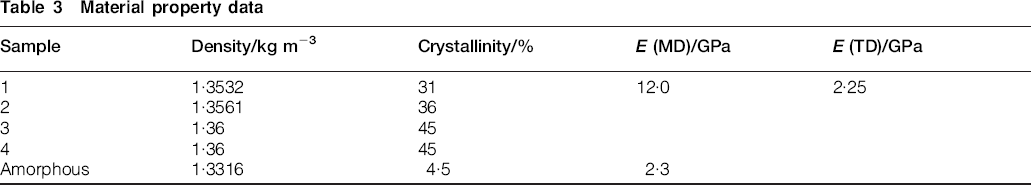
A further material property required for use by the model is the crystallinity of film samples 1–4. The values were found to be fairly similar and are shown in Table 3, the difference reflecting the higher crystallisation temperatures employed to prepare the biaxial samples.
Also listed is the storage modulus E′ for sample 1, measured in the MD and TD.
Finally the measured coefficients of linear thermal expansion, CLTE, are presented in Table 4 for each sample. The −45° values for samples 1 and 2 were not measured but assumed equal to the +45°. A repeat of the 90° measurement for sample 2 is also shown in the table.
Coefficient of linear thermal expansion
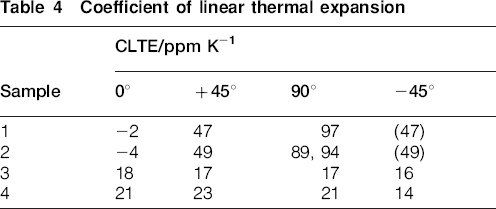
Consistent with other work on uniaxially stretched polymer films,22 the CLTE of samples 1 and 2 is seen to be extremely low and negative in the MD (stretch). This is associated with the extension and alignment of the molecular chains resulting from the stretch.23 Similarly, the greater freedom for lateral, translational motion of the molecules accounts for the high expansion measured in the TD (90°) of 1 and 2. For the biaxial samples, the anisotropy in CLTE is much smaller; however, it is still present, and since the property will arise from the same mechanisms, it is likely that the explanation lies in the different microstructure.
Texture: uniaxial films
The chi scans from the uniaxially drawn films (samples 1 and 2; Fig. 3) show strong maxima at 0 and 180°, corresponding to crystal c axes aligned very closely with the stretching direction. The degree of orientation is slightly higher in sample 2, as expected from its higher stretch ratio of 4·5.
The phi scans of samples 1 and 2 show a peak at 0°, indicating that the crystals are preferentially oriented with the aromatic rings parallel to the plane of the film. The peak is considerably broader when tilted about an MD axis than a TD (Fig. 4). This implies that the crystal c axes are strongly aligned in the film plane, but the aromatic ring plane in the crystal has a wider range of tilt angles about the draw direction. In terms of the earlier discussion, the pitch angle γ has a narrower distribution than the roll angle ψ.
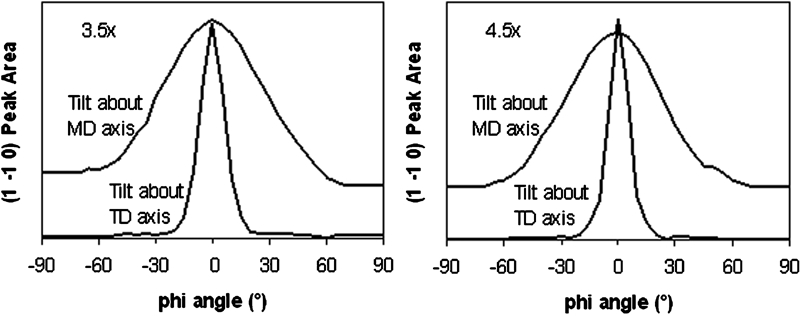
WAXS phi scans of uniaxial samples 1 and 2, tilting specimen about MD and TD axes
Texture: biaxial films
The chi scans from the biaxially drawn PEN films (samples 3 and 4; Fig. 5) are quite similar to those from PET, showing the presence of two preferred directions of c axis alignment in the film plane, having their chain directions oriented towards the TD and MD. The scattered intensity associated with the chains in the TD is stronger than that associated with the MD. The peak positions and chi ratios are shown in Table 5, which includes some samples taken at other locations across the width.
Angular positions of peaks in WAXS chi scans of biaxial samples across full 1 m width of film, together with their relative intensities
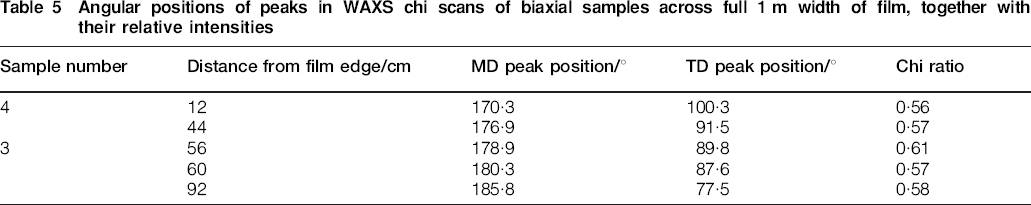
Sample 3, taken at the web centre, shows the preferred directions close to the MD and TD. Moving progressively towards either film edge, the preferred directions depart further from those directions. They are no longer at right angles, indicating that shear has taken place during the second, sideways, draw. The chi ratio is similar in all samples and slightly higher than 0·5, indicating that there are more crystals aligned towards the TD than the MD, following the relative stretch ratios.
The phi scans of samples 3 and 4 (Fig. 6) are similar to those of samples 1 and 2 in that they confirm that both the crystal c axes and the aromatic ring planes are oriented close to the plane of the film. However, there is very little difference between the distributions obtained by tilting about MD and TD axes. This implies that the distribution of the roll angle ψ is considerably narrower than in the uniaxial samples, probably the result of the greater area draw in the biaxial samples.
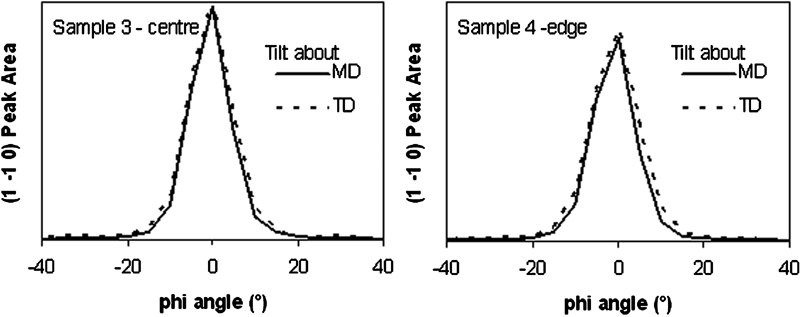
WAXS phi scans of biaxial samples 3 and 4, tilting specimen about MD and TD axes
Comparison of model predictions with measured thermal expansion
The measured values of CLTE of uniaxially drawn samples 1 and 2 are plotted along with the model predictions for the Reuss and Voigt averages in Fig. 7. The two plots are nearly identical as a result of the similar sample morphologies. The CLTE is negative at 0 and 180°, arising from the strong alignment of the negative crystal expansion direction in the MD. In contrast, the expansion at 90 and 270° is close to the amorphous and transverse crystal value for CLTE.
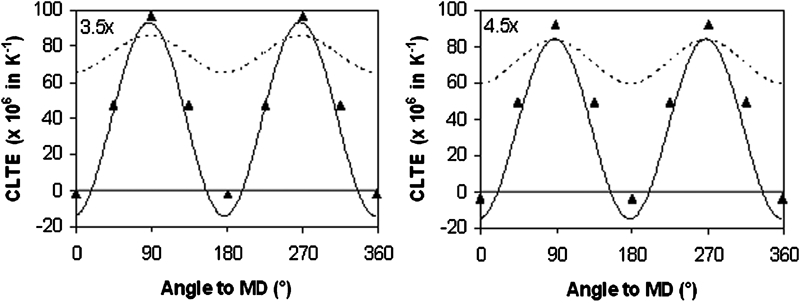
Comparison of measured angular dependence of CLTE of uniaxial samples 1 and 2 with predictions (dotted: Reuss, solid: Voigt)
The experimental data fit the Voigt average well. The Reuss average fails to predict the low CLTE values at 0°, and the 90° value exceeds both Reuss and Voigt averages. The Voigt average successfully predicts the lower CLTE in the TD in the higher stretch ratio sample 2.
The fit can be improved slightly by increasing the amorphous phase CLTE to 1·1–1·2×10−4 K−1. This range is feasible because the measured value is possibly influenced by the presence of a small degree of crystallinity, and the true value should be higher. The effect is to raise the predicted values, and as a result, the TD CLTE no longer lies above the Voigt average.
It is possible that the amorphous regions in the uniaxially drawn film have some orientation, which might be expected to raise the CLTE transverse to the draw direction. Although the model has not been extended to include this, it seems a plausible explanation of a larger effective amorphous CLTE.
It is perhaps surprising that the experimental values lie so much closer to the Voigt bound. This may reflect an arrangement of neighbouring crystals and amorphous regions that is close to the ‘parallel’ configuration of the model. Crystals in uniaxially drawn PET have an aspect ratio around 2∶1,2 and similar behaviour is expected in PEN. Combined with the high degree of uniaxial orientation, this would emphasise the parallel arrangement. An alternative explanation could be amorphous orientation contributing to the anisotropy of the CLTE.
Figure 8 shows the comparison of model predictions with measured thermal expansion data for the biaxially drawn film samples 3 and 4. The edge sample 3 shows a stronger angular dependence, with maximum and minimum CLTE at 45 and 135° to the MD respectively. The centre sample is almost isotropic, with maximum and minimum in the MD and TD.
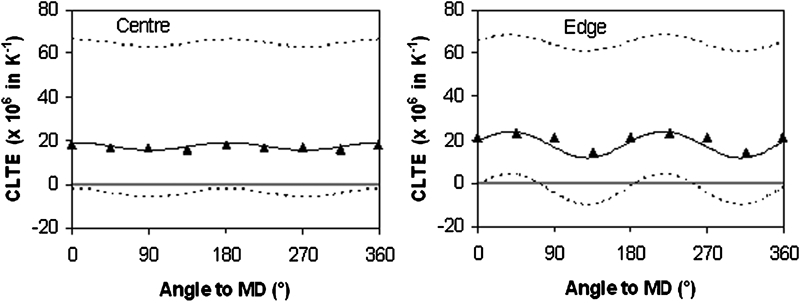
Comparison of measured CLTE of biaxial samples 3 and 4 (symbols) with predictions (Reuss: upper dotted, Voigt: lower dotted, linear combination: solid)
The Reuss and Voigt averages bracket the experimental values, and the magnitudes of their angular dependence match very well. The measured values are closer to the Voigt average. In fact, the experimental results for both samples can be predicted very well by adding the Voigt and Reuss values multiplied by 0·69 and 0·31 respectively. This constant ratio cannot be predicted without much more sophisticated calculations. However, its value does suggest that the morphology lies midway between the extremes of the series and parallel models employed, as expected for a uniform dispersion of crystals.
If a higher CLTE for the amorphous phase is used, the film CLTE is predicted to have a very similar angular dependence but to be shifted upwards.
With only three angles at which CLTE was measured, it is impossible to confirm that the model predicts the directions of the maximum and minimum values accurately. Nevertheless, the model predicts that the maximum CLTE direction moves from 0 to 45° to the MD between the film centre and edge (samples 3 and 4), consistent with the experimental result and coincident with the minimum in the c axis orientation distribution. The large shift is in contrast to those of the maxima in the c axis distribution, which are only 10°.
Conclusions
We believe this is the first application of an aggregate model to the thermal expansion of a biaxially drawn semicrystalline polymer with planar orientation. It clearly demonstrates the link between the crystal texture measured using WAXS and the directional dependence of CLTE. The quantity and orientation of the crystalline fraction have a major effect on thermal expansion. The crystals have lower expansion coefficient and higher elastic modulus perpendicular to the c axis than the amorphous phase. Along the c axis, there is an even more marked difference: the thermal expansion coefficient is negative and the modulus nearly two orders of magnitude higher. A dispersion of crystals in the amorphous matrix acts to restrain the thermal expansion of the amorphous matrix in all directions and imparts a degree of thermal contraction from their c axes. When the crystals have preferred c axis orientation, thermal expansion is markedly lower along the orientation direction.
In all the PEN films reported here, the crystal c axes lie predominantly in the film plane, so the out of plane thermal expansion (not measured) is expected to be close to the amorphous value. The uniaxially drawn films show marked anisotropy of CLTE in the plane due the strong orientation of the c axes along the draw direction. The biaxially drawn films show less angular dependence but nevertheless still have a smaller value of CLTE close to the larger peak in the c axis orientation distribution, which lies close to the TD.
The angular dependence of the CLTE follows the theoretical prediction of strain theory (equation (1)). The value in any direction in the plane can be predicted from just three independent numbers. These can be the maximum and minimum values together with the direction of one of them, or else measured values at 0, 45 and 90°. The maximum and minimum directions are always at 90° to each other, even though the underlying distribution of c axis orientation for biaxial edge samples shows non-orthogonal peak directions. The model takes the tensor nature of thermal expansion and elastic stiffness into account correctly, automatically giving the angular dependence of equation (1).
For uniaxially drawn films, the model prediction is fairly accurate, with the Voigt average lying very close to the experimental data.
For biaxially drawn films, the calculated Reuss and Voigt averages for CLTE are widely separated but bracket the experimental values and show the correct directional dependence. The measured CLTE is given by a mixture of the two averages in a constant ratio. However, the ratio may be expected to change as stretch ratios and overall crystallinity change.
The model is useful in predicting the dependence of CLTE on crystal orientation distribution, which can be manipulated by altering film manufacturing conditions. For example, hypothetical orientation distributions can be constructed and used as model input, predicting CLTE. Process know-how can be employed to manipulate process conditions to obtain those distributions that give the desired expansion properties. In this way, the trial time to establish process conditions for manufacture of products with particular expansion properties can be greatly reduced.
Footnotes
Acknowledgements
We would like to thank Intertek MSG staff B. Middlemiss for carrying out the WAXS measurements and A. Broadhurst for the DMA and TMA.