
Abstract
The use of renewable materials has attracted interest from a wide range of manufacturing industries looking to reduce their environmental and carbon footprints. As such, the development and use of biopolymers has been largely driven by their perceived environmental benefits over conventional polymers. However, often these environmental claims, when challenged, are lacking in substance. One reason for this is the lack of quality data for all life cycle stages. This applies to the manufacturing stages of packaging, otherwise known as ‘packaging conversion’, where for certain product/production types, a reduction in energy consumption of 25–30% from lower processing temperatures can be offset by an increase in pressure, cycle times and reject rates. The ambiguity of the overall environmental benefit achieved during this stage of the life cycle, when this is the main driver for their use, highlights the need for a clearer understanding of impact that such materials have on the manufacturing processes.
Introduction
The need for a sustainable supply of materials in manufacturing has never been greater. The relentless rise in global consumption, fuelled increasingly by the newly emerging economies, is putting unbearable pressure on the Earth's limited resources. The World Wide Fund for Nature, in their Living Planet Report 2010, estimates that, by 2030, humanity will need the capacity of two Earths to sustain our current lifestyles.1 This is particularly apparent in the extraction of non-renewable resources such as fossil fuels, many of which are already nearing a peak in supply, the most prominent example being crude oil.2 Crude oil has many uses, the largest being liquid fuel in transport; however, it is also the most widely used feedstock in polymer production, including those used in packaging applications. Finding alternatives to reduce our dependence on crude oil continues to be of the highest priority. One means to achieving this has been the replacement of oil derived materials with renewable bioderived ones. This approach has been advanced in the plastics packaging sector, with the introduction of biopolymers, plastics made from naturally occurring polymers (mostly derived from plants) such as sugars, starches and cellulose. Biopolymer packaging has been used commercially, mainly in niche and low performance applications, since the 1980s.
More recently, however, the development of higher performance materials increased production capacity for bioplastics (see Fig. 1),3 and more competitive pricing has seen a significant growth in their adoption by leading brand owner multinationals, such as Coca Cola and Pepsico, in high performance applications.4 One of the main attractions of biopolymers is their perceived environmental benefits; however, despite the environmental claims made by manufacturers, results of independent analysis, over the packs whole life cycle, are less conclusive. Indeed, various government initiatives have promoted and supported the procurement of ‘biobased’ and ‘sustainable’ products, despite the lack of scientific understanding of the real environmental benefits achievable.5 A comprehensive review of 25 publicly available life cycle assessment (LCA) reports from the academic and commercial literature, spanning the time period from 1997 to 2009, confirmed the lack of good quality LCA data for biopolymer packaging, particularly for the production, use and end of life stages.4
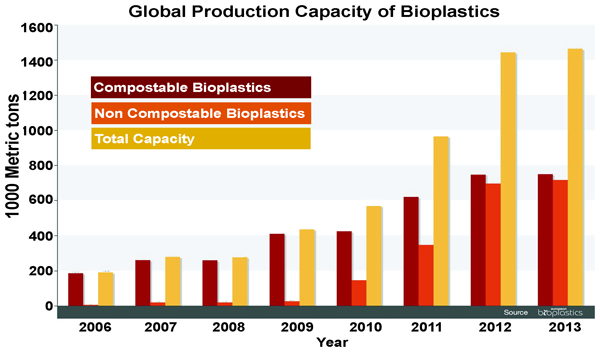
Global production capacity of bioplastics (sourced from European Bioplastics)3
This paper highlights that, while biopolymers provide a possible alternatives to conventional thermoplastics for plastics packaging, there are still a number of life cycle issues that need further investigation, in particular their environmental impact during the packaging production stage. This paper outlines a method for calculating the ‘energy consumption versus waste generated’ for three types of packaging conversion processes, based on biopolymers and their main conventional plastic counterparts. These conversion processes represent the three most widely used plastic packaging formats, namely, bag, bottles and trays. A case study based on the production of a 500 mL capacity plastic bottle for mineral water has been used to illustrate and assess the key areas of environmental gain and loss.
Overview of biopolymer types
The number of biopolymers commercially available for plastics packaging continues to increase; however, the first generation of biopolymers most widely used are reconstituted cellulose, polylactic acid (PLA), thermoplastic starch and polyhydroxylalkanoates. However, recently, the range of conventional polymers produced (in full or in part) from a bioderived precursor (i.e. bioethylene). These include polyethylene, polyethylene terephthalate (PET) and polypropylene. This latter group is often referred to under a number of classifications including class B bioderived polymers, bioconventional polymers or non-degradable biopolymers.4, 6 However, as the processing of these polymers is identical to their oil derived counterparts, this research has focused primarily on the processing of the main first generation biopolymer, PLA, which has been used commercially for the production of the three aforementioned pack types (i.e. bags, bottles and trays).
Packaging conversion processes
The final stage during the manufacturing process of most consumer products involves the filling and sealing of the goods into their designated package. In the food and drink sector, this process often involves the inline conversion of an intermediary material such as a reel of film or a preform into the individual pack. This conversion process requires key energy inputs, mainly in the form of heat, to shape, mould and/or seal the various packaging types. The three most commonly adopted plastic packaging conversion processes, as depicted in Fig. 2, are as follows:
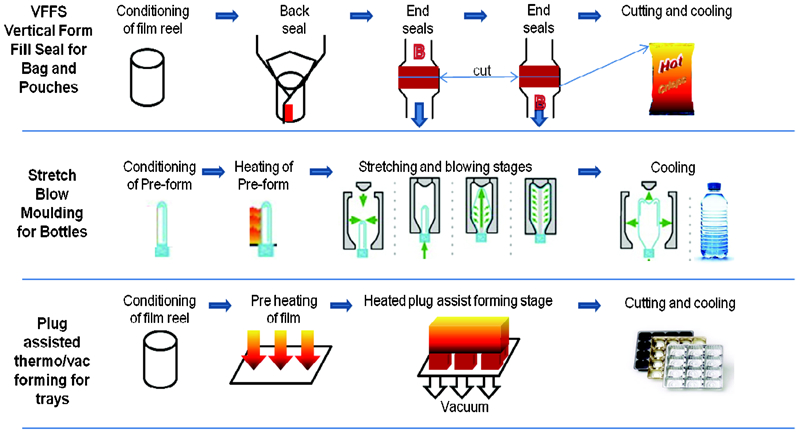
Key stages in three packaging conversion processes
vertical form fill seal used to manufacture flexible packages for loose products filled by weight, e.g. crisp packets
stretch blow moulding used to manufacture rigid containers such as bottles for packaging mainly liquid products, e.g. mineral water
plug assisted thermo/vacuum forming used to manufacture mainly shallow one or two part semirigid containers, e.g. trays for chocolates.
From comparison of the physical properties of biopolymers and conventional polymers, it is asserted that thermal stages of these processes are where the most significant difference in theoretical energy consumption exists between the two material groups. However, it should also be noted that in practice, other factors such as viscosity, cooling, cycle times and handling will also have an impact on overall energy consumption. The forming, moulding and sealing processes are discussed in more detail in the following sections.
Vertical form fill seal
The key thermal input in this process, as shown in Fig. 2, occurs during the sealing of the film first down the length of the pack to create a tube, followed by the sealing of the ends to create a sealed bag. In practice, these end seals are produced in pairs; the top of the lower bag and bottom of the upper bag are sealed at the same time and then separated by a horizontal cut at the midpoint. To measure the total heat energy used, the sum of the energy used to create all three seals should be calculated. While there are a number of different sealing mechanisms in commercial use each having unique energy values associated with it, calculating the theoretical energy used to fuse the two layers of the film will allow the comparison of the two material types regardless of the equipment used. Individual machine variations and efficiencies can then be attributed accordingly. The total theoretical heat energy used to seal one bag can be calculated using equation (1) as derived from the standard equation for heat capacity of a solid with no transition phase

It should be noted that the mseal can be calculated from the surface area of the seal multiplied by the film gauge and the material density.
Stretch blow moulding
As illustrated in Fig. 2, the key thermal stage in this process occurs during the heating of the preform before blowing process. While significant energy is used during the other stages of bottle making, this does not vary significantly in terms of the polymer used. Equation (2) can be used to calculate the thermal energy used during this stage of the bottle making process

It should be noted that Mmould can be calculated from multiplying the surface area of the seal, film gauge and the material density.
Plug assisted thermo/vacuum forming
The key thermal stages in this process occur during the preheat and cooling stages, as shown in Fig. 2. Similarly, equation (3) can be used to calculate thermal energy used during this process

It should be noted that Mform is calculated by multiplying the surface area of the forming, the film gauge and the material density. Furthermore, in the cases where a heated plug assist is used, then a smaller additional heat transfer occurs during the forming stage. However this is not included in the calculation in equation (3).
Processing temperature variations between polymer types
The main energy saving in the processing of PLA compared to other conventional thermoplastics occurs during the heating stages. This is primarily due to the lower melting point of PLA, as shown in Fig. 3, compared to other widely used packaging polymers. However, other factors may also need to be considered in order to evaluate the overall environmental benefits achievable during this processing stage. One of the main considerations in this case is the potentially higher wastage levels associated with PLA as described in the section on ‘Example case study’. While the thermal processing calculations of the model are based on actual processing temperatures, wastage levels are theoretical and based on the observed processing limitations of each material.
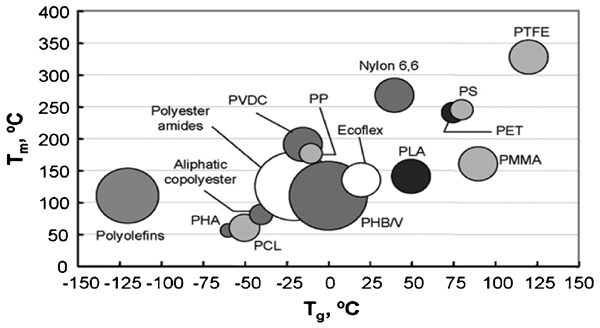
Comparison of glass transition and melting temperatures of PLA with other thermoplastics7
Predicting impact of tighter thermal processing windows on waste generation
While PLA has a lower melt point than PET (see Fig. 3), it has a much narrower optimal processing window due to its higher temperature sensitivity. The majority of the problems with material distribution and forming will occur at too low temperatures, while, above the optimal processing temperature, problems with thermal degradation can occur resulting in higher rejection rates.7, 8 Clearly, the number of rejects will vary case by case; however, it is reasonable to assume that on a like for like basis, PLA bottle rejects will be higher than PET due to its greater temperature sensitivity, and this will rise exponentially as temperature fluctuations increase.8, 9
Using PLA and PET processing data obtained from both academic and industrial sources,6–9 the different processing windows of PET and PLA have been estimated. A graph showing the likely increase in rejection rates between PLA and PET, as processing temperature deviates from the optimum, is illustrated in Fig. 4. It is proposed that this reject rate will vary, in part, according to how closely the optimum processing temperature can be maintained. Where the control is good, the difference in wastage levels between PLA and PET is unlikely to be significant; however, as the level of control drops, the rate of rejects using PLA is likely to increase at a much greater rate compared to PET. The chart assumes a close to 0% reject rate at optimum processing temperature and a 100% rejection rate outside the processing window, as demonstrated in the experiments of Byrne et al., 9 as highlighted in their study on processing conditions for PLA and PET polymers. An estimation of reject levels between these points was estimated using a standard parabolic distribution curve.
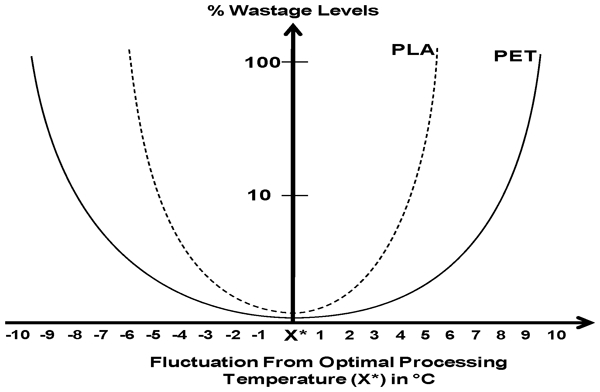
Higher wastage levels of PLA compared to PET due to effect of temperature control fluctuations on processing window size
Example case study
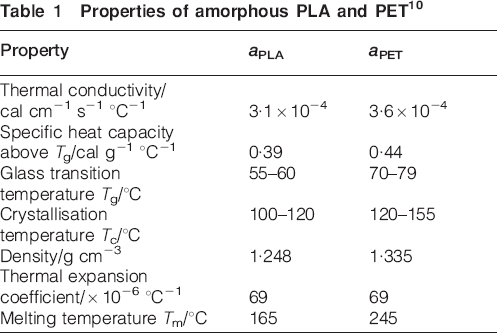
The production of a plastic mineral water bottle is used as a case study to illustrate the issues related to energy used and rejection rates when using two PLA and PET polymers during the thermal processing stages. The data from a typical production system for a 500 mL capacity mineral water bottle have been used in this case study, where the neck diameter for the bottle is 28 mm and the weight is 24 g. It should be noted that for this case study, the same weight was used for both PLA and PET; however, opportunities for reducing weight (i.e. a lightweight bottle) using PLA may be possible but outside the scope of this initial study. The various thermal properties for the PLA and PET used are given in Table 1.10 It is assumed that 1 million bottles per year are produced on a twin tool machine operating one 8 h shift at approximately four cycles a minute.
Properties of amorphous PLA and PET10
The total heat energy used for the stretch blow moulding process has been calculated using equation (2). All non-thermal stages in the process – mechanical, handling and set-up – were assumed to be equal between the two materials. In terms of calculating wastage, the thermal processing window for PET and PLA was assumed to be ±2°C of the optimum processing temperature X*, as per Fig. 4. For PET, this gives a reject rate of ∼0·5%, while for PLA this would give a reject rate of ∼1·5%.
Analysis of results
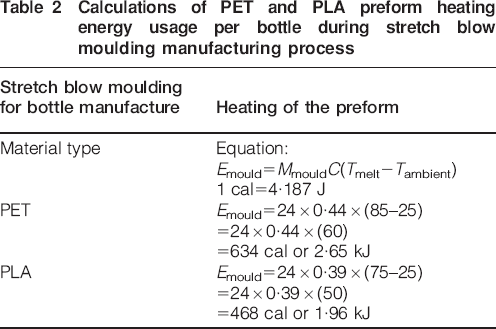
The energy consumed, per bottle, during the thermal stages of the SMB process is summarised in Table 2. The thermal energy required for one PET bottle uses 2·65 kJ, while one PLA bottle requires 1·96 kJ; therefore, the thermal energy saving is 0·69 kJ per bottle. This indicates that the energy consumed, per bottle, during the thermal stages of the process when using PLA was 26% less than that used for PET. Thus, a total annual energy saving of 690 000 kJ can be achieved in the production scenario of 1 million bottles per year.
Calculations of PET and PLA preform heating energy usage per bottle during stretch blow moulding manufacturing process
Using the example of 1 million bottles per year, the total number of rejects for PLA bottles based on the wastage levels of 1·5% will be 15 000 compared to only 5000 for PET based on its wastage levels of 0·5%. To calculate the total energy lost through the production of reject bottles, it is assumed that the thermal process considered in this case study will only account for 25% of the total energy required to produce a PET bottle.
Therefore, the total energy required to produce a PET bottle is


Conclusions
The scarcity of resources and the rapid depletion of non-renewable provide some of the greatest challenges facing the manufacturing industry in the future. In this context, the substitution of non-renewable materials with renewable ones has been proposed as a possible solution in a number of applications. However, at present, there are two major concerns with this solution.
The additional demand for renewable materials may compete with other essential requirements, for example, the impact of the rapid increase in biofuel and biomaterial demands on the food production capacity.
The perceived environmental benefits of renewable materials may be offset by the concerns over their overall life cycle impact in particular during the manufacturing, use and end of life stages.
In this paper, one such concern related to the wider green credentials of biopolymers, in particular during the production stage, has been assessed. The results of the case study presented in the paper demonstrate that in a comparative study of a typical packing product using PLA and PET, the reduction in energy consumption during the production process using PLA could theoretically be offset by an increase in the number of rejects due to its greater sensitivity to temperature variation. In practice, however, normal reject rates would be well below the levels necessary for this to occur. While the indications are that biopolymers have the potential to reduce the environmental impact of plastics packaging at various stages of the life cycle, including the packaging conversion stage, a more detailed and complete LCA should be carried out for each to ensure that these benefits can be robustly defended.