
Abstract
Novel methods for process simulation and cost analysis have been applied during manufacturing process development of a rotor blade pitch horn. The aim is to reduce costs and lead time on the one hand and to enhance part quality on the other hand. Fabric draping has been simulated using the kinematic draping code PAM-QUIKFORM incorporating new processing strategies. Draping strategies were optimised using a genetic algorithm taking into account manufacturing constraints, which led to a fabric shear reduction by up to 10° with the optimised strategy implemented in manufacturing. A novel material generation of prebindered carbon fibre tows has been used to enhance rigidity and dimensional accuracy of the preform and to minimise processing time. State-of-the-art preforming technology has been incorporated in the process significantly increasing the degree of automation. The process had been analysed based on the activity based costs methodology deriving product costs as sum of costs of all activities involved. Development efforts have been concentrated based on the analysis in order to optimise cycle times with a nearly even duration of the subprocesses. In comparison to a manual prepreg manufacturing process, cost savings with the novel, semiautomated preforming process could be quantified to ∼20%.
Introduction
Carbon fibre composites are widely used in today's aircraft applications due to their superior weight normalised mechanical properties. High CFRP manufacturing costs compared to aluminium parts arise due to the high carbon fibre market prices and to the low degree of automation within the manufacturing process.
Today, advanced structural composites manufacture uses either layers of preimpregnated plies (prepregs) to generate laminates or dry textile resin infusion [liquid composite moulding (LCM)]. Prepreg composites have superior mechanical properties due to the use of toughened resins and low degree of fibre misalignment but suffer from high material and process costs, complex manufacturing processes and limited shelf life. Liquid composite moulding technologies can overcome many of these limitations at the expense of a higher degree of reinforcement misalignment and use of low viscosity, untoughened matrix systems. Dry fibre preform manufacturing offers an intermediate route as it can combine high automation potential, which can lead to significantly reduced part costs with adequate control of fibre orientations and possibilities for the incorporation of toughening agents in the binder.1
Liquid composite moulding technologies can be combined with dry fibre preform manufacturing. Direct preforming processes like braiding, weaving or fibre placement are one approach, where the preform is produced from fibre yarns (and optional auxiliary materials) in one process step. The alternatives can be termed as sequential preforming and can mainly be classified as binder and textile routes.
The textile route uses binding methods like stitching or tufting, whereas the binder route is based on the adhesive effect of molten polymers placed between fabric layers and in the yarns.1 Low melting thermoplastics and uncatalysed thermosets are the main binder categories.2 Binders are either sprayed or sprinkled onto the preform or are embedded on fabric layers as a veil.2 The fabric used during the work presented here is based on a carbon fibre tow, which was prebindered during the tow manufacturing stage.3 Customised non-crimp fabrics and unidirectional (UD) bands have been produced from this tow.
At a certain preforming process stage, textiles need to be draped to a shape, which is close to the shape of the final part. Critical factors during the draping stage rely on the capacity of the reinforcement to conform to a given shape mainly through planar shear deformation and interply sliding. Draping may induce defects like misalignments or wrinkles to the fibre reinforcement through high shear deformations.2 These defects can degrade the final part mechanical properties. They can be influenced by both the draping strategy and the design of the seam patterns, which are applied during the creation of the planar, multilayer reinforcements. Avoiding distortion of the fibre structure has been a primary objective for the component studied in this work.
Simulation can serve to find the best draping strategy without time consuming manufacturing trials. Drape model strategies range from kinematic drape models, which are geometrical mapping algorithms that treat the woven material as a pin jointed net of inextensible fibres4-6 to shell based finite element model that take into account the full complexity of the material behaviour of preimpregnated or dry textiles.7, 8 Some intermediate solutions between these two extremes are also available mainly based on simplified finite element representations of textiles that incorporate the relative inextensibility of tows and the highly non-linear shear behaviour of these materials in a truss representation.9 Kinematic models have very low computational resource requirements due to their simplicity and are therefore appropriate for iterative execution within the context of an optimisation algorithm.
Apart from savings through reduced material costs, the automated preforming technology application is essential to that objective.
Further to the development of alternative material solutions, a series of investigations aiming to develop alternative cost effective manufacturing processes involving short process cycles or/and high degree of automation have been carried out.10–14 In parallel, a number of investigations focusing on developing concepts for designing products by involving design to cost strategies have been made (e.g. Ref. 15). In Refs. 16–18, simple methodologies are utilised for a comparison of several composite material processing ‘routes’ on the basis of cost efficiency. In Refs. 19–21, cost modeling tools are used to estimate the manufacturing cost of automotive and aircraft components using liquid composite moulding processes by giving emphasis on resin transfer moulding. Furthermore, some analyses include optimisation methodologies, which lead to a set of optimal part or/and process parameters; they reduce the total manufacturing cost and, hence, increase the cost effectiveness of the component or process under investigation (e.g. Refs. 22 and 23).
The PICANT concept,15 as well as the respective software implementing it, was introduced, allowing for the cost estimation of a product already during the design phase by selecting the prospective manufacturing process of the product amongst various potential manufacturing processes and possibly product design alternatives. The concept, which in fact rationalises empiricism, requires extensive empirical data, available mainly by the industry. The activity based costing (ABC) methodology was used for the cost analysis and cost estimation relationships relating process parameters variation to cost for the complete product development cycle, including the detailed design phase, were derived. The application of PICANT offered improved cost estimation accuracy and efficiency.
A step forward represents concepts for the optimisation of a part with regard to its quality and cost. In Refs. 24 and 25, an approach to design fuselage frames for minimum weight and minimum cost is proposed. Cost equations were developed for the various production steps by involving the ABC method; their predictions are summed over all steps to determine the total cost of the stiffened panel. At the same time, the structure is sized to meet the applied loads. Then, weight and cost optimisation are performed in order to find the lowest weight configuration that meets the structural requirements (positive margins) and has the lowest cost.
In the present work, cost savings have been quantified using a systematic analysis based on ABC methodology, which is fully parametric, as far as process parameters are concerned. Unlike comparative techniques, process oriented cost models are adaptable to new processes, enable identification and quantification of part cost drivers to be made and may be used to decide on improvements in manufacturing processes.26
The developments described here are demonstrated on the design and manufacture of a helicopter rotor blade pitch horn component. The manufacturing process is adapted to incorporate the use of bindered preforms in the production of the component, while the draping of the bindered material is optimised to allow minimisation of shear. The cost implications of the introduction of bindered materials and the use of a higher degree of automation are evaluated.
Rotor blade pitch horn
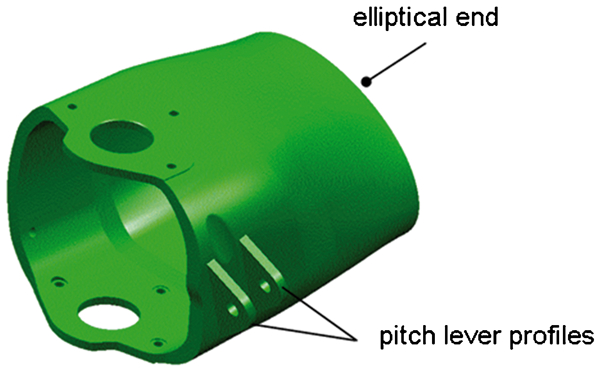
Part design
The pitch horn component (Fig. 1) is located in the root section of the main rotor. Its end facing the rotor mast has a quasi-rectangular shape, whereas the opposite end is of elliptical shape. The pitch horn main function is the introduction of the pitch angle, set by flight controls, into the blade via the torsional stiff control cuff. Lead lag dampers are attached in the area of quasi-rectangular shape.
Pitch horn (Eurocopter Deutschland GmbH)
The lay-up comprises carbon fabric with ±45° fibre direction and unidirectional fibre bands arranged in the circumferential direction to carry both torsional loads into the blade itself and to provide sufficient ring stiffness. Profiles are attached to the part, which induce the torsional loads from the pitch levers. In this area, the wall has a maximum thickness of ∼15 mm. The pitch horn has overall dimensions of ∼400 mm length and an inner diameter between 80 and 150 mm.
Redesign to automation
The prepreg design as realised in the current production consists of ±45° woven fabric alternating with circumferentially arranged UD bands. ‘U’ shaped profiles are embedded in the layers during the lay-up process, creating the pitch lever profiles of the final part. Filler elements are used to ensure a seamless embedment of the profiles in the laminate. Two pitch horn halves are built up in separate negative moulds, in which every layer is manually placed, trimmed to final dimensions and compacted under vacuum. The manufacturing process includes a high degree of manual work.
Redesign measures were undertaken in order to reduce the manufacturing costs. These allow the application of automated preforming procedures. Automated fabric placement necessitated a separation of UD bands and fabrics with a ±45° orientation. This requirement led to a design of fabric plies on the outer and inner surfaces of the part covering the ring stiffening UD bands in the inner section of the part.
A differential approach was developed for the manufacturing and embedment of the pitch lever profiles, which includes separated preforming and infusion of the pitch horn body and the profiles followed by adhesive bonding of the cured elements.
Manufacturing process chain
One primary objective of the process development has been the definition of subprocesses of nearly even time consumption circumventing a bottleneck situation. Therefore, each manufacturing step has been analysed, and development efforts have been concentrated accordingly. The analysis methodology and the results are described later in this article. The preforming process of the pitch horn body basically consists of in-plane manufacturing of four tailored reinforcements (TRs: flat, multilayer cutouts, stitch bonded). Two pairs of TRs are draped and activated on a male mould to form a subpreform creating one-half of the pitch horn final preform. Subsequently, the assembly of the subpreforms in the infusion tool is carried out, and the impregnation stage is conducted (Fig. 2).
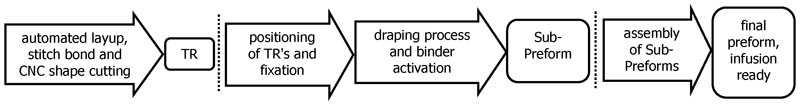
Pitch horn body preforming process chain
Stitching operations produce a local fixation of a layer stack following a defined seam pattern. This pattern greatly influences the drapability of the stack.27 Thus, during its definition, the results of drape optimisation have been considered and implemented as far as manufacturing constraints allowed. Bindered customised non-crimp fabrics are laid-up avoiding strain in the material through synchronised lay-up modules. The stitching operation is carried out automatically based on CAD data both stabilising the edges of the fabric patterns and fixing fabric layers to each other (Fig. 3). The material is transported via a conveyor–belt system to the computer numerical control cutter, where the cutoffs are obtained. Tailored reinforcements of high material quality and handling stability are produced by this continuous, fully automated and reproducible part of the process chain.
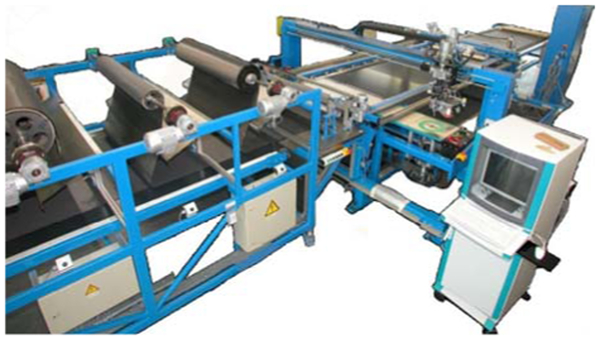
Inline lay-up and 2D stitching modules (Eurocopter Deutschland GmbH)
One subpreform (pitch horn half) is manufactured from two TRs by draping and thermal binder activation. Forming the planar TRs to a complex shaped geometry creates shear deformations within the reinforcement and implies the risk of generating defects like fibre misalignment or wrinkles (through exceedingly high shear deformations). An approach minimising this effect was found using an optimisation algorithm applied to draping simulation parameters as described later in this article. After the draping step, vacuum is installed and binder activation is carried out following an evaluated process window.2 Successful trials have been performed automating this step with a heated deep drawing machine. The resulting subpreforms are relatively rigid and show a high degree of shape stability, making them easy to handle during subsequent assembly and infusion.
Draping process
Drape simulation
The draping of the ±45° layers of the pitch horn component was simulated using the kinematic draping code PAM-QUIKFORM.28 As opposed to finite element method based draping simulations, which need several hours, kinematics draping simulations run in a matter of seconds. This is because the simulation is based mainly on geometries with several assumptions on material behaviour and the effects of the process.29 In the present work, this kind of method was introduced. Thanks to the brevity of a geometric simulation, the use of genetic algorithm (GA) to optimise the draping operation is industrially relevant, and a novel method is presented thereafter. In this type of model, the axial deformation of the tows is considered negligible and shear considered as the main deformation mechanism occurring during the process. The code allows simulation of three variants of the process:
conventional draping in which a drape starting point and a draping direction are defined. These, together with the definition of the tool surface suffice to obtain a unique solution to the drape problem
bias draping in which a stitching line in the bias direction is defined. This line remains undeformed during the process of draping while a definition of a starting point and a direction are required to obtain a unique solution. This type of model is representative of the situation in which the layers of deformable textile are stitched with the unidirectional layers, thus constraining the deformation along the stitching line. In addition, this type of approach can be used to simulate draping of unconstrained material when the process instructions explicitly define a path across the bias direction that is sued to first establish contact between the material and the tool
sequential draping in which different areas of the component are selected, and the process is executed in zones. The first zone is covered with material before the next zone is processed. In this case a unique solution requires the definition of a drape start and direction only for the first zone of draping.
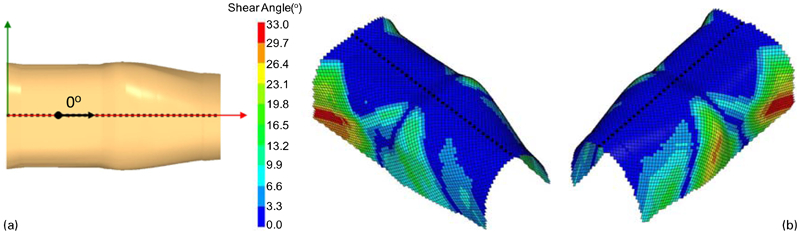
The drape simulation studies reported in this section set the baseline for subsequent optimisation studies. As such, a conventional strategy (baseline study 1) is considered in which the operator starts the draping from the highest point of the geometry shown in Fig. 4a. In subsequent steps, the textile is laid onto the tool so that the tows follow a path with nominal orientation (±45) with respect to the axis of the component as shown in Fig. 5a. In practice, this translates into the operator forcing two orthogonal tows to follow the nominal directions and then moving across the rest of the textile tow by tow until the whole part is covered. The second strategy considered (baseline study 2) involves a stitch line in the bias direction of the textile, which is then placed along the midline of the top side of the component (Fig. 6b). Subsequently, the operator proceeds towards the low side of the component until the middle of the sides is reached. The third variant of drape simulation, which considers draping in a sequence of zones, was only considered in the context of the optimisation studies presented in later sections. It should be noted that similarly to the real process the drape simulation is performed independently to the upper and lower half of the geometry, which are not identical. For brevity, the results presented here as well as in the optimisation section concern one-half of the geometry.
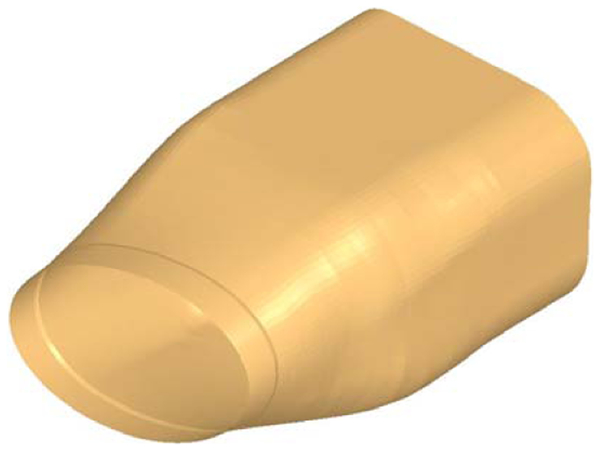
Pitch horn geometry used in drape simulation studies
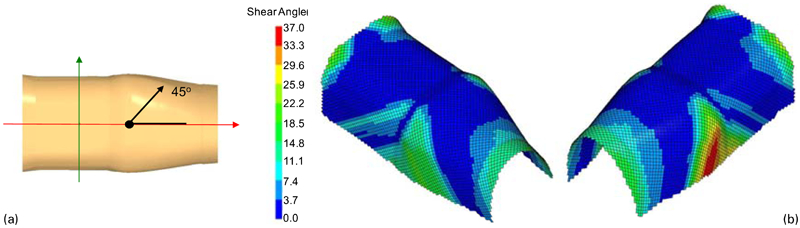
a process set-up; b shear angle distribution and draped pattern
a process set-up; b shear angle distribution and draped pattern
Figure 5b illustrates the shear angle distribution and the draping pattern for half of the pitch horn when the draping starts from the apex of the geometry at a direction of 45°. The region near the apex in unsheared, with the low shear region extending on the top side of both the elliptical and the quasi-rectangular cross-section parts of the geometry. Shear increases towards the lower sides of the area of transition from elliptical to quasi-rectangular cross-section. A maximum shear value of 36·9° is reached on one of the two sides of the transition region, whereas the material draped on the other side undergoes lower shear (about 23°) due to the slight asymmetry of the geometry. Significant shear is also observed at the two ends of the component with values exceeding 20°. This tends to be uniform at the end of the elliptical cross-section part of the geometry as a result of a uniform reduction of cross-sectional area.
The results of curve draping with a stitching line placed on the midline of the top side of the pitch horn are illustrated in Fig. 6. The shear angle distribution differs significantly from the outcome of the conventional process presented in Fig. 5. The unsheared region extends to the whole topside of the geometry as a result of the constraints imposed by the stitching line. The location of the high shear zones changes in comparison to conventional draping, maximum shear occurring at the lower corners of the end of the quasi-rectangular cross-section part of the component. The maximum shear observed is ∼33°, a value 6° lower than that observed in the conventional draping strategy starting from the apex of the pitch horn. This improvement in maximum shear comes at a cost with regard to average absolute fabric shear, as the results of Fig. 6 indicate a more extended area of shear in the 10–20° range than in the conventional draping results presented in Fig. 5.
Drape optimisation
A GA was utilised to optimise the draping process. The parameters of the GA were identical for all problems, i.e. 30 individuals per generation, elite of 4 individuals, a crossover probability of 0·5 and a mutation probability of 0·1. The runs of the GA were duplicated to ensure reproducibility of the results. Referring to actual cost (in terms of licenses), an important consideration is that the current implementation of the GA uses serial calls of PAM-QUIKFORM (it could be parallelised to minimise execution time) and only needs a single license of the software. The objective of the optimisation in all cases was to minimise the maximum shear occurring over the surface of the draping component. Three optimisation problems were solved as follows:
optimisation study 1, which is a conventional draping set-up with design variables including the start point and direction; three design parameters are involved in the optimisation, namely, the in-plane coordinates of the drape start point and the angles of draping with respect to the axis of the component
optimisation study 2, which involves a bias curve and addresses the selection of position and direction of the stitch line; similarly to problem 1, three parameters are involved in the design problem, i.e. in-plane coordinates of the curve position and direction of the curve
optimisation problem 3 involves both curve draping and zones; the direction of the stitching line is considered constant and parallel to the axis of the pitch horn component, whereas the optimisation considers the in-plane position of the bias curve and the position of the boundary along the length of the geometry resulting in three design parameters; it should noted that two zones are considered with a boundary that is parallel to the ends of the pitch horn.
The results of optimisation case study 1 are illustrated in Fig. 7. The GA converges within 8–10 generations, which corresponds to ∼300 executions of the kinematic code. The final solution involves a draping start in the quasi-rectangular cross-section area and slightly off the axis of the component, reflecting the small asymmetry of the geometry. Furthermore, the initial fibre direction is about 8° off the nominal direction of 45°. The draped pattern differs from that of baseline case 1, with maximisation of shear in three areas. One of these is close to where shear is maximised in the baseline case in the transition zone of the component (Fig. 5a). The other two areas of high shear in the low corner of the quasi-rectangular cross-section end and the top of the elliptical cross-section area are in locations of low shear for the baseline case. The optimised solution has a maximum shear angle of ∼20°, showing a benefit of 17° from the conventional apex drape designed.
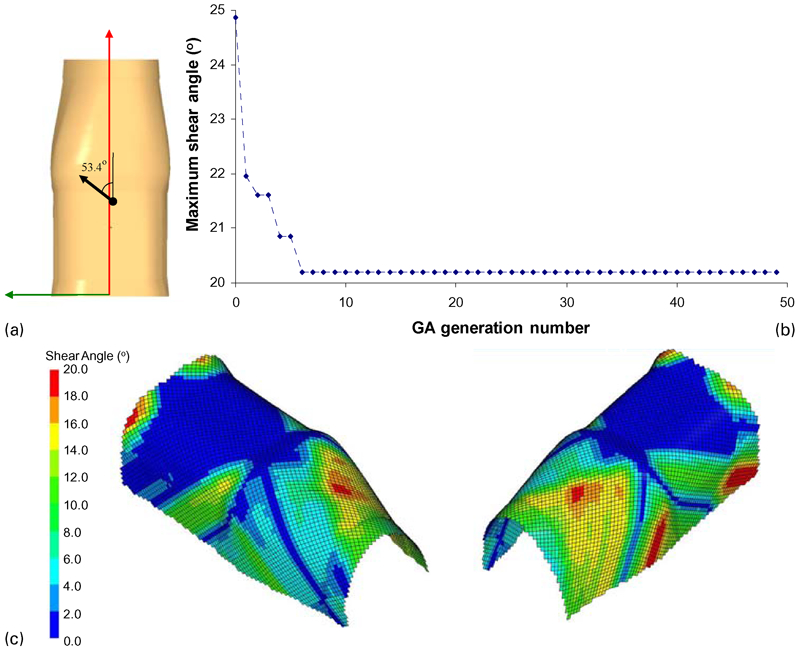
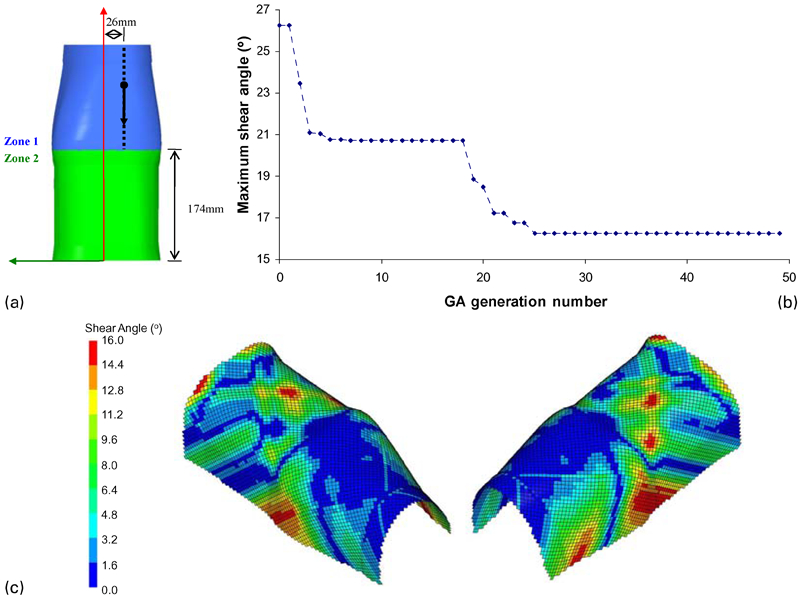
a drape set-up of final solution; b convergence of the GA; c draped pattern and distribution of shear angles
The results of optimisation study 2, which involves selection of the bias curve start and direction to minimise maximum shear, are illustrated in Fig. 9. The process proposed by the optimisation algorithm is radically different from the conventional process, as the stitch line is oriented in the normal to the axis direction and is located near the end of the component in the quasi-rectangular cross-section part of the geometry. The GA converges to this solution within ∼40 generations or 1200 PAM-QUIKFORM executions. As a result of the new position and direction of the bias curve, most of the quasi-rectangular section part of the component undergoes relatively low shear, while shear is maximised on the top of the geometry near the end of the elliptical cross-section part. The distribution of shear is significantly different from the corresponding baseline case (Fig. 6) where shear is maximised on the sides of the component in the quasi-rectangular cross-section area. The maximum shear reached is ∼22°, which is an improvement of ∼10° over the baseline case.
The case of minimisation of shear by selecting the position of the bias curve and the boundary of two draping zones and keeping the direction of the bias curve parallel to the length of the component is presented in Fig. 8. The GA converges to the solution within ∼30 generations or 900 kinematic code runs. The process design resulting from the optimisation involves draping in the elliptical cross-section region first, followed by draping in the rectangular cross-section part of the component. The bias curve starting point is ∼25 mm away from the centreline of the component. High shear occurs on the sides of the part near the transition region, in contrast to the baseline case where shear is maximised in the corner of the quasi-rectangular cross-section part of the geometry. Maximum shear is ∼16°, showing a significant reduction of ∼16° from the base case, which involved bias draping along the centreline and no zones. A comparison of the results of this optimisation study with the result of optimisation study 2 shows the potential benefits of the use of sequential draping, which results in additional process design flexibility that can be exploited to improve the outcome.
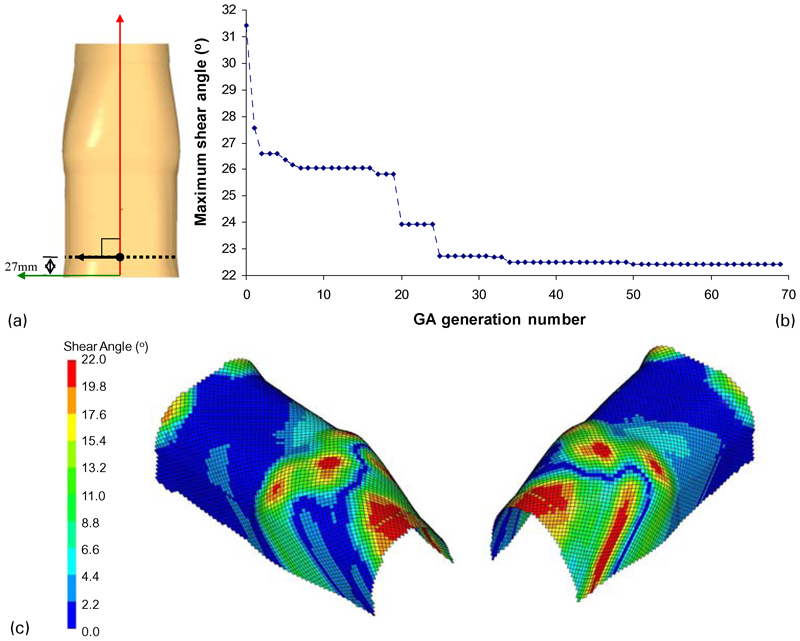
a drape set-up of final solution; b convergence of GA; c draped pattern and distribution of shear angles
a drape set-up of final solution; b convergence of GA; c draped pattern and distribution of shear angles
Cost analysis
Cost model
Cost analysis was performed with the aim of ensuring specified quality at minimum cost using an LCM process alongside semiautomated preform production. The analysis is based on the principles of ABC methodology.
The ABC methodology is a costing method that derives the product's cost as a sum of the costs of all activities involved in making a product. These activities may refer to a single process or to a production line. An overview of the ABC method is shown in Fig. 10.
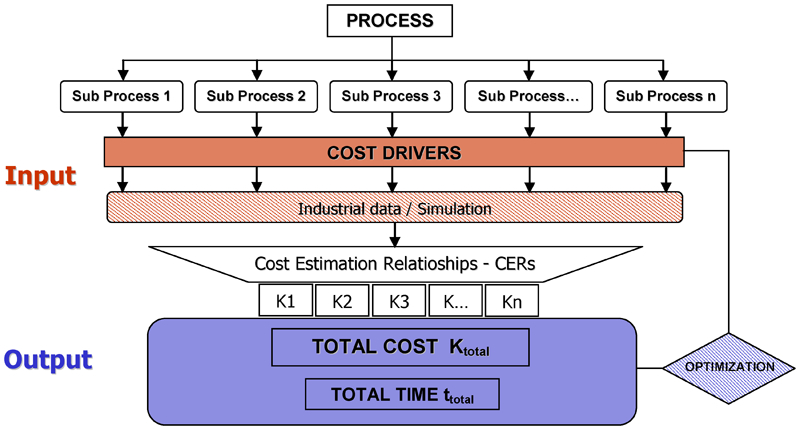
Activity based costing concept loop8
In general the ABC method consists of the following four steps:
identification of the activities or transactions that cause costs during the product development (subprocesses and main processes)
identification of the cost drivers to each subprocess
assignment of costs to each subprocess via the creation of the cost estimation relationships (CERs)
summation of the costs of subprocesses that occur.
Cost analysis and results
Using industrial cost and process data provided by the manufacturer, the LCM process was divided into subprocesses, as shown in Fig. 10. Subsequently, the basic cost drivers were determined for each subprocess.
After the process cost drivers have been identified, mathematical functions that express their relation to the consumption of the resources, the CERs, are formulated. These functions were extracted from the analysis of statistical, experimental or empirical data.
All CERs are derived by means of regression analysis of the process data supplied by the industry partner. However, the regression analysis performed is mainly based on linear functions due to limited availability of process data. The total cost of the component is calculated as the sum of costs referring to the various subprocesses. It is worth noticing that, although the main target is to estimate the recurring costs, the depreciation cost of the machines used Kcap is taken into account at the final step of the estimation. However, the depreciation model used is linear as it relies on initial process data due to the early stage of the process under analysis. Furthermore, it has to be mentioned that no learning curve effects are taken into account since the process examined is under development and thus in a very early stage for accounting for a learning curve.
Using the CERs, each parameter's contribution to the total part cost was evaluated. In addition, the major cost and time consuming substeps of the production process were investigated in order to identify and improve the critical subprocesses and their respective process parameters.
Figure 11 illustrates the distribution of cost and time consumption for the sub processes.
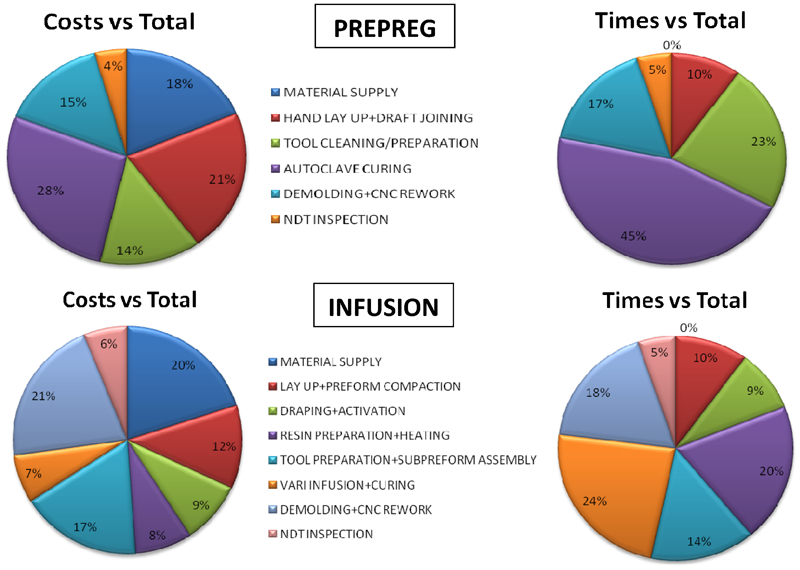
Fractional costs of subprocesses for prepreg routine (upper) and preforming routine (below)
As it can be seen in Fig. 11, the lay-up costs arising during the prepreg process are much higher compared to the infusion respective cost, since high fraction of the manual work is significantly reduced with the latter. Moreover, the prepreg curing cost is appreciably high, which is attributed to the costly use of the autoclave. On the other hand, the demoulding and computer numerical control rework is marginally more intensive at the infusion process due to typical necessary part optimisation.
Regarding the time fractions, the most important conclusion is the nearly even distribution of subprocess times for the infusion process, leading to avoidance of any manufacturing ‘bottleneck’ usually observed in composites processing. In addition, the fact that autoclave curing is the most time consuming step of the prepreg solution is more than obvious, which leads to total process time much higher levels than infusion.
Conclusion and discussion
Novel methods to simulate a preforming process for fibre reinforced parts and to analyse the process costs have been developed and applied. They served as substantial support during process development in industrial environment.
Draping simulations and the optimisation of the draping process by means of an iterative determination of its optimal parameters helped to reduce lead time and the risks of industrialisation (‘first time right’ principle). Late design changes could be managed easier, and a high degree of process understanding and maturity was created during the process development phase. Regarding the applicability of the modelling/optimisation side of the work, this approach could be applied to anything that can be defined as a draping problem. However, limitations due to the kinematic algorithm both in material and in process modelling will exist.
Furthermore, drape simulation and optimisation helped to improve preform and part properties by finding the design for stitch pattern and draping strategy providing minimal distortion of the fibre architecture. However, it has to be noted that the determination of the actual fibre orientation of the preform has not yet been validated with a standardised method. In addition, constraints of the available manufacturing technologies have to be considered during the optimisation of the draping process. Sequential draping, for example, can only be conducted in an automated routine with a certain complexity. It is the objective of current R&D projects to increase the degree of freedom for automated draping technology. Still, the potential of further benefits that can be expected from the global development process perspective is immense. One can think of using the methods described not only to avoid manufacturing problems but also to manufacture in order to achieve the design objectives. To be specific, instead of targeting the minimisation of the shear or the alignment of the fibre s in a given zone as optimisation criteria, the process parameters could be searched through the optimisation of stiffness and strengths in given regions or even through the minimisation of displacement under a certain load. This can increase the degrees of freedom for sequential preforming routines towards a tailored fibre orientation. A comparable approach was for example developed in the field of resin transfer moulding process.30 In this work, a numerical method is proposed to calculate the injection flowrate in order to minimise the micro- and the macrovoids; since the stiffness and strength are related to those porosities, one can relate the mechanical characteristics of stiffness and strength to the injection machine commands instructions. The methods proposed in the current paper can certainly be extended in the same direction as Ref. 30.
The cost analysis was applied to estimate cost savings and to focus optimisation work within the manufacturing process chain. The main cost driving process steps could be identified, and development efforts could be concentrated aiming on even cycle times for each subprocess. The main cost drivers of the prepreg process (Fig. 11 upper), hand lay-up and autoclave cure, have been substituted by preforming routines with a higher degree of automation. The overall cost savings were estimated with ∼20%.
The cost analysis served to identify the main cost drivers of a component, thus helping to focus on the critical subprocesses. The impact of changes in the process can immediately be quantified, the lead time can be exploited efficiently and development efforts can be concentrated on the process’ cost drivers. Exact input data, however, are necessary for a successful process analysis, but these data are difficult to gather during development processes with novel technological approaches and have to be carefully estimated in advance.
Footnotes
Acknowledgements
The work was conducted within the EU project PRECARBI, which was funded within the sixth framework programme. The authors wish to thank for financial support.