
Abstract
Thermal properties, mechanical properties, and morphology of poly(vinylidene fluoride) (PVDF), ethylene–vinyl acetate copolymer (EVA) and their binary blends with different blending ratios were studied. The results of differential scanning calorimetry (DSC) indicated that the peak crystallization temperature of PVDF did not change much as the EVA content varied. With the addition of EVA, crystallinity of PVDF varied from 41·0 to 51·1% and crystallinity of EVA changed from 4·0 to 4·9%. With regard to thermogravimetric analysis (TGA), the temperature at which 5% weight loss occurred increased as PVDF content increases. As the EVA content increases, the tensile strength and elongation at break firstly exhibit a decreasing trend up to the content of 50 wt-% EVA, however, this is followed with an increase with further addition of EVA. Melt flow rate (MFR) of blends increased with EVA content.
Keywords
Introduction
Polymer blends play a significant role in preparing high performance materials. Properties of blends are mainly determined by its structure. The study on binary polymer blends containing crystalline polymer has received more attention from both scientific and technological viewpoints. For these blends, miscibility, morphology, and crystallisation behaviour have been widely investigated.1, 2 Poly(vinylidene fluoride) (PVDF), as a semicrystalline polymer with excellent physical and chemical properties, is able to crystallise to at least four different forms: α, β, γ and δ form. 3 The crystallisation behaviour of PVDF depends on not only crystallisation conditions but also the other components in blends.4, 5 PVDF has been widely used in many applications because of its special structure and exceptional performance, 6 such as membrances7, 8 and piezoelectric materials. 9 The miscibility is related to specific interactions between polymer components, such as hydrogen bonds and polar force, which can be reflected by the crystallisation behaviour of blends and macroscopic properties. In addition, morphology is always determined by miscibility and crystallisation behaviour of blends. Therefore, the research on crystallisation behaviour of crystalline components becomes more important in the binary blends system. There have been numerous reports of crystallisation and melting behaviours of PVDF/amorphous polymer blends, including PVDF/poly(methyl methacrylate) (PMMA), 10 PVDF/poly(vinylpyrrolidone) (PVP), 11 PVDF/poly(styrene-co-acrylonitrile) (SAN) 12 and PVDF/poly(vinyl acetate) (PVAc). 13 Gregorio 14 has discussed the effect of PMMA addition on the solution crystallisation of the α and β phases of PVDF. It is confirmed that addition of PMMA reduces the crystallization temperature of the α phase and PMMA at 10 and 15 wt-% favours crystallisation of the β phase. Xia's 15 results show that acrylonitrile segment in SAN copolymer is partially miscible with PVDF and blended SAN in solution could decrease the content of β-phase of PVDF. With an increase in the PVP content, the interaction between segmental PVDF and PVP in the beginning transforms the crystalline state of PVDF from α to γ phase, and finally results in the disappearance of crystalline PVDF phases. 11 In their papers, the other polymer component is usually amorphous with carbonyl group or other polar group. Thus, it is of high interest to incorporate crystalline/semi-crystalline polymer component, and investigate the structure–properties relationship of PVDF/crystalline polymer binary blends.
Ethylene–vinyl acetate copolymer (EVA) is a random copolymer consists of ethylene and vinyl acetate (VAc). The properties of the EVA are mainly caused by the crystallinity of the EVA which depends on the VAc content.16, 17 When the VAc content is low, the copolymer is more akin to polyethylene, but for high VAc content the pendent acetoxy is excessive enough and prevents adjacent polyethylene chains packing into the crystal lattice. 18 Ratnam 19 has studied the potential of EVA as an impact modifier for isotactic polypropylene(PP). EVA is a good impact modifier for PP, at both ambient and low temperature. Moulding process of PVDF is not easy because of its low flowability. Blending PVDF with EVA could modify PVDF fracture toughness, processibility. Therefore, this work has important academic significance and practical value.
Since carbonyl group could give rise to hydrogen bonds with PVDF, we expect that the carbonyl in EVA could improve the properties of PVDF and PVDF/EVA blends with different ratios are prepared in this paper. The present work investigates the effect of blend ratios on the crystallisation behaviour and the thermal decomposition of PVDF/EVA blends. The thermogravimetrical analysis (TGA) was carried out to discuss the role of each component played on thermal decomposition. Crystallisation behaviour was evaluated via differential scanning calorimetry (DSC) and wide angle X-ray diffraction (WAXD). Melt flowrate (MFR) was used to characterise the melt flowing of PVDF/EVA blends.
Experimental
Materials
PVDF powder (Kynar K-761,
 was purchased from Elf Atochem of North America Inc. (USA). EVA grain (KA-31, VAc = 28 wt-%) with melt flow rate of 7·0 g/10 min (190°C and 2·16 kg) was supplied by Sumitomo (JPN).
Sample preparation
PVDF/EVA blends with different PVDF/EVA mass ratio (100/0, 70/30, 50/50, 30/70, 0/100) were prepared in the torque rheometer (Shanghai Kechuang XSS-300, PRC). Speed of the torque rheometer was maintained at 60 rev min−1. The temperature in the torque rheometer was kept at 180°C. A series of sheets (2 mm in thickness) were prepared by compression moulding at 180°C for 15 min under a 10 MPa pressure followed with cooling to room temperature under a pressure of 10 MPa.
Characterisation
Differential scanning calorimetry (DSC)
To analyse the melting and crystallisation behaviours of neat polymers and their blends, differential scanning calorimetry (TA Q200, USA) was used. Nitrogen purge gas at a constant flow rate of 50 mL min−1 was used to prevent thermal degradation of samples. The samples were heated from room temperature to 200°C at 40°C min−1 and kept for 2 min at this temperature to erase thermal history. Then the crystallisation process of the blends was cooled to 0°C at a controlled rate of 5 K min−1. After holding the samples at 0°C for 2 min, the melting tests were scanned at a heating rate of 10 K min−1 from 0 to 200°C. The second melting curve was recorded to calculate the crystallinity. Weight of each sample was about 10 mg.
Glass transition temperature of the samples was also measured by DSC (TA Q20, USA). Neat polymers and blends were heated quickly from room temperature to 190°C in order to erase thermal history. After thermal insulation for two minutes, samples were quickly quenched to −90°C. Then samples were heated to 50°C at a rate of 10 K min−1.
Thermogravimetric analysis (TGA)
Thermogravimetric analysis (TA Q50, USA) was carried out in a nitrogen atmosphere and the constant flow rate of nitrogen purge gas was 50 mL min−1. The temperature increased from room temperature to 700°C at a heating rate of 20 K min−1.
Fourier transform infrared spectra analysis (FTIR)
The infrared absorbance spectra of neat polymers and their blends were recorded in the wave region of 4000–600 cm−1 by using a FTIR spectrometer (Nicolet iS5, Thermo Fisher, USA). The resolution is 4 cm−1.
Wide angle X-ray diffraction (WAXD) measurement
WAXD (Shimadzu XRD-6000, JPN) was used to evaluate the crystalline microscopic structure of blends with Cu K α X-ray. The radiation source was operated at 40·0 kV, 30·0 mA. Scanning angle ranged from 10 to 50° and the scanning speed was 5° min−1.
Scanning electron microscope observation (SEM)
The scanning electron microscope (JSM-5900, JEOL, JPN) with an accelerating voltage of 15 kV was used to observe the morphology and investigate the relationship between microstructure and properties of the samples. The samples were cryogenically fractured in liquid nitrogen and then were sputter coated with a thin conductive layer of gold to prevent charge accumulation.
Mechanical tests
Tensile strength and elongation at break data were tested with a universal testing machine (CMT5254, Shenzhen SANS testing machine, Co., Ltd, PNC) at rates of 10 mm min−1, following ISO 527.
Melt flow rate (MFR)
Melt flow rate was tested by a melt flow indexer (XNR-400A, Changchun Second Factory, PRC). The test condition was controlled at 230°C under 5 kg (PVDF) and 190°C under 2·16 kg (EVA and blends), according to ASTM D 1238.
Results and discussion
DSC analysis
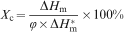
DSC curves of different blends are shown in Fig. 1. Two obvious peaks can be observed in both cooling and heating curves of blends, representing crystallisation peak and melting peak of PVDF and EVA. The detailed parameters are listed in Table 1. The crystallinity of PVDF and EVA are recorded as below
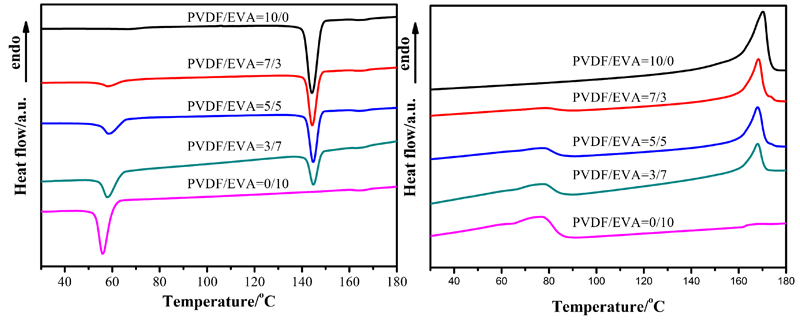
DSC scans showing crystallisation and melting traces of PVDF/EVA blends with different mass ratios
DSC data of binary blends containing PVDF and EVA*
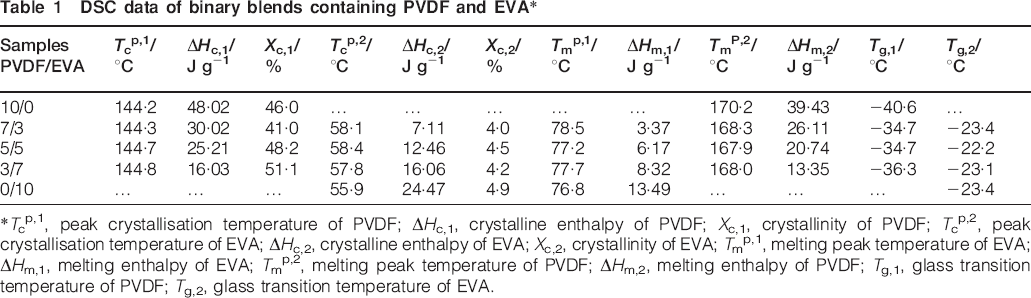
*Tcp,1, peak crystallisation temperature of PVDF; ΔHc,1, crystalline enthalpy of PVDF; Xc,1, crystallinity of PVDF; Tcp,2, peak crystallisation temperature of EVA; ΔHc,2, crystalline enthalpy of EVA; Xc,2, crystallinity of EVA; Tmp,1, melting peak temperature of EVA; ΔHm,1, melting enthalpy of EVA; Tmp,2, melting peak temperature of PVDF; ΔHm,2, melting enthalpy of PVDF; Tg,1, glass transition temperature of PVDF; Tg,2, glass transition temperature of EVA.
It is clear to see that the crystallisation peak temperature and melting peak temperature of PVDF and EVA in blends do not change much compared with the neat polymers. The melting peak temperature of both PVDF and EVA appear to be higher than the value of the crystallisation peak temperature. For binary blends, the crystallinity of PVDF increases from 46·0 to 51·1% while the crystallinity of EVA does not change significantly as the EVA content increases. Perhaps EVA plays a nucleation effect on PVDF crystallisation, and thus promotes the crystallinity. 22 With regard to the crystallisation peak temperature, the value of EVA is slightly lower than that in blends. It is reported that the depression of the melting point of a crystalline polymer component in a blend provides important information about its miscibility. When two polymers are miscible in the melt, the chemical potential of the crystallisable polymer is decreased due to the addition of the second component. This leads to a reduction in the equilibrium melting temperature with increasing amorphous polymer content. However, an immiscible blend will typically not show depression of the equilibrium melting point. 23 The analysis suggested that PVDF and EVA blends are partially compatible.
The Tgs (Tg defined as the glass transition temperature) that reflects the miscibility of blends can be obtained from Fig. 2. The glass transition temperatures of PVDF is around −40°C. 24 The beta transition of EVA occurs near −25°C and remains nearly independent of composition until the polymer contains so much vinyl acetate that the polymer is no longer crystalline. 25 The glass transition temperature of each component in blends does not change too much compared with that of neat PVDF and EVA. The result indicates that there is no strong interaction between PVDF and EVA.
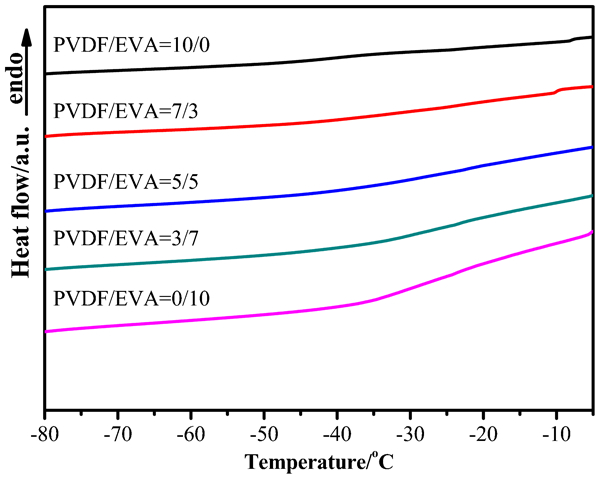
DSC curves of PVDF/EVA blends for measuring glass transition temperature
TG analysis
Figure 3 shows the TG and the corresponding derivative curves (DTG) of PVDF, EVA and their binary blends respectively. As expected, the TG curve of EVA shows, two stages of EVA decomposition:26, 27 an acetate pyrolysis of the copolymer leaving a polyunsaturated linear hydrocarbon and evolving mainly acetic acid, followed by the breakdown of the hydrocarbon backbone to produce a large number of straight chain hydrocarbon products. 28 The amount of acetic acid removed from EVA segment is corresponded with the vinyl acetate (VAc) content in EVA sample.
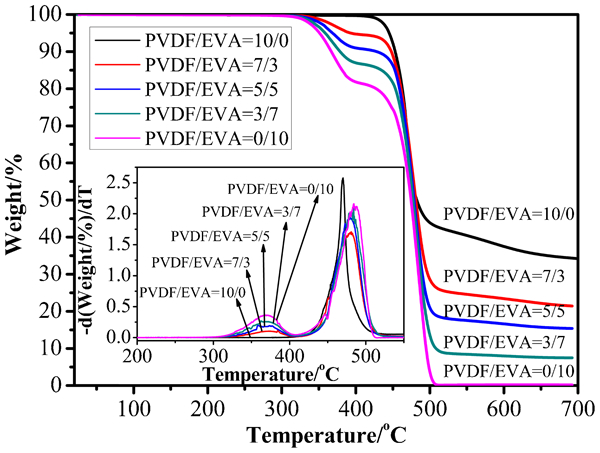
TG and DTG curves of PVDF/EVA blends
The first step weight loss in TGA experiments is not detected up to temperatures above 370–400°C. This corresponds to pyrolysis of acetic ester groups of the vinyl acetate with elimination of acetic acid. 29 The second step weight loss occurs in the range of 450–520°C for the samples composed of PVDF and EVA, which is due to the decomposition of PVDF and of the residual EVA after the first stage of decomposition.
Table 2 shows the data from the TG analysis. Tonset is the temperature at which 5% weight loss occurs and Tmax corresponds to the maxima in the derivative TGA curve.
30
It can be seen that the Tonset and Tmax,1 of blends become lower with the addition of EVA, whereas, Tmax,2 of PVDF is lower than EVA and binary blends. The results suggest that EVA decrease the stability of PVDF. Coats-Redfern equation has been used to calculate the degradation activation energy Ea.
31
The experimental thermogravimetric curve transformed as log [−ln(1−α)/T2] versus T−1, where α is the reaction fraction. Ea is computed by the equation as follows

TGA data from dynamic runs*
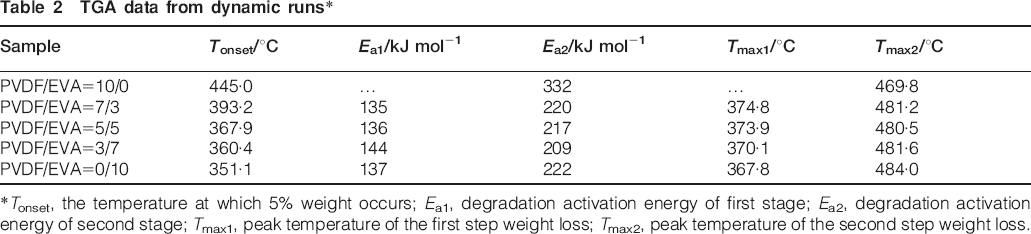
*Tonset, the temperature at which 5% weight occurs; Ea1, degradation activation energy of first stage; Ea2, degradation activation energy of second stage; Tmax1, peak temperature of the first step weight loss; Tmax2, peak temperature of the second step weight loss.
FTIR spectra analysis
FTIR and WAXD have been used to identify peaks of characteristic groups and the crystalline phase. Figure 4 shows the absorption spectrum of various samples ranging from 4000 to 600 cm−1. The peaks at 976, 854, 795 and 764 cm−1 are peaks of the α-phase of PVDF. No obvious characteristics peaks of β-phase or other phase of PVDF can be observed from the curves. The result may be caused by the thermal history of the sample preparation. 32 The apolar α phase predominates at melt crystallisation below 160°C. 33 By comparison with PVDF, it can be seen that the absorption at 2918, 2850, and 1738 cm−1 are clear. These peaks assign to the asymmetric or symmetric vibration of aliphatic group CH2 or CH3 and C = O deformation vibration, respectively. 34 In addition, there are no new peaks in the PVDF/EVA blends compared with the neat samples. Therefore, it can be verified no reactions and no phase changes exist in PVDF/EVA blends.
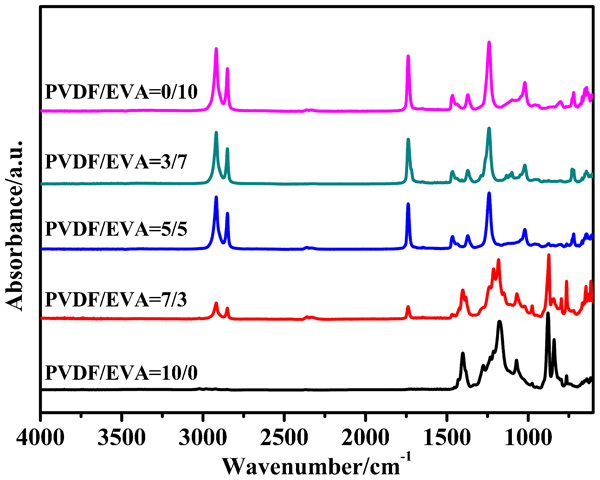
FTIR spectra of PVDF, EVA and their binary blends
WAXD
The Bragg formula has been given as follow to calculate the distance dhkl

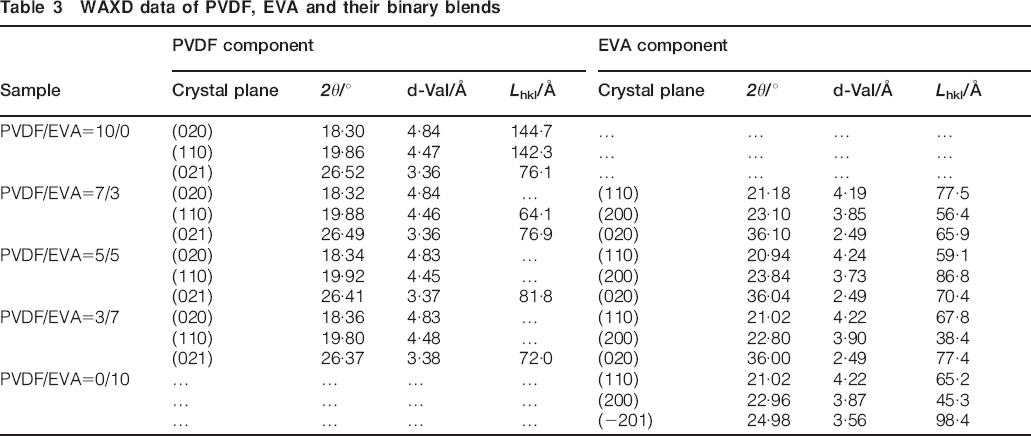
Figure 5 shows the XRD pattern of different samples and correlative diffraction data have been shown in Table 3. The strongest three peaks 2θ in PVDF appear at around 18·3, 19·9 and 26·4°, corresponding to the superposition of (110), (020) and (100)35, 36 respectively. No typical peaks of β phase can be observed in the XRD pattern of PVDF, which is consistent with the FTIR result. The presence of these characteristic crystalline peaks of PVDF in the blends clearly indicates that the crystalline structure of PVDF is not affected by the addition of EVA. The characteristic orthorhombic crystal phase diffraction peaks at about 21° and typical monoclinic phase peaks at about 23° represent the (100) and (200) crystal plane respectively. Moreover, addition of PVDF results in appearance of orthorhombic crystal phase diffraction peak at 36° representing the (020) crystal plane.37, 38
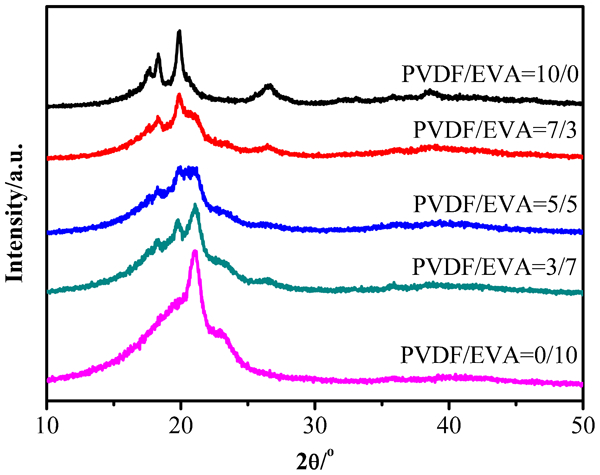
X-ray diffraction patterns of PVDF, EVA and their binary blends
WAXD data of PVDF, EVA and their binary blends
Miscibility of PVDF with EVA
The cryogenically fractured surface of various samples examined by SEM is shown in Fig. 6. It is reported that the miscibility of PVDF and polymers which contain carbonyl group is always good. This is mainly due to the polarity between CF2 group and carbonyl group.11, 39, 40 Carbonyl group in EVA is a weak polar group and the interaction between PVDF and EVA will be influenced by the quantity of carbonyl group (VAc) content. As can be seen in Fig. 6, the morphology of blends changed significantly with the increasing EVA content. No obvious phase separation and spherulite can be observed in the given SEM images. The fractured surface of neat samples is smoother than blends. It can be seen that PVDF/EVA = 7/3 blends differ from the other four samples and has poorer compatibility. When the EVA content is low, the polarity of EVA is weak and interaction between PVDF and EVA is poor, which results in poor compatibility of blends.
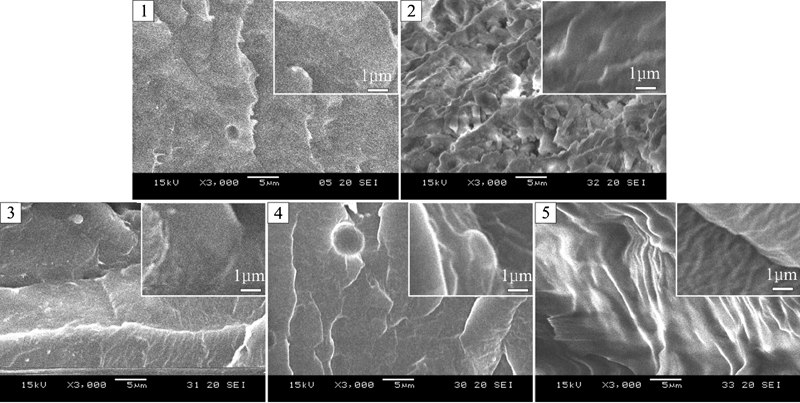
Image (SEM) of PVDF/EVA blends with different mass ratios: 1, 10/0; 2, 7/3; 3, 5/5; 4, 3/7; 5, 0/10
Mechanical properties
The tensile strength and elongation at break are shown in Fig. 7. Blends containing 30 wt-% PVDF are ductile, whereas PVDF and PVDF/EVA blends containing 50 and 70 wt-% PVDF are more brittle. Tensile strength of the blends is lower than that of neat PVDF and EVA. However, elongation at break has increased from 172 to 491% when the mass ratio of PVDF/EVA is 3/7. This result is consistent with the exceptional crystallinity and Ea,2 value at this composition. However, when the mass ratio of PVDF/EVA are 7/3 and 5/5, elongation at break are poorer than that of other samples, indicating the poor compatibility. Figure 6–2 indicates a sea–island structure, while the Fig. 6–3 might be caused by a dual continuous phases. 41
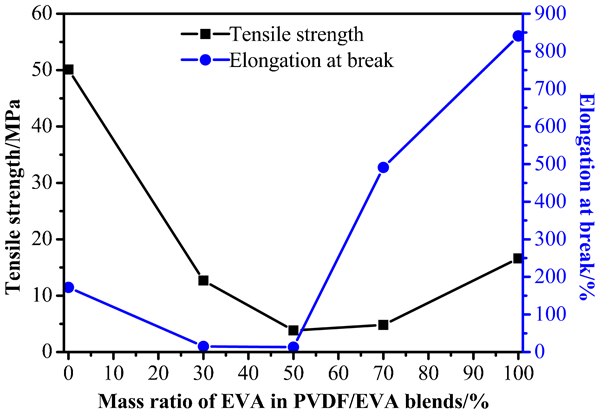
Tensile properties of PVDF/EVA blends
Melt flow rate (MFR)
MFR has been used to evaluate the processability of PVDF, EVA, and their binary blends and the result has been listed in Table 4. It can be seen that MFR was almost linearly related with the EVA content. MFR of neat PVDF was 0·9 g/10 min (230°C and 5 kg). As the content of EVA increased from 30 to 70 wt-%, the MFR increased from 0·7 g/10 min to 3·8 g/10 min (190°C and 2·16 kg). EVA was a resin with good processability and the incorporation of EVA improved the flowability of PVDF.
MFR of PVDF, EVA and their binary blends
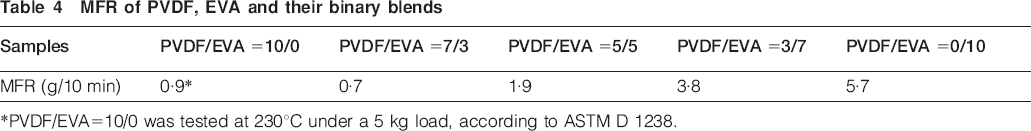
*PVDF/EVA = 10/0 was tested at 230°C under a 5 kg load, according to ASTM D 1238.
Conclusions
There was a mutual correlation among the structure, thermal and mechanical properties of blend. The value of degradation activation energy indicated that the removal of acetic acid from the segment of EVA was easier than the second-step weight loss related to EVA degradation. Blends containing 30 wt-% PVDF were ductile and the elongation at break had increased from 172 to 491% compared with that of neat PVDF. From SEM images, no distinct phase separation can be observed. However, with the incorporation of 30 phr EVA, the surface became more rough. The results of FTIR and WAXD suggested that no strong interactions exist in PVDF/EVA blends and no obvious crystal transition appeared. MFR of the binary blends were enhanced with EVA content. PVDF/EVA blends possessed better flowability compared with neat PVDF. So far, what puzzles us is that due to the poor compatibility between PVDF and EVA component, the properties are poor, especially for the mechanical properties. Compatibilization is being carried out, which would be performed in our further work.
Footnotes
Acknowledgements
This research was supported by the Priority Academic Program Development of Jiangsu Higher Education Institutions (PAPD).