
Abstract
Electrical, thermal and mechanical properties of conductive polymer composites were investigated in the present work. The composites were polyamide-6 (PA6)/stainless steel fibre (SSF) (PA6 matrix filled by SSFs) and PA6/SSF/CNT (PA6 matrix filled by SSFs and carbon nanotubes) systems. The distribution of fillers in the composites was observed by scanning electron microscopy. The relation between the resistivity of the composites and the mass fraction of fillers was determined, and the conductive percolation threshold value was approximately evaluated according to the sudden dropping of the resistivity. Thermal and mechanical properties of the composites were investigated by means of dynamic mechanical analysis, thermogravimetric analysis and differential scanning calorimeter analysis.
Keywords
Introduction
In recent years, conductive filler/polymer composites have been widely investigated in academia and industry because of their extraordinary properties.1–3 In most cases, highly conductive fillers are added to the polymer matrix to provide a three-dimensional network of fillers throughout the composite. The resulting composite material often exhibits a percolative behaviour with respect to mass fraction of fillers.4, 5 It has been reported both experimentally and theoretically that the percolation threshold strongly depends on the aspect ratio (length/diameter) of the fillers.6–9 Conductive fillers include metal wires (MWs), carbon black (CB), graphite and carbon nanotubes (CNTs), which differ greatly in both structure and shape.10–14 Those polymer composites exhibit different performances with different filler types and contents.
Many researchers investigated conductive behaviour, resistance temperature characteristics, structure, morphology and thermal and mechanical properties of conductive polymer composites. For example, Meincke et al. analysed the mechanical properties and electrical conductivity of CNT filled polyamide-6 (PA6) and its blends.15 Weber and Kamal investigated different models of the electrical conductivity of polymer composites reinforced with conductive fibres, and they believed that only the percolation theory is able to accurately model the conductive behaviour of an actual composite by comparing experimental data with predictions from the various models.16 Dweiri and Sahari investigated the electrical conductivity of polypropylene (PP)/graphite composites and PP/graphite/CB. They concluded that conductivity experimental data of PP/G composites were correlated to theoretical model proposed by McLachlan, and a two-dimensional computer simulation to numerically compute the electrical conductivity based on digital image analysis was found to be somewhat useful to describe the mechanism of conduction in PP/G/CB composites and to determine the critical factors in developing high electrically conductive composites.17 Panwar and Mehra studied the electrical and dielectric properties of styrene-acrylonitrile/graphite sheet composites. They found that those composites have large dielectric constant and high conductivity, and may be applied to embedded capacitor.18 Naficy and Garmabi investigated the effective parameters on mechanical and electrical properties of composites of PP/PA6 filled by CB. They used the Taguchi method to optimise the effects of processing and material parameters on the electrical and mechanical properties, and found that the strength of the materials is increased by up to 80% compared to pure PP.19 Jimenez and Jana prepared electrically conductive polymer nanocomposites of polymethylmethacrylate and carbon nanofibres by chaotic mixing. Their study showed that electrical conductivity is sensitive to the time of mixing, especially at nanofibre loadings around percolation thresholds.20 Liang et al. investigated the microstructure and properties of PP composites filled with silver and CNT nanoparticles. The experimental results shows that annealing treatment of PP/Ag nanocomposites led to the formation of voids and microcracks in PP matrix as a result of structural transformation of PP. Such transformation also deteriorated the electrical properties of PP/Ag nanocomposites. The addition of a small amount of MWNT promoted significantly the electrical properties of PP/Ag/MWNT hybrid composites.21
Usually, thermal and mechanical properties of polymer composites are studied by dynamic mechanical analysis (DMA), thermogravimetric analysis (TGA) and differential scanning calorimeter (DSC) analysis, and contrasted with pure polymer.22–25 Those results shows that the addition of fillers will change the storage modulus, loss factors and melting enthalpy of composite to some degree compared to the pure polymer.
All above researches mainly focused on the composites filled by nanoscale fillers, such as carbon fibres, carbon nanofibres and graphite. In recent years, some researchers try to prepare higher performance conductive composites, in which short stainless steel fibres (SSFs) and CNTs are chosen as fillers. However, few researches on the related electrical and mechanical properties of the composites with such multiscale mixed fillers have been reported.
In this study, SSFs (micrometre scale) and multiwalled CNTs (MWCNTs, nanoscale) were added into PA6 matrix to form conductive composites. The conductivity of the materials with different mass fraction was investigated. The morphology and thermal and mechanical properties of PA6/SSF/CNT composites were characterised by SEM, DMA, thermogravimetric analyser (TGA) and DSC analysis. Quantitative analysis of the effects of mass fraction of mixed fillers on viscous dissipation peak for the composites has been carried out. To our knowledge, the results obtained in this study are helpful for the design of electrical and mechanical properties of such conductive composites.
Experimental
Materials and sample preparation
The PA6 (density, 1·1 g cm−3; Tm, 230°C; elongation, 35%) used in this work was produced by Nanjing Dellon Plastics Alloy Co. Ltd (China). The SSFs (diameter of 12 μm and length of 5 mm) were supplied by Hunan Huitong New Material Co. Ltd (China). Multiwalled CNTs were supplied by Chengdu Organic Chemistry Co. Ltd, Chinese Academy of Sciences. The diameters of MWCNTs are ∼30 nm, the lengths are 10–30 μm and the purity of MWCNTs is >85% after purification.
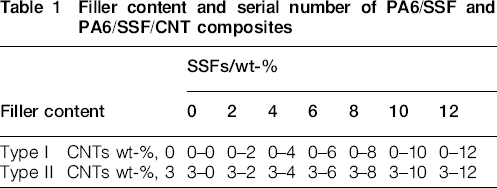
Stainless steel fibres, CNTs and PA6 were mixed in plastic refining machine (10D6 mixer) at 260°C for 10 min and then injected into a mould to form plate with a thickness of 3 mm. Two types of composites were prepared in this study: type I specimens were PA6/SSF systems, and type II specimens were PA6/SSF/CNT systems. Mass fraction of fillers was listed in Table 1. In order to reduce the contact resistance and ensure good contact, silver paste was coated as electrodes on upper and bottom surfaces of specimens.
Filler content and serial number of PA6/SSF and PA6/SSF/CNT composites
Morphology observation
The morphology of the samples was examined by Hitachi S-4800 field emission SEM. E-1045 ion sputtering device (ION SPUTTER, Hitachi) was used to sprayed platinum to the cross-section of each specimen.
Characterisations
The direct current (dc) electrical resistance R was measured by a two-probe method. The volume resistance was measured using a VC890D digital multimeter (Shenzhen Shengli Electronic Technology Co. Ltd, China) under a dc voltage of 10 V when the volume resistance was <106 Ω. When R exceeded 106 Ω, it was measured by high impedance meter (ZC36, Shanghai Anbiao Electronics Co. Ltd). The electrical resistivity of the specimens ρ can be obtained by the following equation

Dynamic mechanical analyses for the composites were analysed by virtue of a dynamic mechanical analyser (DMA/SDTA861e of Mettler-Toledo Company, Switzerland). The size of specimens was 20×5×1 mm. Storage modulus and loss factor were measured by means of tension–compression mode. The strain frequency was 1 Hz. Amplitude of strain was 0·05%. The testing temperature increased from −80 to 200°C at heating rate of 5°C min−1. The decomposition behaviour of the composites was studied by a thermogravimetric analyser (TG/DTA, Pyris Diamond) in air from 30 to 800°C, with a heating rate of 10°C min−1. Non-isothermal crystallisation analysis was performed by means of a DSC (Pyris Diamond) coupled with an intercooler. Crystallinity, melting and crystallising temperature were determined in terms of differential scanning calorimetry from 20 to 250°C at a scan rate of 10°C min−1.
Results and discussion
Morphological characterisation
The micrographs of composite with different mass fractions are presented in Fig. 1. This figure shows that SSFs are uniformly distributed throughout the matrix. One can see from the figure that if the mass fraction is <8·0%, the SSFs are widely separated and well isolated from each other. When the mass fraction of SSFs is >10·0% (Fig. 1f and g), the fibres will form a compact morphology in the matrix; as a result, it is easy to form conducting networks, which will facilitate the electron transfer and contribute to the electric conductivity. In addition, one can see from Fig. 1h that the fibres are well bonded with the polymer matrix. Figure 1i shows size comparison of SSFs and CNTs, and Fig. 1j indicates that CNTs are randomly distributed in the matrix.
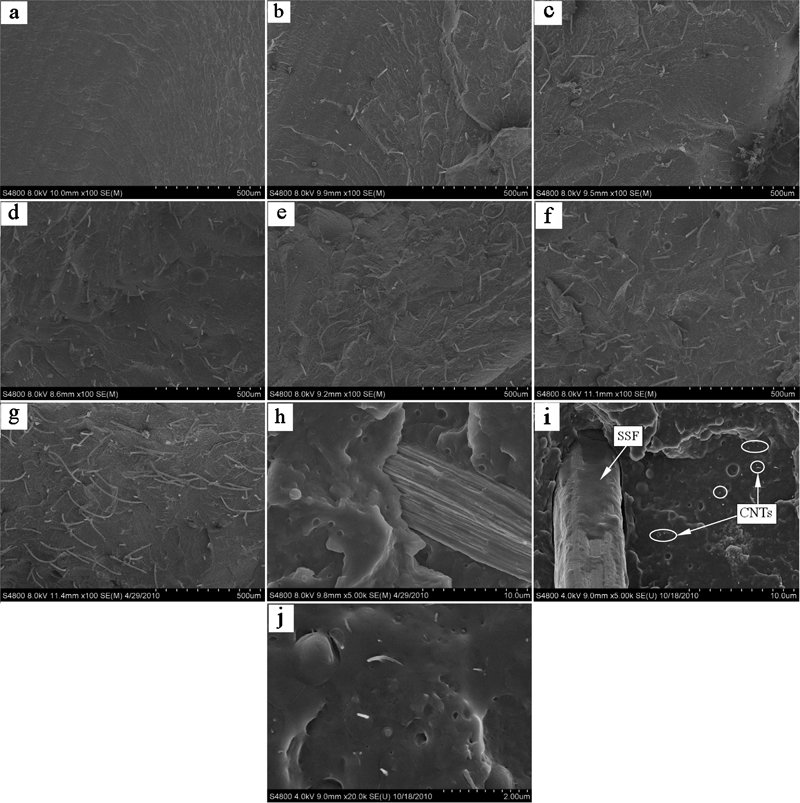
Image (SEM) of SSF/MWCNTs/PA6 composites with different mass fractions; serial number are a 0–0, b 0–2, c 0–4, d 0–6, e 0–8, f 0–10 and g 0–12; h well bonded SSF; i contrast of SSF and CNTs in size; j random distribution of CNTs in PA6 matrix
Electrical characterisation
Figure 2 shows the dc electrical resistivity dependence for various mass fractions of SSFs and CNTs at 25°C. The resistivity gradually decreases with increasing filler content. However, for type I specimen, at 4 wt-%, a definite reduction in resistivity is observed. This stepwise change in resistivity is a result of the formation of an interconnected SSFs structure and can be regarded as an electrical percolation threshold. When the mass fraction is <4 wt-%, it is difficult to form conducting network. Therefore, percolation threshold of fillers in type I specimens is between 4 and 6 wt-%.
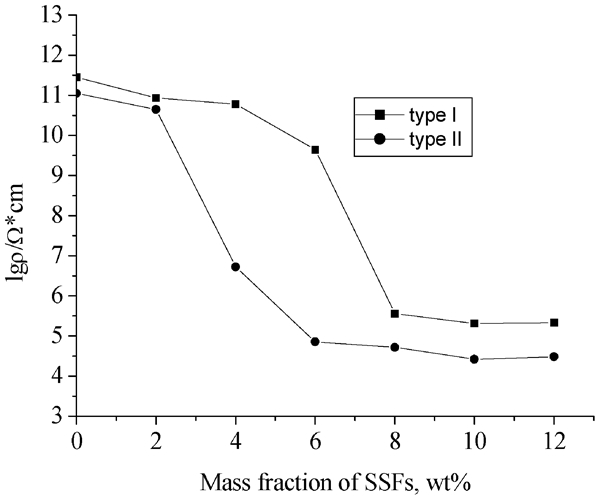
Direct current electric resistivity of composite at 25°C
Similarly, from the experimental results plotted in Fig. 2, we can determine that percolation threshold of fillers in type II specimens is between 2 and 4 wt-%. Compared from the experimental curves of types I and II in Fig. 2, we found that the percolation threshold decreases due to the addition of CNTs. Before and after percolation, the conductivity of composites is determined by non-ohmic contact and ohmic contact conduction respectively.
Dynamic mechanical analysis
Storage modulus (denoted by E′) and viscous dissipation (expressed by loss factor, tan δ) are very important mechanical properties of polymer composites. In this study, E′ and tan δ were measured by DMA/SDTA861e at different temperatures. Curves of E′ and tan δ against temperature are plotted in Fig. 3.
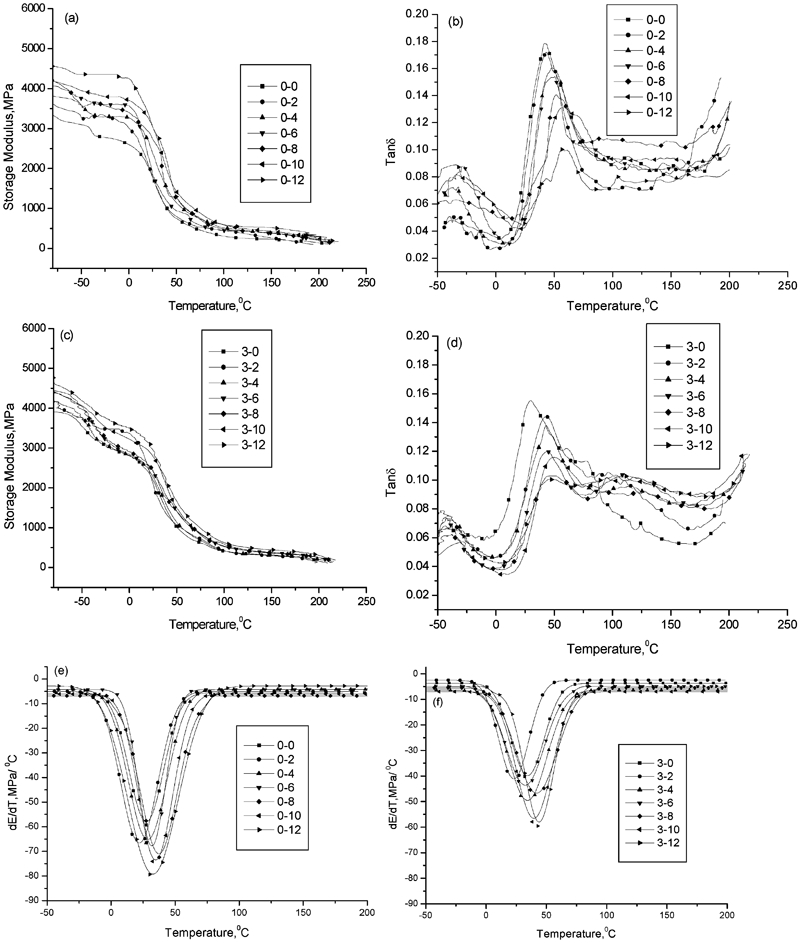
a, c storage modulus of type I and II composites; b, d loss factor of type I and II composites; e, f fitting results of rate of decrease in modulus with temperature of type I and II composites
One can see from Fig. 3a and c that the storage modulus of the composites decreases monotonically with temperature and increases with the mass fraction of fillers. It is clear that the storage modulus of type II composite is greater than that of type I. Especially, the modulus of PA6/SSF/CNT systems (mass fractions of SSFs and CNTs are 12·0 and 3·0 respectively) is 2·08 times over that of pure PA6 at 43°C (glass transition temperature of PA6 Tg). Figure 3b shows that for pure PA6, the temperature corresponding to tan δ peak values is ∼43°C, which is the same as its glass transition temperature Tg.
The decrease rate of storage modulus with temperature,
 (temperature T), was calculated according to experimental results in Fig. 3a and c, and plotted in Fig. 3e and f. It can be seen from the figures that there is a valley value in the
 curve, and the corresponding temperature to the stationary point of the valley is around Tg, which means that E′ will decrease rapidly if the temperature is in the neighbourhood of Tg. Figure. 3e and f also indicates that the magnitude of
 for type II specimens is always less than that of type I in the case of the same SSF mass fraction, which shows that the addition of CNTs may slow down the decrease in modulus with temperature, and that is the hybrid effects of multiscaled fillers.
Dynamic mechanical analysis curves of loss factor (tan δ) against temperature are plotted in Fig. 3b and d. One can see from those curves that viscous dissipation (height of loss factor peak) decreases with the increase in filler, and the position of relaxation peak moves towards higher temperature. Two dynamic relaxation peaks can be detected for all samples. The first peak at a lower temperature (about −40°C), and the second peak at a higher temperature (∼40°C) can be referred to as the β and α relaxation peaks respectively.
Figure 3b and d indicates that the temperature for β relaxation peaks move to a high temperature region with the increase in mass fraction of SSFs from 0 to 12·0 wt-%. The β relaxation peak is related to the segmental amide group in the amorphous area, which is unattached to the other amide group by hydrogen bonding. The small size unit (bond lengths, bond angles), much smaller than chain segments, changes from movement to freeze during this transition. Mccrum et al. believed that the peak of the β relaxation is related to the water content of the materials; especially, when the specimens are completely dry, this peak can even almost disappear,26 and in this case, we focus only on the α relaxation peak because it relates to the glass transition temperature of the material.
According to Mohd and Berry,27 the α relaxation peak is believed to be related to the breakage of hydrogen bonding between polymer chains, which induces long range segmental chain movement in the amorphous area. Tg obtained from maximum value of tan δ peak of these composites shifted to a high temperature region by adding the fillers to PA6 matrix because the presence of fillers restricts the segmental movement of the polymer chains and strengthens the interaction between the fillers and PA6 molecules, and thus results in an increase in Tg.3, 19
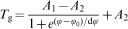
Figure 4 shows the change of Tg due to the magnitude of the mass fraction of fillers. It is found from Fig. 4 that Tg monotonously increases with the mass fraction of fillers φ. When φ approaches a critical value, Tg tends to a constant. In this case, the relation between Tg and φ may be approximately described by Boltzmann function28 as follows
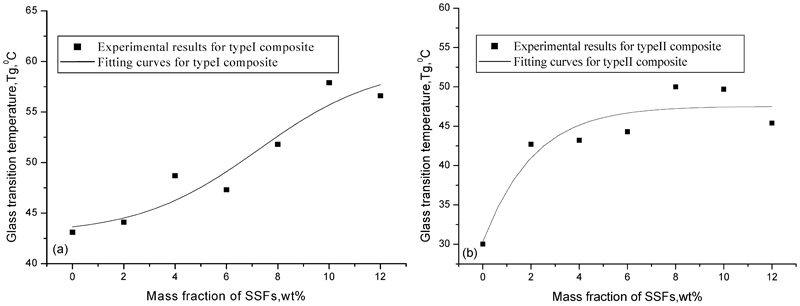
a type I composite; b type II composite
Fitting parameter of Boltzmann function
Therefore, the viscosity of composites will change due to different mass fraction of fillers. This implies that such change of viscosity may be obtained by detecting the variation of the value of α peak (seen in Fig. 3b and d).
Thermogravimetric analysis
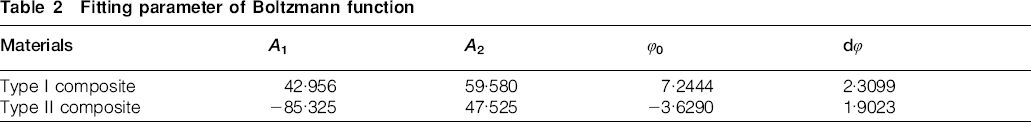
Thermal stability is one of the most important thermal behaviours of polymer materials. Whether the conductive fillers have effects on the thermal behaviours of PA6 matrix needs to be investigated. In this study, the method of TGA was adopted to identify the thermal stability of the composite. The experiment was carried out by a thermogravimetric analyser in air from 30 to 800°C, with a heating rate of 10°C min−1. The results of TGA and DTG of type I and II specimens were plotted in Fig. 5.
a, c TGA curves of type I and II composites; b, d DTG curves of type I and II composites
It can be seen from Fig. 5a and c that the more the mass fraction of SSFs and CNTs, the higher the onset temperature and end temperature of composite degradation. Generally, the degradation temperature is defined as the temperature at which the polymer lost 7·0% of its weight.4 According to this definition, the degradation temperature of PA6 was determined as 355°C from the experimental results shown in Fig. 5a. Similarly, the degradation temperature of type I and II specimens can also be determined by the same method. The degradation temperature of the two types specimens is shown in Fig. 6, and it can be described by a linear function.
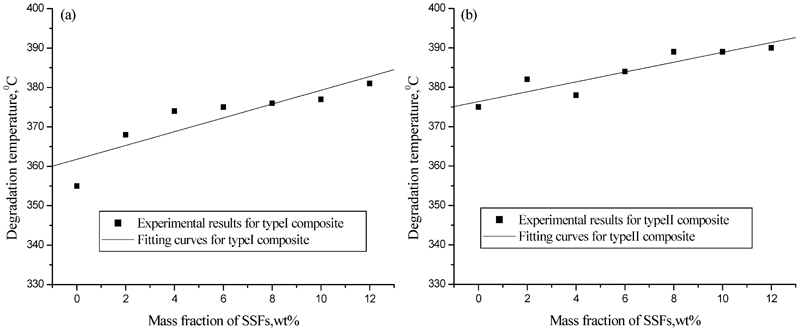
a type I composite; b type II composite
Figure 5b and d shows DTG curves of the composites. One can see from the curves that the maximum rates of thermal degradation are found to be 432°C for PA6 and 433, 440, 436, 451, 445 and 447°C for 0–2, 0–4, 0–6, 0–8, 0–10 and 0–12 specimens respectively. Accordingly, the maximum rates of thermal degradation are determined to be 430, 444, 437, 449, 441, 445 and 450°C for 3–2, 3–4, 3–6, 3–8, 3–10 and 3–12 specimens respectively.
These results state that the presence of SSFs and CNTs in composites probably confines and retards the segmental chain motion of PA6 near the interface. These fillers have barrier actions, which will improve the thermal stability of the composites. When the degradation process is finished (∼600°C), the remaining weights are that of the fillers.
Differential scanning calorimeter analysis
In order to investigate the crystallisation of pure PA6 and analyse the effects of conductive fillers on crystallinity, melting and crystallising temperature, non-isothermal crystallisation analysis needs to be performed. Crystallinity, melting temperature and crystallising temperature were detected in terms of DSC (Pyris Diamond) from 20 to 250°C at a scan rate of 10°C min−1.
Figure 7 exhibits DSC curves of SSF/PA6 and SSF/CNT/PA6 samples at a heating and cooling rate of 10°C min−1, which shows the melting point of PA6 at 223°C and the crystallising temperature at 185°C. It can be seen from the figure that mass fraction of SSFs affects neither the melting points nor the crystallising points (for type I specimens) significantly. For type II specimens, the addition of CNTs does not affect the melting points of the composites, but the crystallising points of the materials are increased obviously. This result indicates that CNTs may improve the ordering transition of the materials with the dropping of temperature.
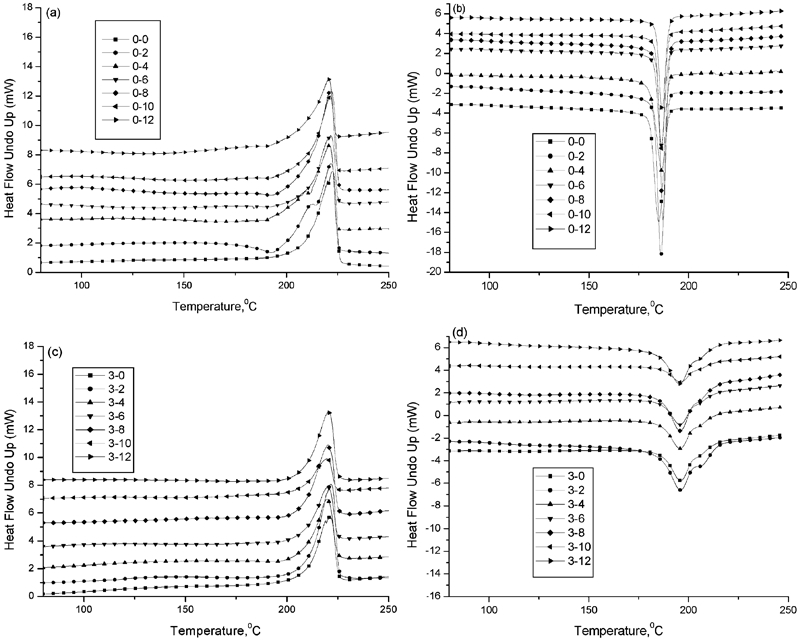
a, c differential scanning calorimeter curves of type I and II specimens at heating rate of 10°C min−1 and b, d DSC curves of type I and II specimens at cooling rate of 10°C min−1
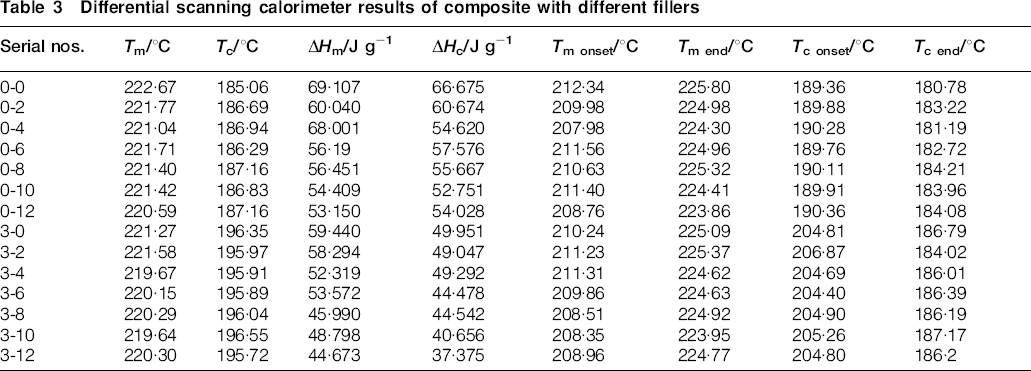
The melting and crystallising characteristics of PA6 and the composite are listed in Table 3. One can see from the table that the melting and crystallising points were almost unchanged with the increase in SSFs for type I specimens. For type I specimens, with the increase in mass fraction of SSFs, the melting onset temperature Tm onset and melting end temperature Tm end decrease slightly, and the crystallising onset temperature Tc onset and crystallising end temperature Tc end increase slightly, while the melting enthalpy ΔHm and the crystallising enthalpy ΔHc decrease.
Differential scanning calorimeter results of composite with different fillers
The crystallinity of the composite can be calculated by the following equation29, 30
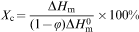
 is the melting enthalpy of PA6 with complete crystallisation, which is equal to 230·1 J g−1, ΔHm is the melting enthalpy of composite and φ is the mass fraction of fillers. The relations between the crystallinity Xc and the mass fraction of SSFs φ were plotted in Fig. 8. One can see from those curves that φ slightly affects Xc, namely, crystallinity of the composites decreases with φ. In addition, the effect of the addition of CNTs leads to decrease in Xc. These results confirm that the decrease in the ΔHm and ΔHc with the increasing mass fraction of fillers can be directly attributed to the proportional reduction of the PA6 concentration in the composites. The addition of fillers will affect the nucleation and growth during crystallising of PA6, and affect the crystalline morphologies of polymer as well. The impeding of the crystallising process will result in the decrease in crystallinity.
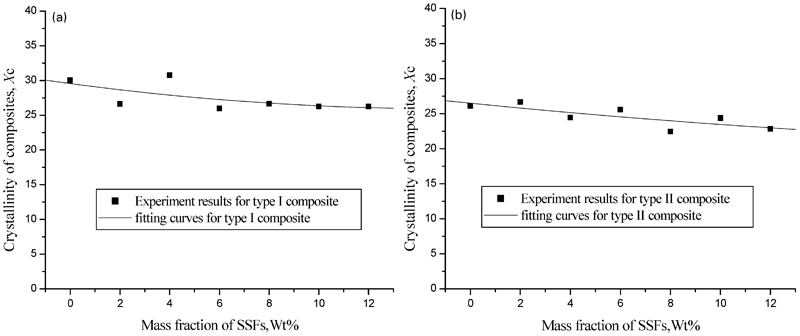
a type I composite; b type II composite
Conclusions
The electrical conductivity of PA6 filled with SSF and CNT has been investigated. The composite materials exhibited a dramatic improvement of the dc conductivity. The percolation thresholds are between 4·0 and 6·0 wt-% of SSFs for type I composites and between 2·0 and 4·0 wt-% of SSFs for type II composites.
The morphological studies reveal the good dispersion of SSFs and CNTs in the composites. The fibres have formed an integrated structure within the polymer matrix. Such kind of morphology with homogeneously dispersed conductive filler contributes towards the electric conductivity and reduced the percolation threshold.
Dynamic mechanical analysis shows that the storage modulus decreases monotonically with temperature and increases with the mass fraction of fillers. The glass transition temperatures of composites move to high temperatures with the increase in SSFs because of the reinforcing effect of the fillers due to the interaction between the fillers and PA6 molecules, which can be described by a Boltzmann function. Viscosity of composites will change due to different mass fractions of fillers.
Thermogravimetric analysis shows that thermal stability of the composites is directly proportional to the mass fraction of fillers because of the barrier actions of fillers, which confines and retards the segmental chain motion of PA6 near the interface.
Differential scanning calorimeter analysis reviews that the melting points of type II specimens are almost the same to type I, while crystallising points of type II specimens are higher than those of type I specimens. The addition of fillers leads to the decrease in crystallinity slightly.
Footnotes
Acknowledgements
We would like to acknowledge the financial support by the China National Natural Science Foundation (grant nos. 10872099 and 11202110), Natural Science Foundation of Zhejiang Province (grant no. Y6100728), Scientific Research Fund of Zhejiang Provincial Education Department (grant no. Y200804458), the Impact and Safety of Coastal Engineering Initiative, a COE Program of Zhejiang Provincial Government at Ningbo University (grant no. zj1205) and K. C. Wong Magna Fund in Ningbo University.