
Abstract
Two types of poly-para-phenylene (PR-120 as an extrusion and PR-250 as an injection moulding grade) were previously investigated with regard to their thermal, rheological and mechanical properties. In the last part of this paper series, the tribological properties, in particular the scratch resistance and wear under abrasive, sliding and rolling conditions, were evaluated as a function of the materials’ molecular characteristics. In general, PR-120 exhibited a better scratch and wear resistance, which is expected due to its higher molecular weight. However, other factors also seem to play an important role, although convincing correlations between the scratch and wear behaviour and the morphological and mechanical properties could not be found so far. All the properties tested were mirrored to those of polyetheretherketone and other polymers tested under similar conditions.
Introduction
Poly-para-phenylene copolymer (PPP) belongs to the stiffest class of thermoplastics at room temperature. The tensile modulus of the PPP extrusion grade (PR-120) reaches 8·3 GPa.1–3 The injection moulding grade (PR-250) 4 has lower strength and modulus values but possesses a much higher fracture toughness (7·5 MPa m1/2, in comparison to 3·5 MPa m1/2 for PR-120).5, 6
Based on previous studies, both PPP grades have their own specific property profile, which allows a user to select them for a variety of applications, in which either strength, stiffness or toughness is the most critical issue. The focus of the present study was to evaluate their ability for the use in applications in which tribological properties are of high importance. It was of particular interest to evaluate the materials’ resistance against sharp scratching, as well as against abrasive, sliding and rolling wear.
Experimental
Materials
Two PPPs were investigated in this study, i.e. an extrusion grade Primospire PR-120 and an injection moulding grade PR-250. Both were produced by Solvay Specialty Polymers, Alpharetta, USA.2, 4 Their thermal and mechanical properties have been described in the authors’ previous papers.1, 3, 5, 6
Tribological characterisation
Scratch tests
A scratch tester is an instrument that is dedicated to evaluating the surface mechanical properties (Fig. 1). The machine generates a controlled scratch on the surface of the material to be evaluated, whereby the tip of a hard indenter is drawn across the surface under a specified load. The scratch tester measures the applied normal force, the tangential (friction) force and the penetration depth. These properties define the scratch resistance of the surface. 7 The scratch test machine used was custom built by Surface Machine Systems, LLC, Texas, USA.
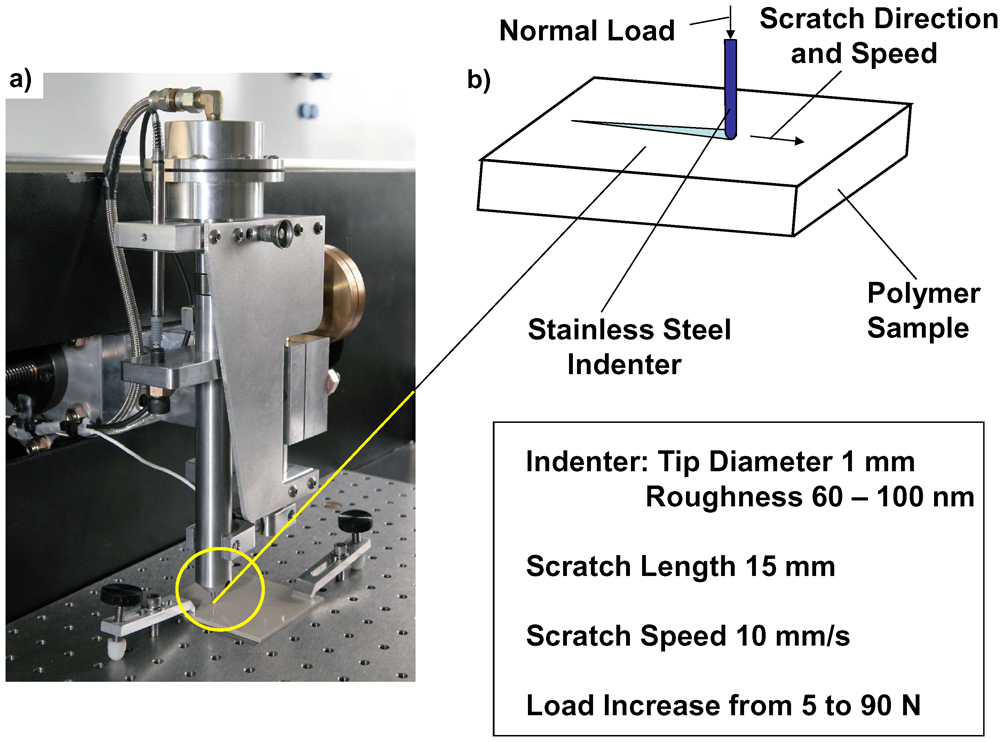
a photo of scratch testing device and b schematic illustration of scratch test and corresponding testing parameters
Abrasion tests
Abrasion is the removal of material from the surface due to multiple sliding contacts with harder asperities. A typical way to study the abrasion behaviour of metals or polymers is the use of different grades of abrasive paper (containing hard ceramic particles on a substrate) as the counterpart.
8
In the present case, a SiC paper (grain size 57 μm) was mounted on a steel ring and rotated against the polymer block, having a 4×4 mm2 contact area (Fig. 2). The amount of abrasion was determined by measuring the weight loss of the pin after rotating the paper coated ring one or three cycles against the sample at a normal pressure of 0·5 MPa and a speed of 0·24 m s−1. This resulted in a specific abrasive wear rate of
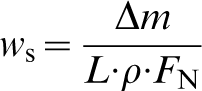
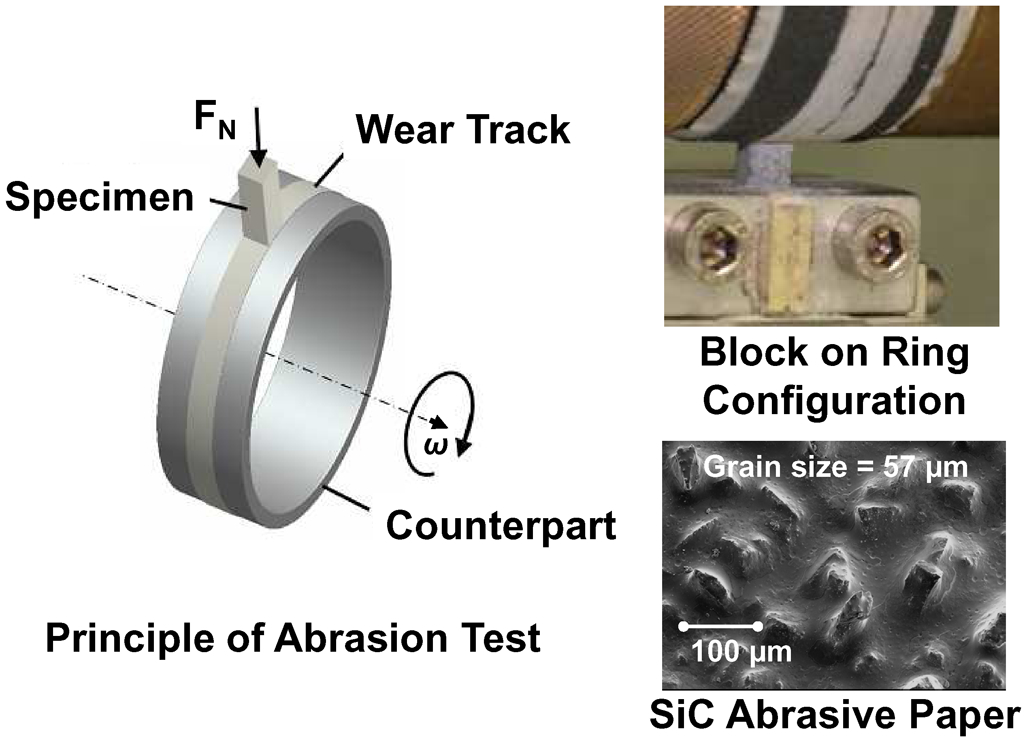
Details of abrasive wear test
Sliding wear tests
The sliding wear test involves a horizontal rotating steel disc counterpart that slides against a stationary polymer pin (or vice versa) under a prescribed set of conditions (Fig. 3). The load is applied vertically, and the torque is measured to determine the frictional force.
9
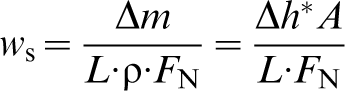
Beside the weight loss, the in situ measured height reduction Δh can also be used to calculate the specific wear rate, using the following equation
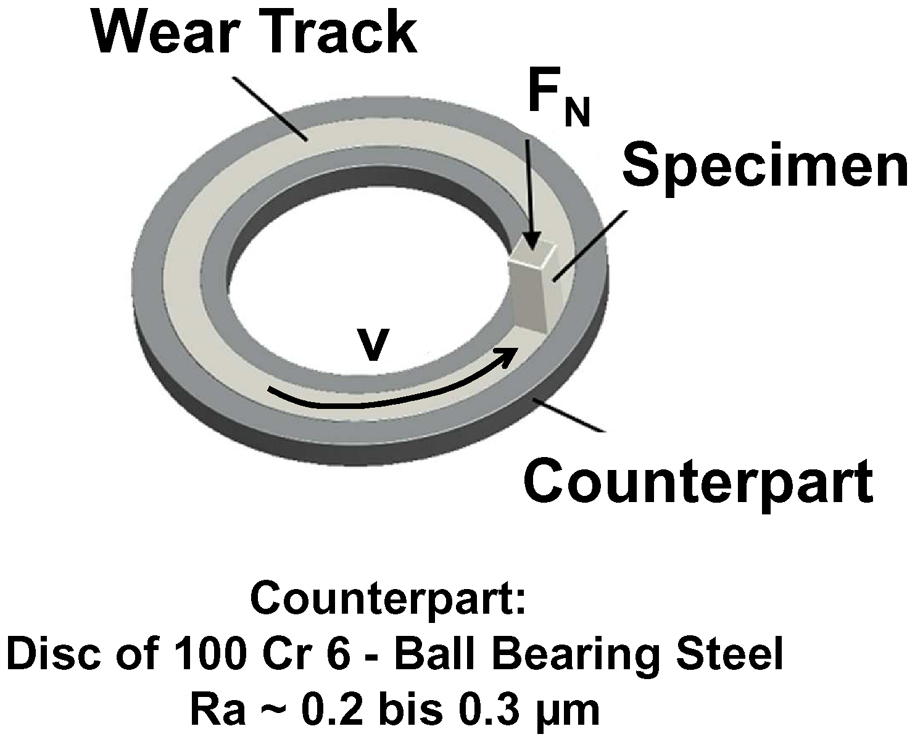
Schematic view of ‘pin on disc’ type sliding wear test configuration
In the present study, the following input parameters were chosen: FN = 8 N; A = 4×4 mm2; sliding velocity v = 0·5–2 m s−1; test duration t = 6–20 h.
Rolling wear tests
Rolling wear happens when one material is rolling on the surface of another material.
In the ball on plate principle used in this study, a single steel ball with a diameter of 6 mm rolls on a square shaped polymer specimen (60×60×4 mm3). As shown schematically in Fig. 4, a steel ball is forced to follow an orbital circuit on a polymer plate due to the construction of the testing machine. Because of this, three different kinds of movements arise during the revolutions of the ball: translation on the circular path, rotation around its y axis and spinning around the z axis. More details of this method are explained by Harrass et al. 10
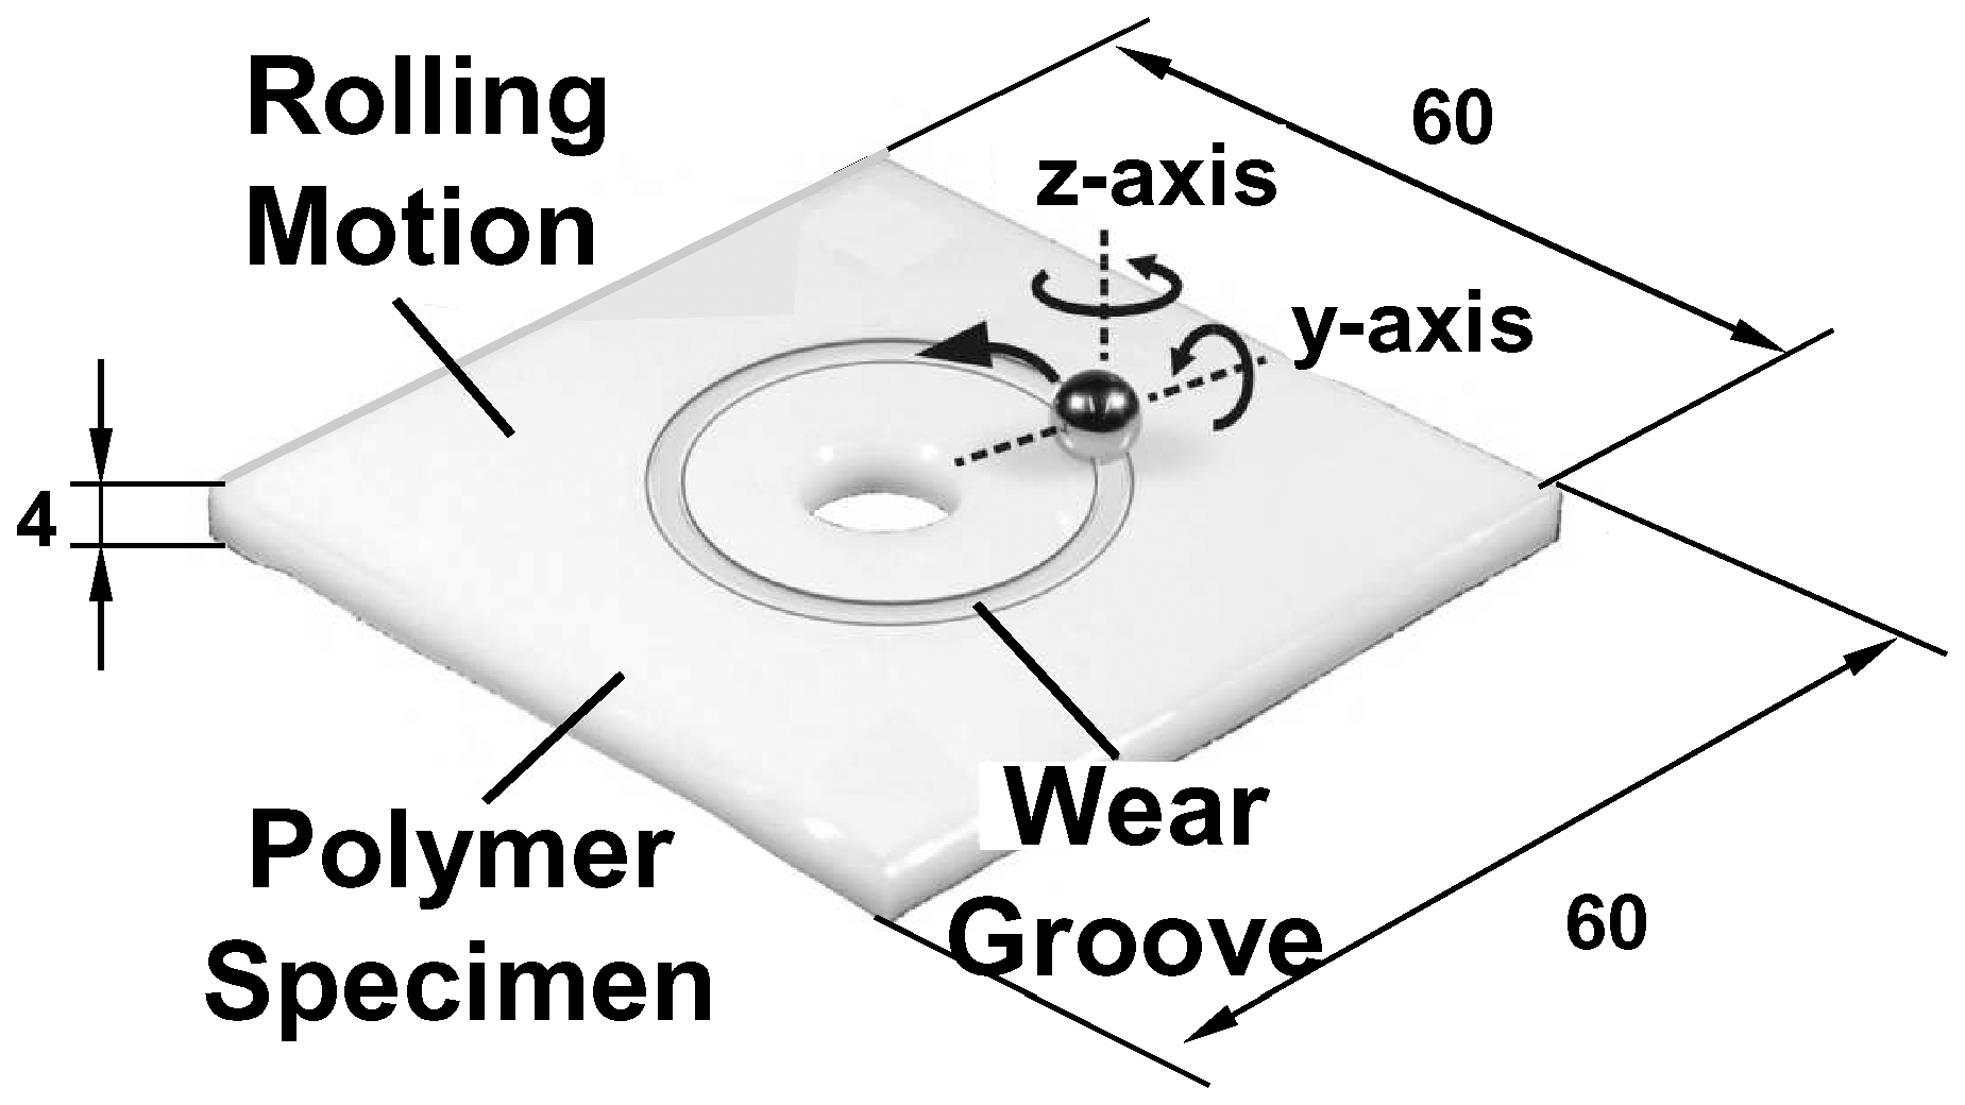
Principle of ‘ball on plate’ rolling wear test
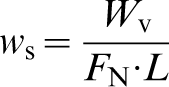
The calculation of the specific wear rate wS (mm3 {Nm}−1) (inverse of the material's wear resistance) occurs by the division of WV by the loading parameters
Results and discussion
Scratch tests
Figure 5 shows the typical scratch results for the material PR-120. The normal and the tangential (frictional) forces do not increase in a perfectly linear fashion but slightly progress. At the end of the test, the indenter develops a backward movement, which has some influence on the penetration depth (although this is usually ignored). The scratch depth reached a value of 149 μm. The corresponding scratch coefficient of friction (SCOF) can be estimated from the tangential and normal force at the end of the scratch and was calculated as 0·211.
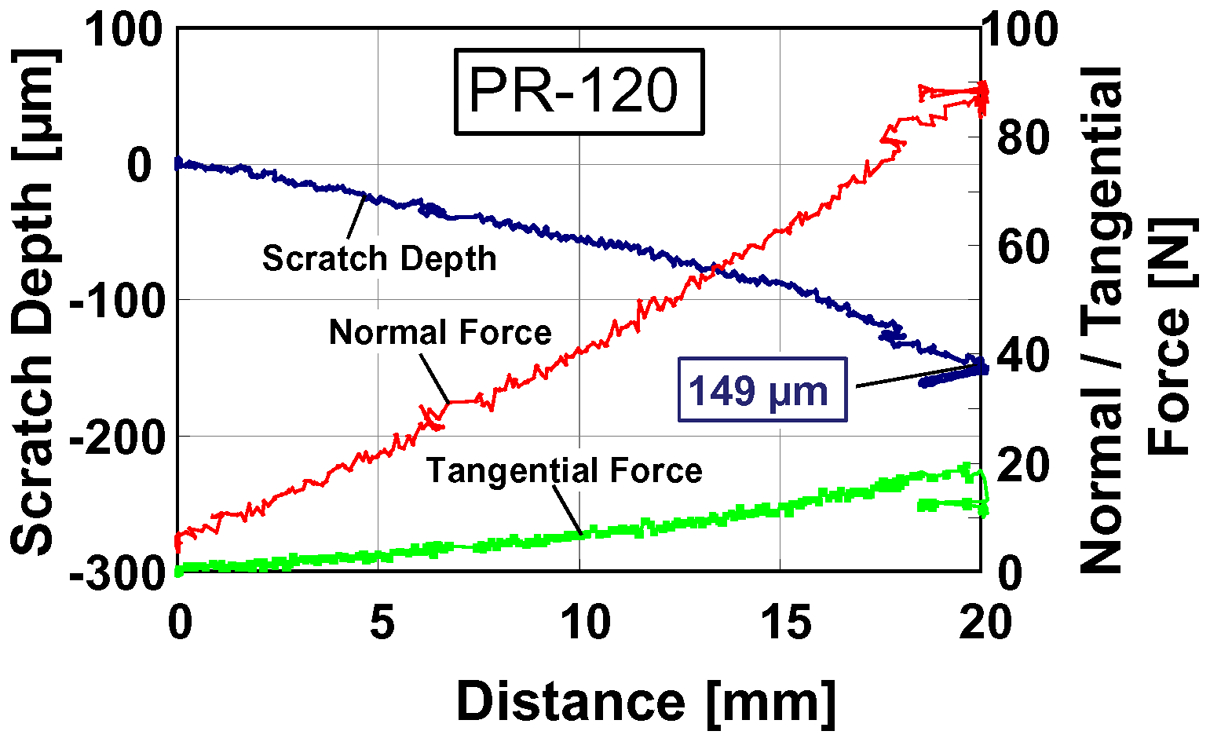
Scratch resistance of PR-120, increase in normal force from 5 to 90 N, scratch speed = 10 mm s−1, scratch distance = 20 mm
The scratch resistance of PR-250 is shown in Fig. 6. Here, a scratch depth of 180 μm and a SCOF of 0·233 were achieved. This means that PR-120 possesses a slightly better resistance to scratch than PR-250. This is in a good agreement with the Martens hardness results reported for both materials by Almajid et al. 6
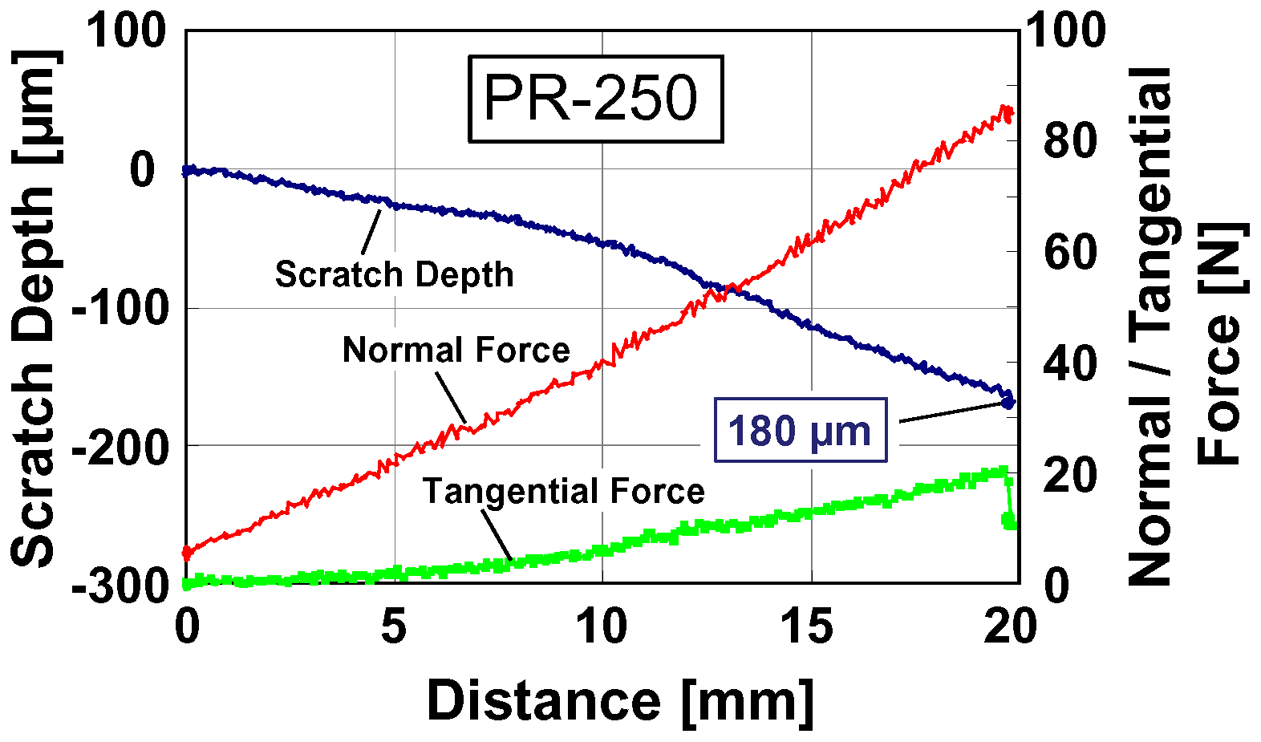
Scratch resistance of PR-250, 5–90 N, 10 mm s−1, 20 mm
The scratch recovery was investigated using white light profilometry. Figure 7 shows the measurement of width and depth at the end of the scratch (PR-250). The remaining (residual) scratch depth amounted to 12·5 μm; this means that PR-250 reached a 93·05% recovery rate. Previous studies on the same issue for PR-120 resulted in a value of 93·5%. 7
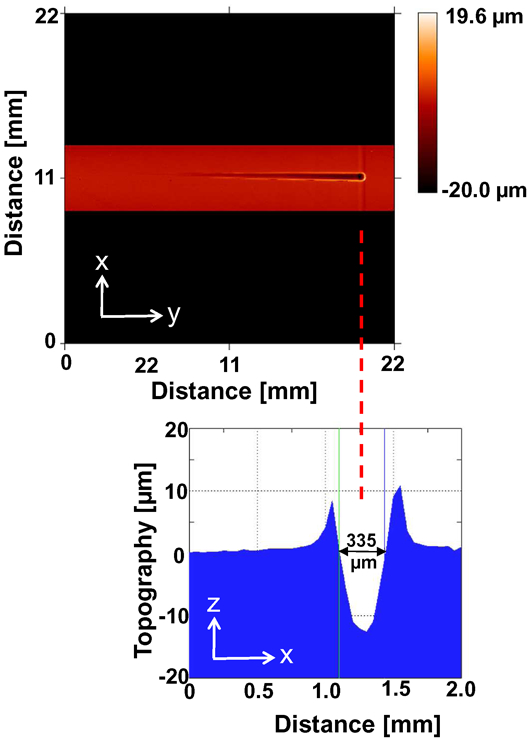
White light profilometry test for PR-250
Abrasion tests
Abrasion tests were carried out at two different conditions. The first one was a single pass test, whereas the second one was a multiple pass test, in which the materials ran against the abrasive paper for a period of 10 s on the same track. In case of the single pass tests, the wear rates were similar for both materials (Fig. 8). Under multiple pass conditions, a similar performance was found, but the data of the multiple pass conditions were lower than the ones of the single pass condition. A scanning electron microscopy (SEM) analysis of the wear debris on the counterpart (abrasive paper) showed that in both cases, a mixture of coarse and fine wear debris was detected (Fig. 9). The finer wear particles had a more brittle appearance, whereas the coarse particles resulted from a more ductile failure. This can be correlated with the appearances of the abraded surfaces of the materials after single pass abrasion (Fig. 10). On the one hand, grooves in the abrasion direction were visible, but also a lot of smaller cracks and broken pieces in between the grooves can be seen. Since the debris got stuck on the abrasive paper, it acted as a distance holder between the two mating surfaces, thus causing a lower amount of wear under multiple pass conditions.
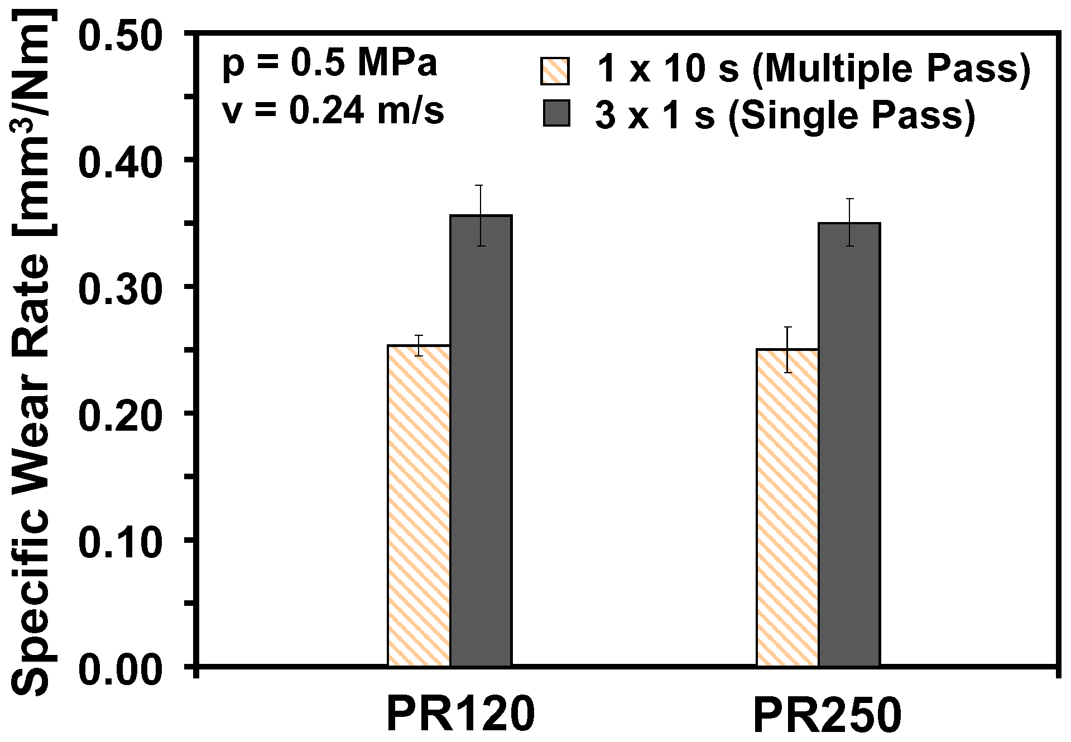
Specific wear rate under abrasion test for a pressure of p = 0·5 MPa and velocity of v = 0·24 m s−1
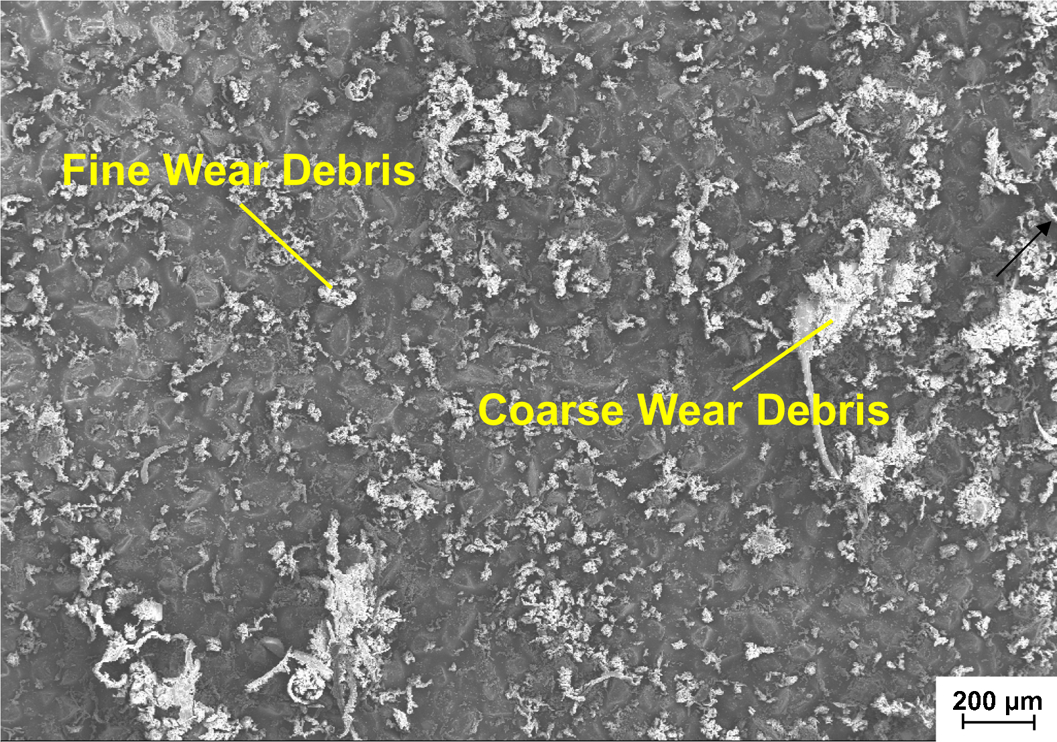
Wear debris of PR-250 materials on counterpart after multiple pass abrasion
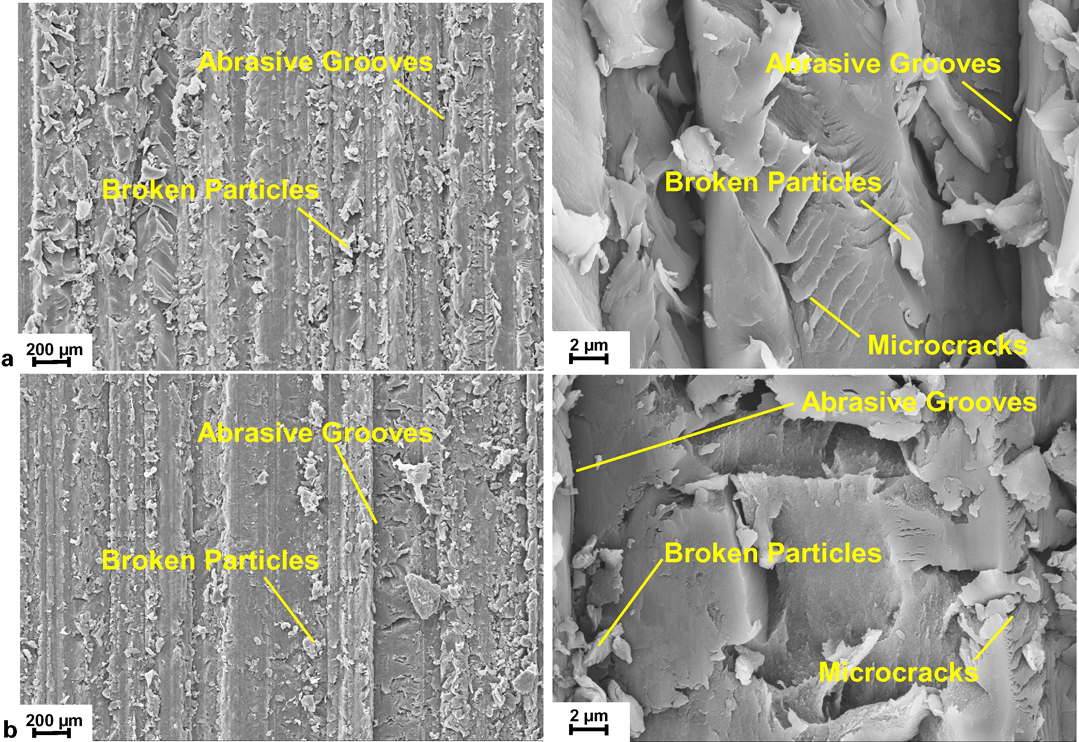
a SEM analysis of worn surfaces of PR-250 after single pass abrasion test; b SEM analysis of worn surfaces of PR-120 after single pass abrasion test
Sliding wear tests
Figure 11 illustrates the results of the sliding wear tests of materials PR-120 and PR-250 as a function of the sliding velocity applied. In the range of lower velocities (0·5 and 1 m s−1), the specific wear rates of both materials are below 10−6 mm3 Nm−1, i.e. on a level that is characteristic for a wear resistant polymer under dry sliding conditions. At a higher testing velocity (here 2 m s−1), however, the wear rate of both materials increased by more than two orders of magnitude (Fig. 11a). Although not explicitly measured, it can be assumed that for both materials, the contact temperature between the rotating steel disc and the stationary polymer pins became close to or even above the glass transition temperature of the two polymers tested (PR-120: Tg = 155°C; PR-250: Tg = 167°C 5 ). This resulted in a strong reduction of the materials’ resistance against mechanical loading (especially shear), thus causing a high amount of material removal. At the same time, the coefficient of friction was slightly reduced as occurs in comparable cases also for other polymeric materials (Fig. 11b).
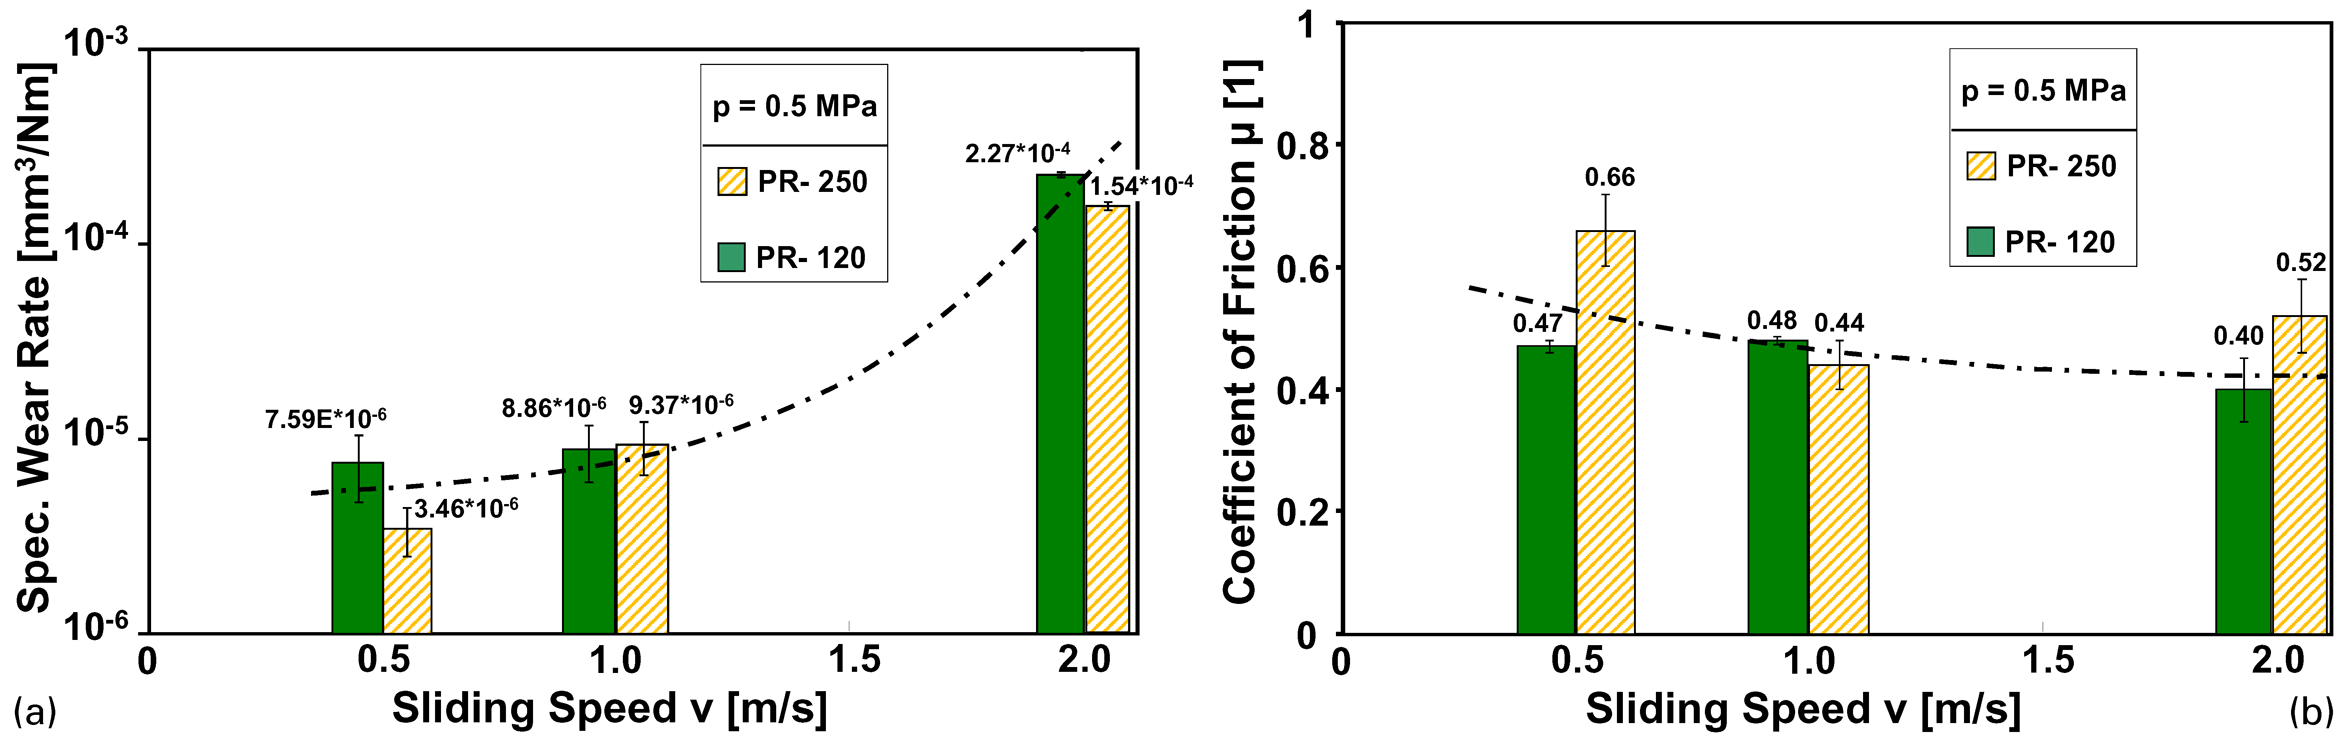
a specific wear rate under sliding wear test for PR-250 and b friction coefficient of PR-250 under sliding wear test
Rolling wear tests
Under rolling wear conditions, the difference between the two polymers under consideration became much clearer when plotting the specific wear rates on a linear scale. PR-120 exhibited half the amount of material removal compared to PR-250 (Fig. 12). This was evident not only by the mass loss measurements but also by the profilometer verification of the rolling wear tracks (Fig. 13). A macroscopically much deeper wear track could be detected for PR-250 compared to PR-120. Corresponding SEM studies of the wear tracks on the surface of the flat polymer samples also proved that material PR-120 showed much less material removal under rolling contact conditions than material PR-250 (Fig. 14). To find any reasonable correlation between the rolling wear data and the mechanical property profile of the two different PPP polymers was not possible within the course of this study, but may be the subject of further investigations in the future. It seems that the lower level of molecular weight and the addition of special additives in materials PR-250 could be the reason for its less effective resistance in surface fatigue behaviour.
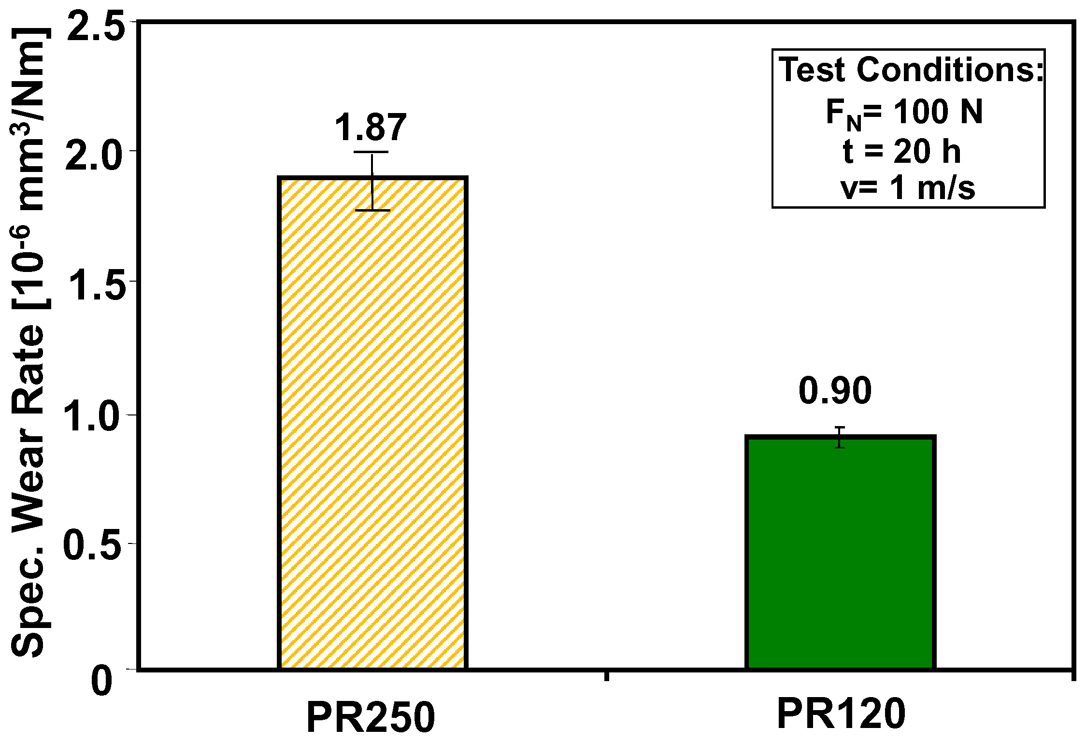
Specific wear rates of PR-250 and PR-120 under rolling wear conditions
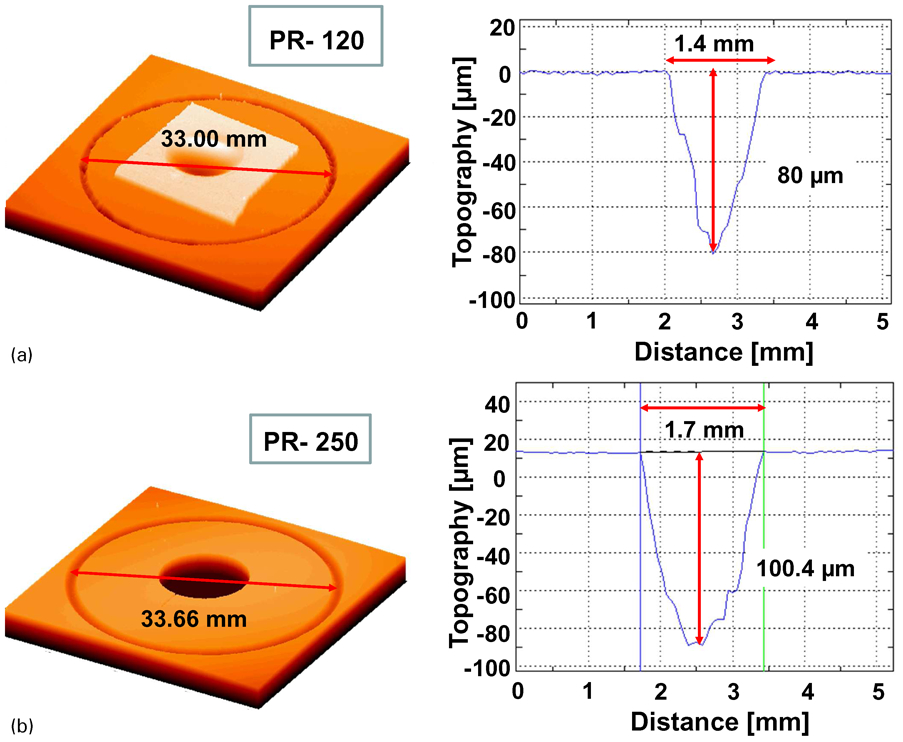
a profilometer analysis of PR-120 after 20 h of testing: three-dimensional view of wear track (left) and profile of wear groove (right) and b profilometer analysis of PR-250 after 20 h of testing: three-dimensional view of wear track (left) and profile of the wear groove (right)
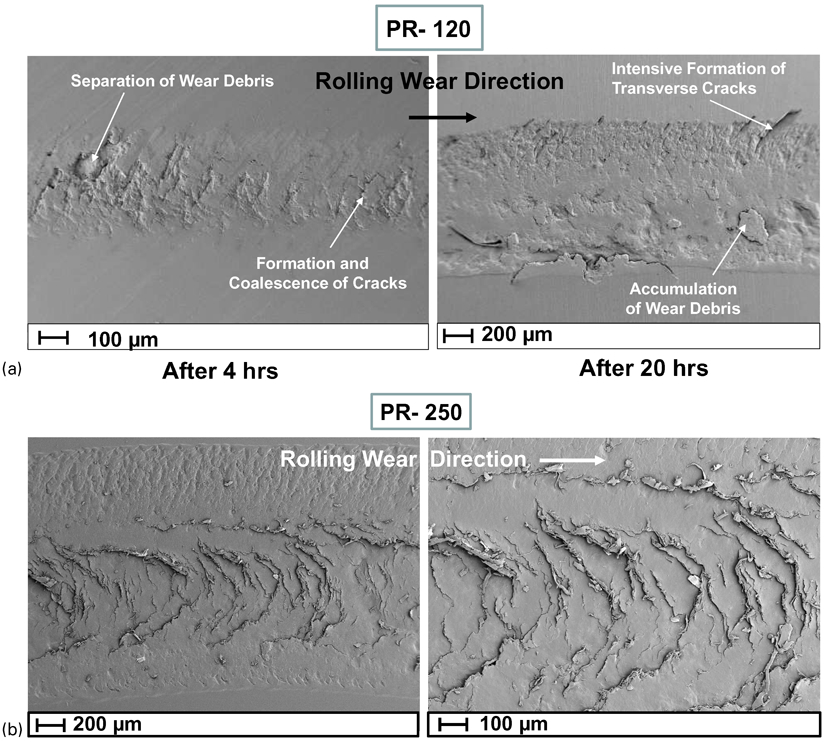
a SEM pictures of rolling wear track on PR-120 after 4 and 20 h of testing and b SEM pictures of rolling wear track on PR-250 after 20 h of testing
Scratch and wear results in comparison to other polymers
Since the PPPs of the present kind have not been studied by others with regard to their friction and wear characteristics, it is worth to compare the results of this study with those of other polymers tested under similar conditions. In this way, one can at least estimate how good or bad these PPP based polymers are. For a starting comparison, Table 1 summarises the results of all our studies in which the PPPs were tested under the same conditions as various other polymers.
Comparison of tribological data of this study to other polymers tested under same conditions
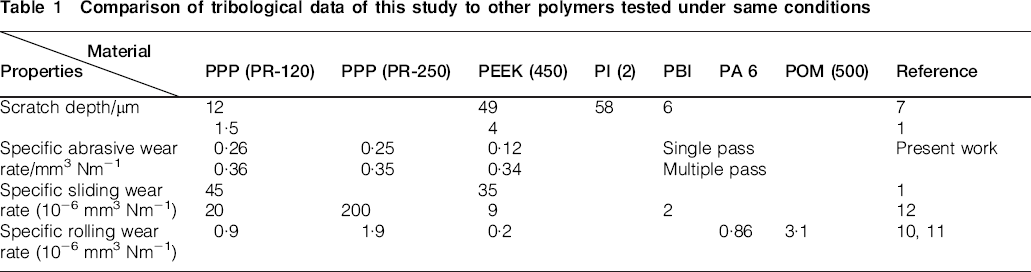
It can be realised that PPP of PR-120 was more scratch resistant than polyetheretherketone (PEEK)1, 7 and polyimide (PI), but less resistant than polybenzimidazole (PBI). 7 In case of the abrasive wear behaviour, however, PEEK resulted in better values than the two PPPs (especially for single pass abrasion). The difference became even more pronounced when the sliding wear results against steel counterparts were analysed. In both cases, the harder PR-120 version was a bit worse than PEEK, valid for two different pv conditions (pressure×velocity).1, 12 The softer PR-250 version performed under these conditions even worse, i.e. having a more than 20 times higher wear rate than PEEK. Under the same conditions, PBI exhibited the lowest wear rate of all the polymers tested. 12 However, it should be mentioned that in all of these cases, these values are only indicators, since the exact values are strongly dependent on pressure, velocity, temperature, counterpart roughness, macrogeometry, testing conditions, etc. 13 Considering PEEK, for example, Burris and Sawyer found specific wear rates of 2×10⁻⁶ mm3 Nm−1, which became even lower when PEEK was used as a filler in polytetrafluoroethylene (PTFE). PTFE itself had under their testing conditions a value of 6×10⁻⁴ mm3 Nm−1. 14 Other high performance thermoplastics, such as polyether-imide (PEI), polyphenylenesulphide (PPS) or liquid crystal polymer (LCP) possess sliding wear data of
PEI: 3×10⁻⁵ mm3 Nm−1, 15
PPS: 8×10⁻⁴ mm3 Nm−1, 16
LCP: 5×10⁻⁶ mm3 Nm−1, 17
all valid for sliding wear against steel at room temperature.
When it comes to the rolling wear behaviour, the two PPP materials were performing quite well; this means that they were found in an intermediate range between neat PEEK (best in Refs. 10 and 11) and PA 6 (polyamide 6) and POM (polyoxymethylene). For the two latter, a similar tendency was also documented in other references.18, 19 In general, it was found that the rolling wear resistance seemed to be dependent on the temperature development in the material below the wear track. Wannop and Archard 20 claimed that the hysteresis losses (here: during the repeated surface fatigue due to the rolling steel ball) could cause significant increases in subsurface temperatures of polymers with a rolling counterbody, having enormous consequences on their wear and damage behaviour. In a previous study 11 (although not reported in the paper), the best correlation with the rolling wear resistance was found with the maximum use temperature, which was highest for PEEK and lowest for POM.
Conclusions
Two types of PPP, i.e. an extrusion grade (PR-120) and an injection moulding grade (PR-250), were investigated with regard to their wear performance under different conditions. PR-120, which has higher molecular weight than PR-250, showed a slightly better scratch resistance. Under abrasive conditions, both PR-120 and PR-250 exhibited nearly the same performance. With regard to the sliding wear tests, the behaviour of PR-250 was also similar to that of PR-120. All of the three tests (scratch, abrasion and sliding) deal with a shear stress loading of the polymeric surfaces. When it comes to the rolling wear tests, mainly the resistance against compression and surface fatigue are of high importance. In this case, PR-120 exhibited a wear rate two times lower than PR-250. A comparison of the tribological characteristics of the PPPs to those of other polymers showed that the PPPs ranged somewhere in between PEEK and other high performance polymers, as long as room temperature testing was considered.
Footnotes
Acknowledgements
The authors are grateful to the King Saud University, Riyadh, Saudi Arabia, who kindly supported this international collaboration. Further thanks are due to the company Solvay Advanced Polymers, USA, for kindly supplying the materials.