
Abstract
Pyrolysis of waste tyres not only tackles the environmental issues associated with disposal, but also enables the recovery of valuable products such as oils and carbon fillers for elastomeric materials. This study was instigated to benchmark the in-rubber properties of pyrolytic carbon (often referred to as pyrolysis carbon black, pCB) and to understand the compositional parameters that dictate performance. Colloidal properties suggest the pCB materials to have a reinforcing potential between that of N330 and N550 carbon blacks, whereas physical property data suggest that they are more akin to the N700 series. Fundamentally, this disparity in performance appears to be the result of carbonaceous residues on the pCB surface, which both reduce surface activity and dispersability of the recyclate. Both thermogravimetric and dynamic mechanical analyses confirmed a number of pCB samples to have the same specific surface activity, regardless of the pyrolysis process or feedstock utilised.
Keywords
Introduction
Pyrolysis of waste tyres not only tackles the environmental issues associated with disposal, but also enables the recovery of valuable products such as oils and carbon fillers for elastomeric materials.1, 2 This study was instigated to benchmark the in-rubber properties of pyrolytic carbon (often referred to as pyrolysis carbon black, pCB) and to understand the compositional parameters that dictate performance.
The pCB fillers generated from such processes are known to contain the original carbon black, carbonaceous deposits and inorganic rubber compounding ingredients.3, 4 The levels and types of each of these components will be governed by the composition of the feedstock and, to some extent, the pyrolysis process conditions employed. 5 For instance, the carbon black compounded into a tyre tread will be of significantly greater surface area to that used in other parts of the tyre, such as the sidewall, inner liner and so on. Regional variances also need to be considered; the use of a typical European tyre tread compound as the feedstock will likely result in a higher pCB ash content (due to the utilisation of silica filler) over that derived from a North American tyre tread. Process conditions, such as pressure and temperature, have also been shown to control the levels of carbonaceous residue formed during the pyrolysis process.3, 5 Given such potential variances, controlling the consistency of pCB on a commercial scale may prove problematic. However, it could be argued that careful control of the feedstock and processing conditions may allow production of pCB grades specifically tailored for certain applications.
Reinforcing properties of carbon black
The reinforcing potential of carbon black can be considered as a function of its surface area, surface activity and structure. Chemical and physical interactions lead to adsorption of polymer chains onto the carbon black surface. 6 These interactions restrict the segmental movement of the polymer molecules and hence result in reinforcement. Increased surface area and activity will increase polymer–filler interactions. 7 Carbon black surface activity has been described in terms of the oxygen containing chemical groups on the surface (such as carboxyl, quinone, phenol and lactone) and the number of graphitic crystallite ends present.6–8 The size, shape and distribution of aggregates are generally termed carbon black structure (Fig. 1a). The aggregate nature of reinforcing fillers manifests itself primarily in their ability to occlude rubber and to shield the occluded rubber from deformation. 9 The occluded rubber then behaves as additional filler rather than like the polymer matrix. 10 So in general terms, the greater the surface area, surface activity and structure level of a filler, the greater the reinforcing potential it will have.
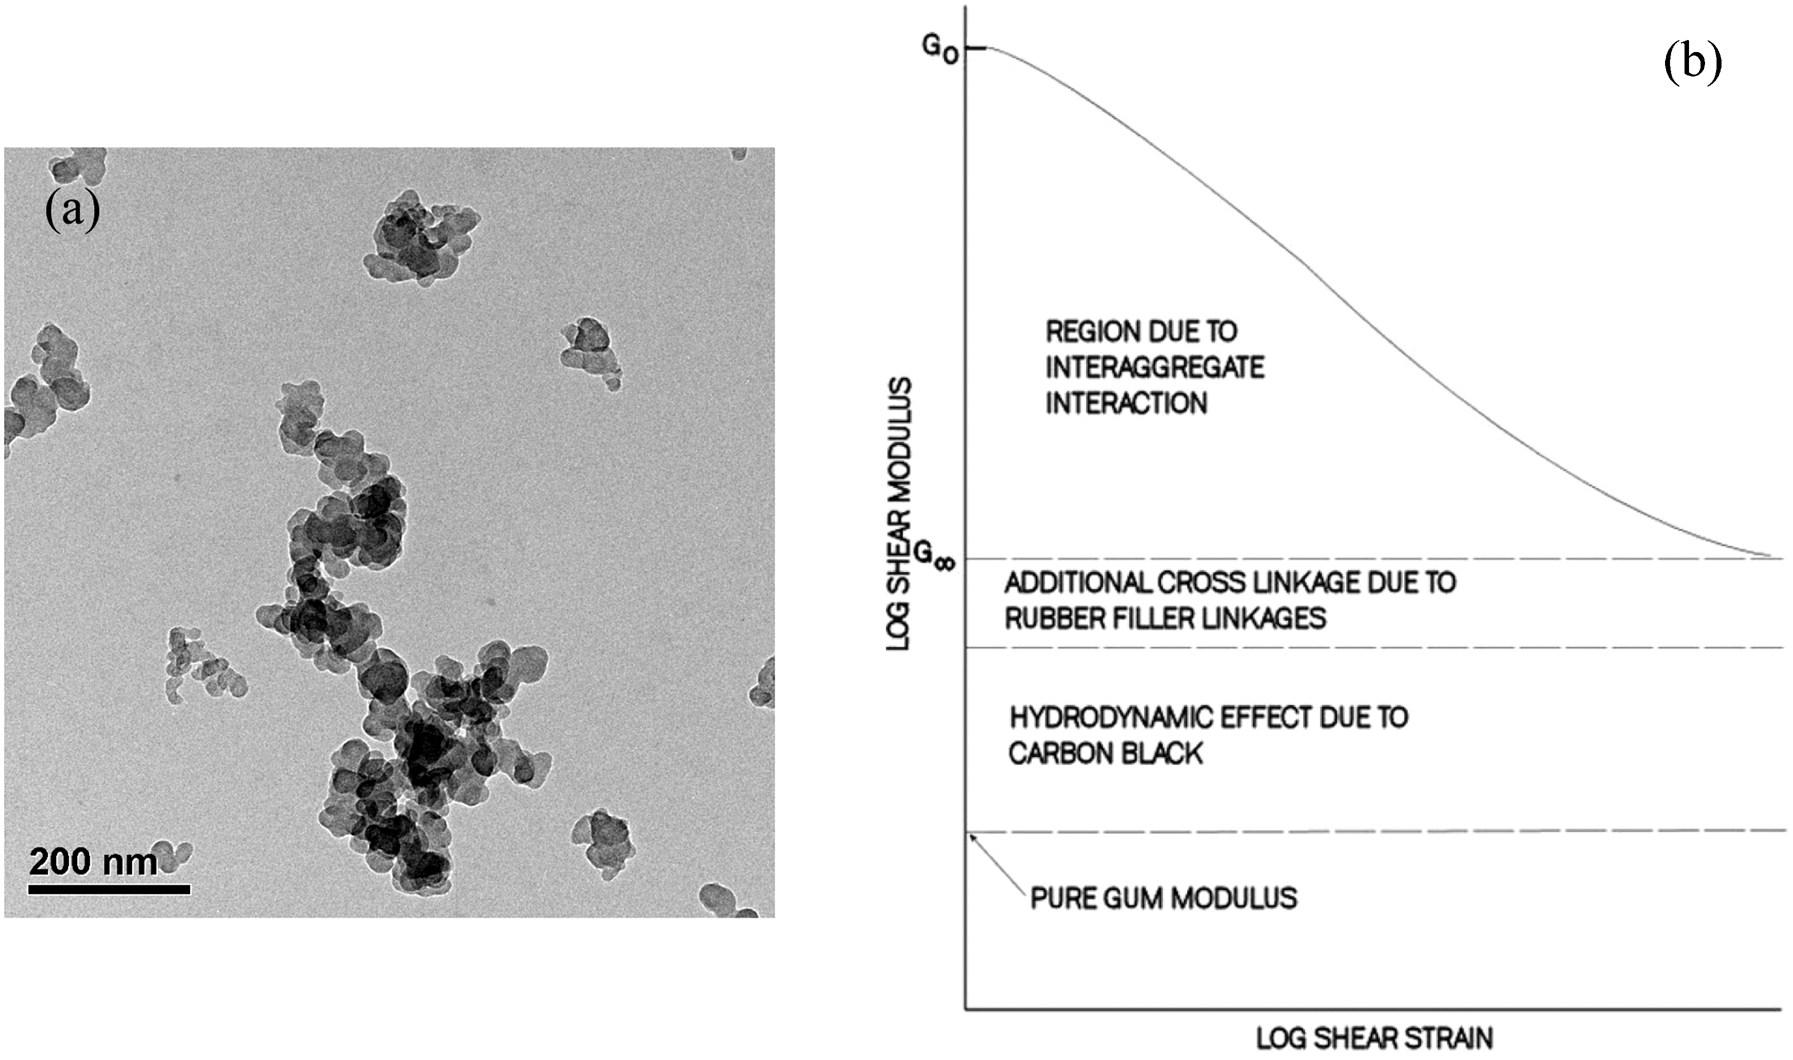
a carbon black structure (image courtesy of Birla Carbon) and b Payne effect
When mixed in the rubber matrix, carbon black aggregates have a tendency to associate with each other to form agglomerates, owing to van der Waals type attraction forces between particles.
11
Such forces are short ranged as compared to the particle size of the carbon black and are known as the filler network or secondary structure. Warring
12
first observed that the dynamic modulus E′ decreased with increasing strain amplitude from a high plateau
 to a low plateau
 . Elastic modulus plots were presented in idealized form by Payne
13
(Fig. 1b). Payne attributed the effect of carbon black at the high amplitude to a combination of a hydrodynamic effect and additional effective cross-links due to rubber–filler interactions. Whereas at low amplitudes, the effect of carbon black on reinforcement is a combination of the hydrodynamic effect, polymer–filler interactions plus the filler–filler interactions (carbon black network).
14
. Elastic modulus plots were presented in idealized form by Payne
13
(Fig. 1b). Payne attributed the effect of carbon black at the high amplitude to a combination of a hydrodynamic effect and additional effective cross-links due to rubber–filler interactions. Whereas at low amplitudes, the effect of carbon black on reinforcement is a combination of the hydrodynamic effect, polymer–filler interactions plus the filler–filler interactions (carbon black network).
14
It has been demonstrated that plots of the maximum in loss modulus (
 ) versus ΔE′ (
 −
−
 ) have a line of unity independent of the elastomer, carbon black or carbon black loading.
15
Carbon blacks exhibiting significantly different surface activity or morphology to the norm fall away from this line of unity.16, 17 These type of relationships will be useful tools in characterising the dynamic properties of pCB filled vulcanisates in relation to those filled with conventional carbon blacks.
) have a line of unity independent of the elastomer, carbon black or carbon black loading.
15
Carbon blacks exhibiting significantly different surface activity or morphology to the norm fall away from this line of unity.16, 17 These type of relationships will be useful tools in characterising the dynamic properties of pCB filled vulcanisates in relation to those filled with conventional carbon blacks.
Properties of pCB
Existing literature suggests that pCB has a surface area (STSA: ∼70 m2 g−1) and structure (COAN: ∼80 mL/100 g) in the region of reinforcing to semireinforcing carbon blacks, N300 to N700 series.4, 18, 19 Traditional carbon blacks of such colloidal properties find usage in a wide range of applications, indicating the potential commercial viability of pCB. However, using these typical colloidal properties as an indicator of performance may prove misleading given the other known components of pCB. A certain portion of the material will be inorganic, essentially diluting the carbon content. It has been suggested that the inorganic species absorb onto the active sites of the carbon black which in turn reduces surface activity. 20
The deposition of carbonaceous residues on the original carbon black surface have also been reported to reduce activity and morphology.21, 22 XPS was used to demonstrate the presence of small aliphatic or aromatic compounds on the pCB surface; part of the carbonaceous residue formed by condensation of polymer decomposition products during pyrolysis. 3 Such species could not be removed from the surface via toluene or THF, indicating them to be chemically bound rather than absorbed. Conventional carbon black consists of the ends of overlapping graphitic layers (estimated as being 2·54×4 nm), which significantly enhance surface activity.6, 7 Studies by Darmstadt and co-workers suggest the pCB surface morphology is significantly smoother over such length scales due to the deposition of the carbonaceous residues.3, 21 Higher processing temperatures, and the use of vacuum over atmospheric pyrolysis, have been shown to reduce the level of carbonaceous residue formed.3, 20, 23 Currently, pyrolysis processes have been optimised for yield rather than in-rubber performance of the char. Based on this, optimisation of pyrolysis process conditions to produce pCB of desired surface chemistry/morphology may prove fruitful.
In this study, thermogravimetric analysis (TGA), energy dispersive X-ray analysis (EDX), surface area and structure measurements are used to characterise a number of pCBs in relation to conventional carbon blacks. This data is then used in the interpretation of in-rubber performance, with particular emphasis placed on dynamic mechanical analysis (DMA).
Experimental
Materials
N772, N550, N330, N234, N115 and EXP1 (experimental grade) furnace carbon blacks were included in the study, covering external surface areas of 30–235 m2 g−1 (derived by the statistical thickness method, STSA). The structure levels of these carbon blacks (as indicated by the crushed oil absorption number, COAN) ranged from 58 to 105 mL/100 g. Five pCB materials of differing feedstock and pyrolysis processes were sourced for evaluation, as summarised in Table 1. Owing to their proprietary nature, further information relating to these pCB samples cannot be disclosed. All samples were dried for 16 h at 100°C prior to testing.
pCB processing conditions and resultant colloidal properties
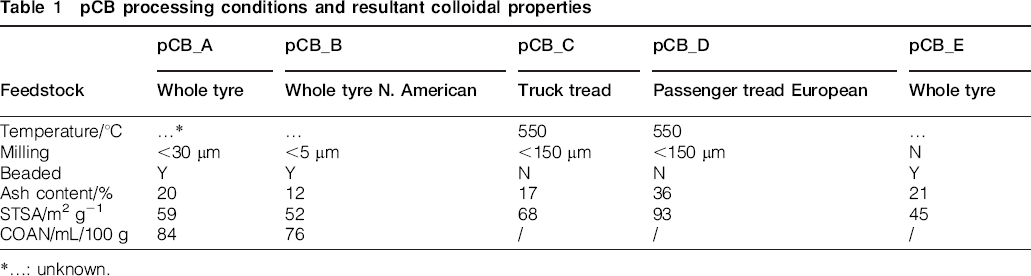
*…: unknown.
Materials characterisation
TGA was used to determine the percentage oxidisable matter and ash content within each of the fillers detailed in the section on ‘Materials’. 10 mg of divided sample was heated from 40→600°C at 20°C min−1 in nitrogen and then cooled to 400°C (also at 20°C min−1). After a 5 min isotherm at this temperature, air was introduced and the sample heated to 800°C at 10°C min−1. A final 5 min isothermal hold was applied at 800°C. Ash specimens were mounted onto carbon sticky tabs and analysed via SEM/EDX (at 15 keV accelerating voltage, 24·2° take-off angle over a livetime of 200 s) to identify the inorganic materials within the pCB samples.
In-rubber characterisation
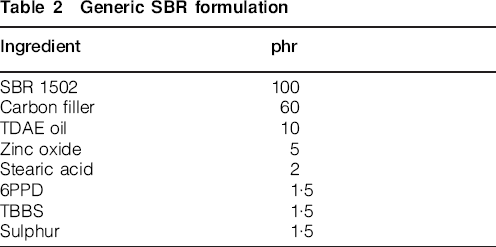
A generic styrene butadiene rubber (SBR) formulation was used to evaluate the in-rubber performance of the carbon black and pCB fillers, as detailed in Table 2. Compounds were produced using a 60 cc Brabender set at 40°C and 60 rev min−1 and following the procedure outlined in Table 3. A fill factor of 95% was utilised to assist in attaining maximum levels of filler dispersion and to provide sufficient compound for physical and dynamic testing.
Generic SBR formulation
Mixing procedure
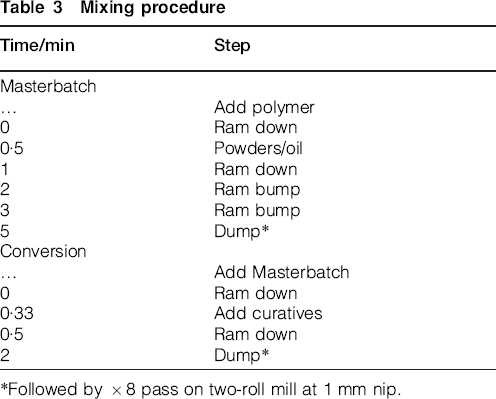
*Followed by ×8 pass on two-roll mill at 1 mm nip.
Moving die rheometer (MDR) testing at 160°C was used to assess the cure characteristics of each compound and to allow preparation of 150×150×1·5 mm sheets using a cure time of T90+5 min. Tensile, Shore A hardness and strain sweep properties were then determined. Strain sweeps were conducted in tension at 40°C, 10 Hz and double strain amplitudes (DSA) from 0.06 to 6%. Optical microscopy was utilised to assess the levels of filler dispersion within each compound.
Results and discussion
Filler characterisation
The colloidal space occupied by the commercial carbon blacks and the pCB samples can be seen in Fig. 2. Surface area and structure measurements (where available) suggest the pCB fillers to have colloidal properties falling between that of the N300 and N500 series carbon blacks. Given the differences in feedstock and pyrolysis conditions utilised, the colloidal properties of the five pCB samples fall over a relatively narrow range.
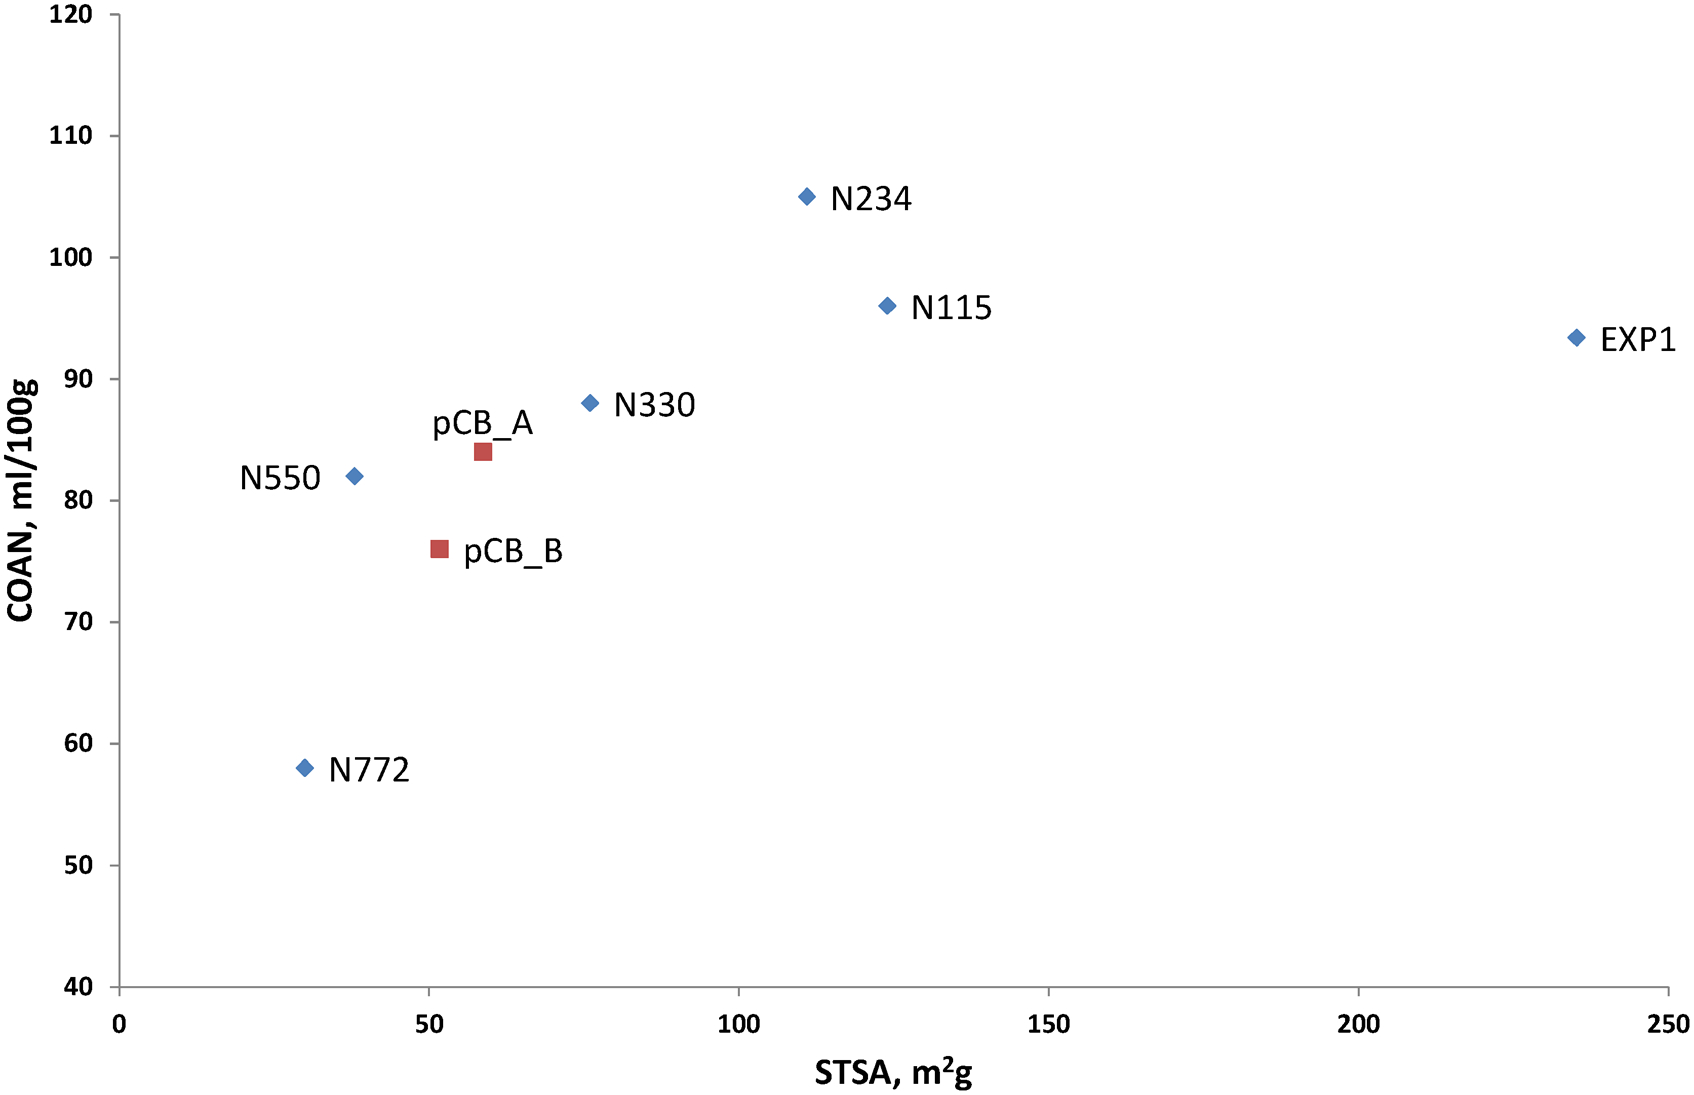
Colloidal space occupied by pCB samples
TGA weight loss and derivative (dW/dt) profiles of the carbon black and pCB samples are displayed in Fig. 3. Early, minor, weight loss events are due to residual moisture and other volatile materials; this is most evident in the very high surface area EXP1 carbon black, which retained several weight percentage of moisture after the drying cycle. The introduction of air leads to the major weight loss event: approximately 55→65 min for the pCB materials and 65→75 min for the commercial carbon blacks. The material remaining at the end of the TGA test represents the inorganic/ash content of the sample, being significantly greater in the pCBs.
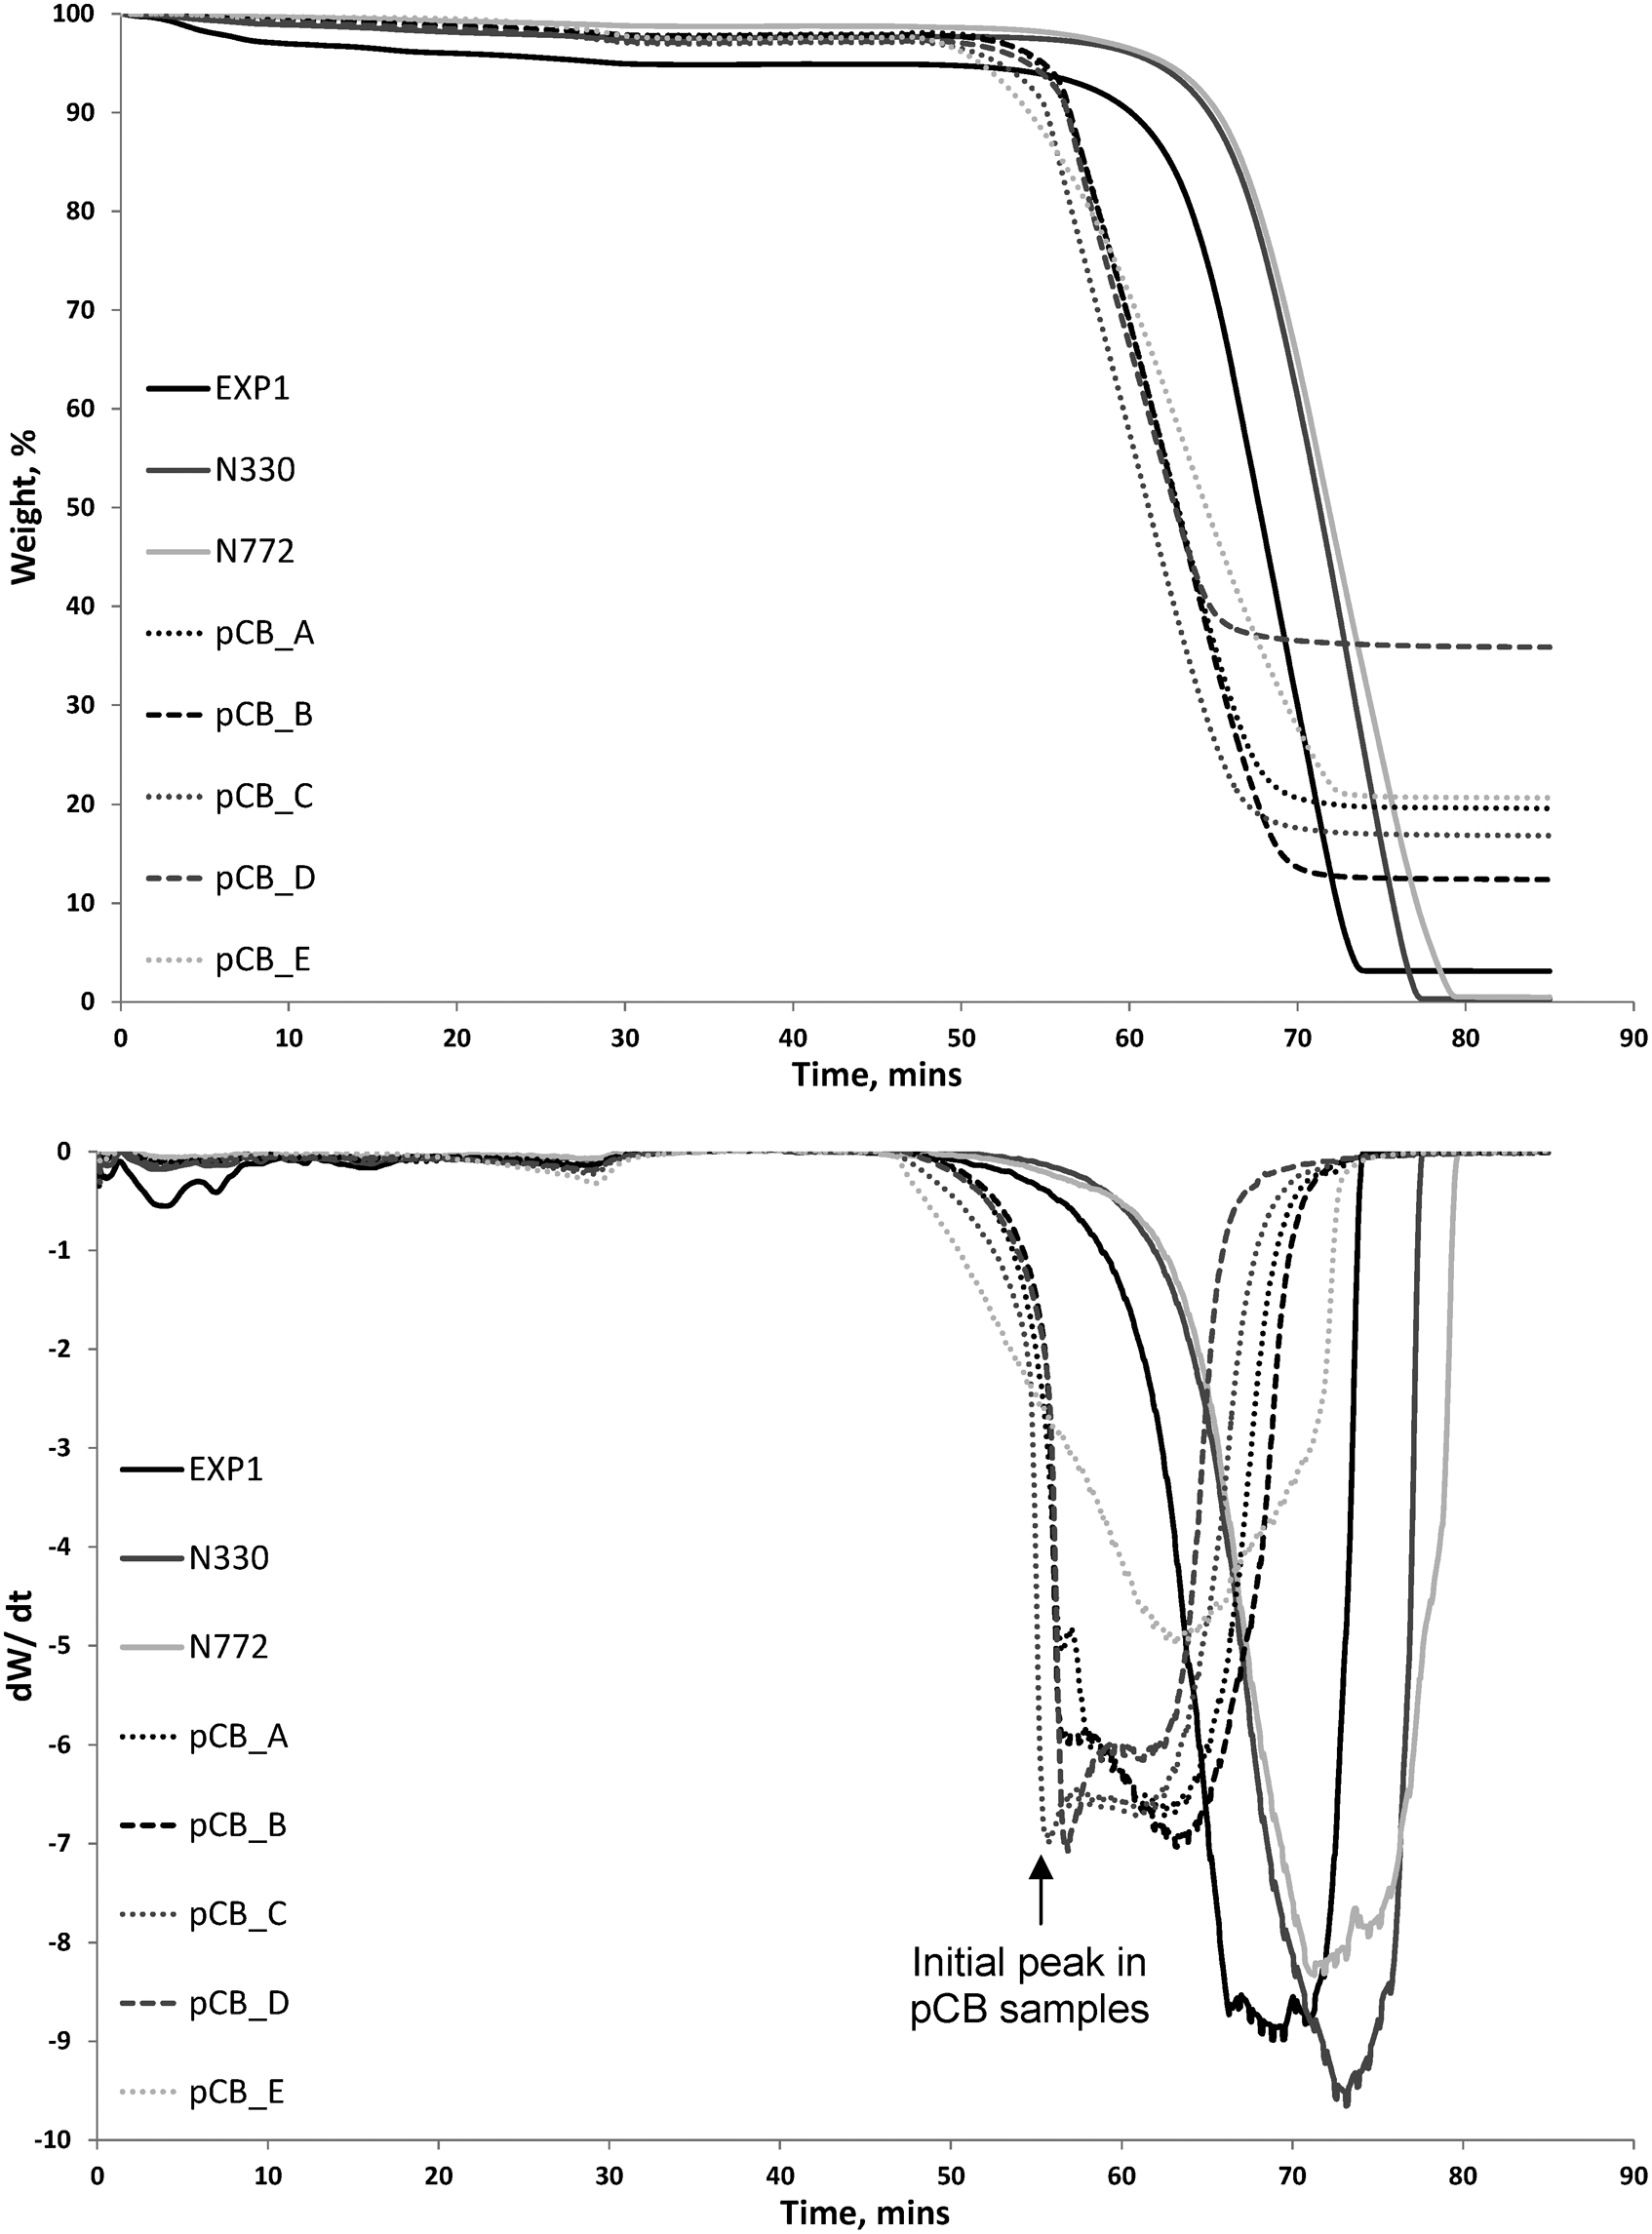
TGA weight loss events: percentage weight loss (top), derivative (bottom)
It is worthy of note that the pCBs exhibit a sharp derivative peak at the onset of oxidisation, suggesting a secondary carbon phase to be present. This may be attributable to the level of carbonaceous residue formed during pyrolysis. The weight recorded at the time of this peak (minus that at the introduction of air) was used to estimate the levels of carbonaceous residue in each pCB sample. The values generated are in general agreement with those previously estimated by Darmstadt and co-workers: 24
pCB_A = 9·0%
pCB_B = 7·4%
pCB_C = 10·1%
pCB_D = 10·9%
pCB_E = could not be estimated, initial peak poorly defined.
The overall composition of the pCB and a selection of the carbon black samples are provided in Fig. 4, further highlighting the non-carbon content of the pyrolysis products. EDX analysis confirmed silica to account for the majority of the inorganic content of the pCB samples, a reinforcing filler commonly compounded into tyre treads. Zinc oxide, utilised in sulphur cure systems, is a further contributor. The remaining inorganic species present were sulphur, iron, aluminium and alkali/alkali earth metals. The range of inorganic content within the pCB samples (12–36 wt-%) is a reflection of the differing feedstock used, and will be a useful aid in determining the effects of this parameter on in-rubber performance.
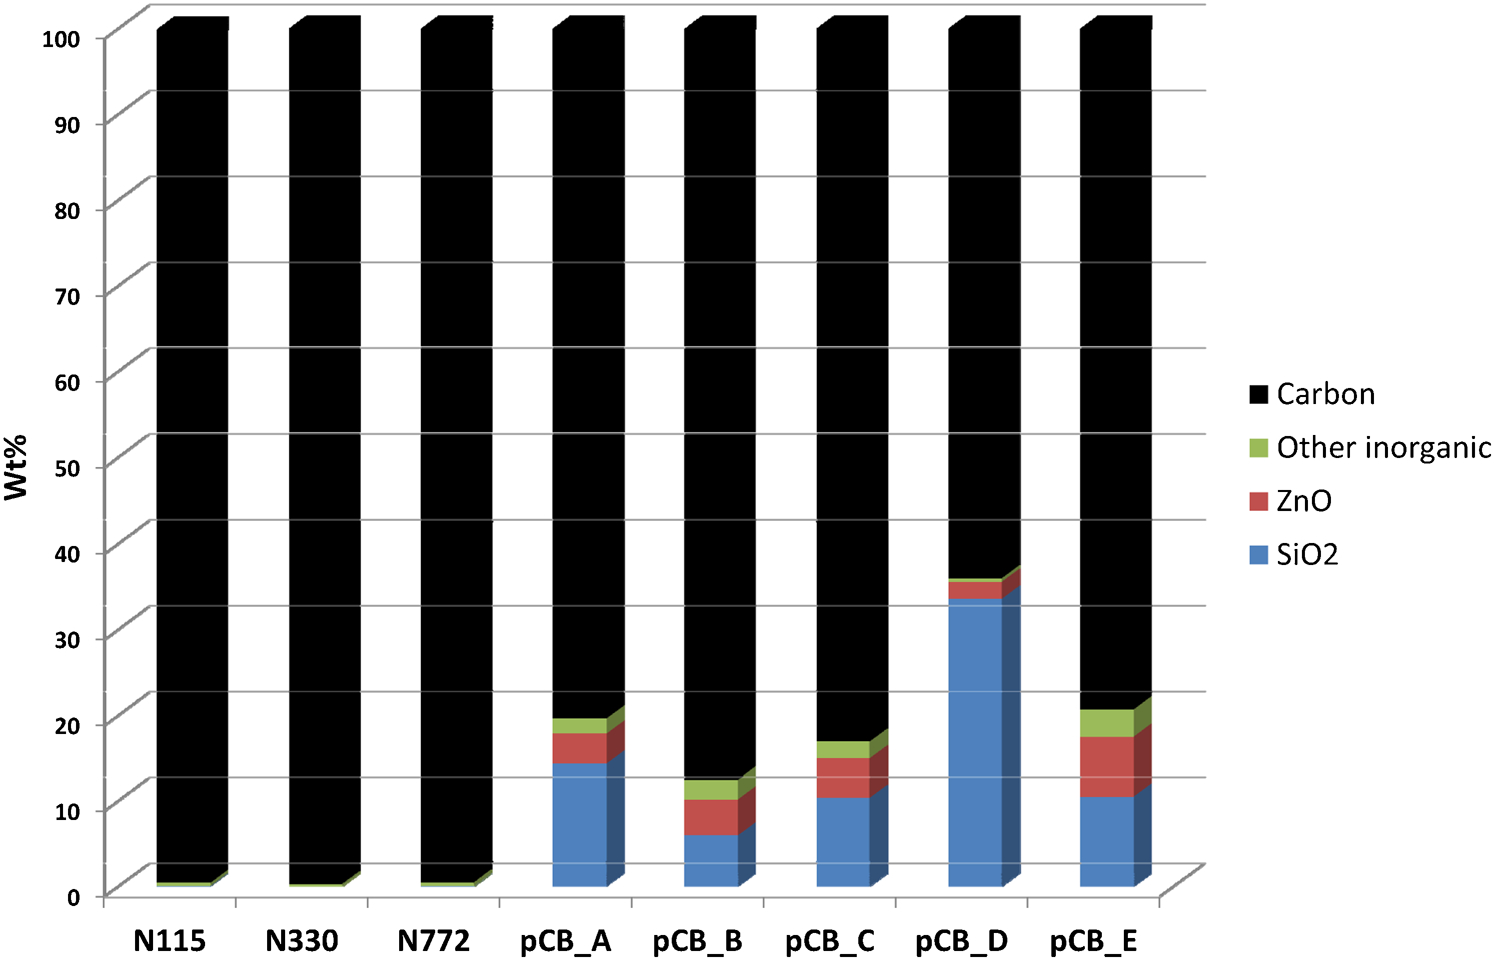
Composition data derived from TGA and EDX analysis
Maurer 25 reported on a correlation between carbon black surface area and the temperature to 15% decomposition (T15%) during TGA testing. The relationship is based on commercial carbon blacks having the same surface activity per unit area, with modified carbon blacks falling away from this relationship. For the carbon blacks included within this study, the correlation between surface area and T15% generated an R2 value of 0·85. Utilisation of a T50% value (temperature to 50% carbon decomposition) yielded an improved R2 value of 0·97 (Fig. 5).
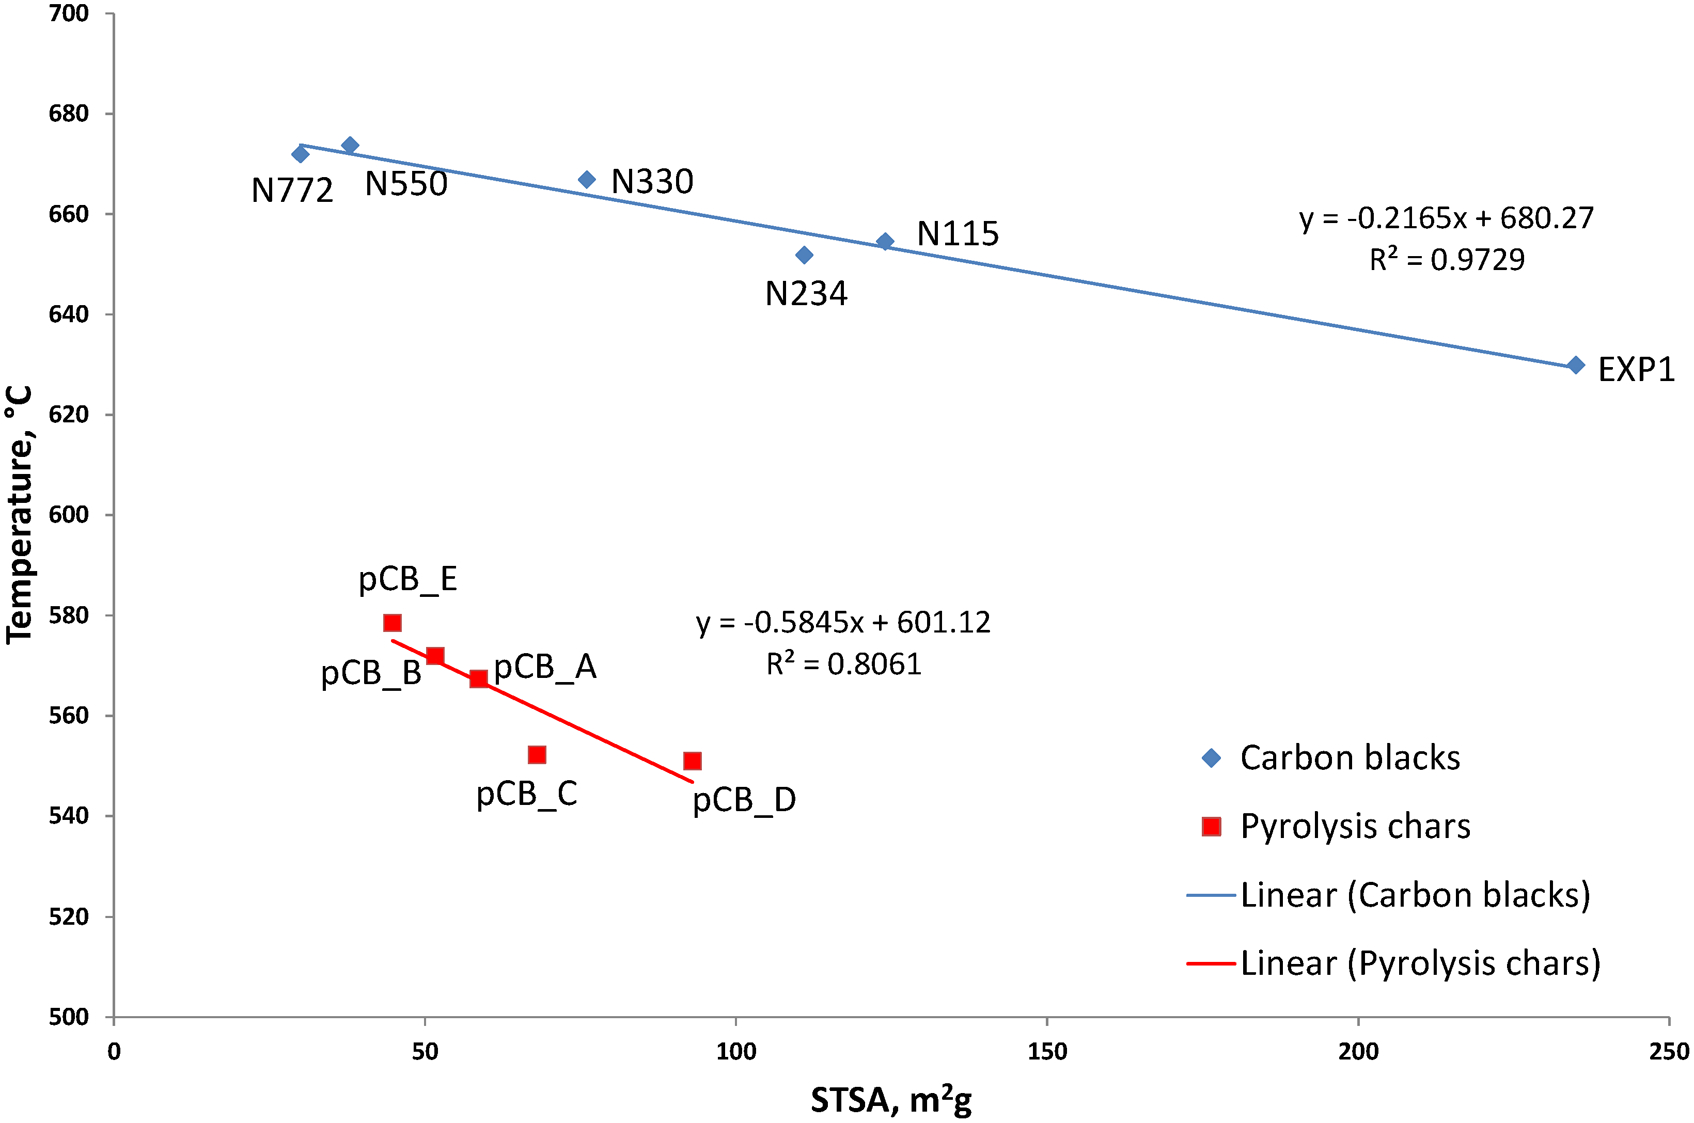
Carbon black and pCB T50% values versus surface area
A general correlation between surface area and T50% of the pCB samples is apparent, albeit significantly different to that identified with the carbon blacks. The T50% values rely solely on the carbon content of the pCB fillers, suggesting the carbon specific surface activity to be broadly similar regardless of the pyrolysis process or feedstock utilised. It has been suggested that lower T50% values indicate carbon blacks with increased surface activity; 7 therefore, it could be argued that the surface activity of the pCB samples is equivalent to >500 m2 g−1 carbon blacks. This is contradictory to previous studies which confirmed pCB to have reduced levels of surface activity due to the presence of carbonaceous residues.3, 21–24 It is more likely that the amorphous nature of such residues contributes to the earlier onset of oxidisation over that of a carbon black, which contains both amorphous and graphitic phases. To emphasise the relationship between the graphitic content and oxidation temperature, a graphite sample (of unknown surface area) was tested under the same conditions, producing a T50% value of 822°C, well above that of the carbon blacks and pCBs. The previous heat history of the pCB samples is also likely to contribute to the earlier onset of oxidation.
In-rubber evaluation
This section covers the evaluation of pCB fillers in relation to carbon blacks, in-terms of processing, rheology, physical and dynamic properties.
As the dispersion of filler approaches an optimum level during mixing, viscosity drops and the energy required to turn the rotors approaches a plateau (Fig. 6). The rate at which the curves reach an equilibrium state is an indication of the ease of filler incorporation within the rubber matrix, which will be a function of both the filler surface area and structure level. The greater the surface area to be wetted, the greater the energy required to achieve incorporation/dispersion. Conversely, greater structure levels increase the internal mixing shear forces, which lead to improved levels of dispersion. This is demonstrated by the very high surface area, moderate structure, EXP1 carbon black which has a shallow incorporation profile and high final viscosity. The pCB samples have incorporation profiles similar in shape to that of N772, albeit with higher final viscosities.
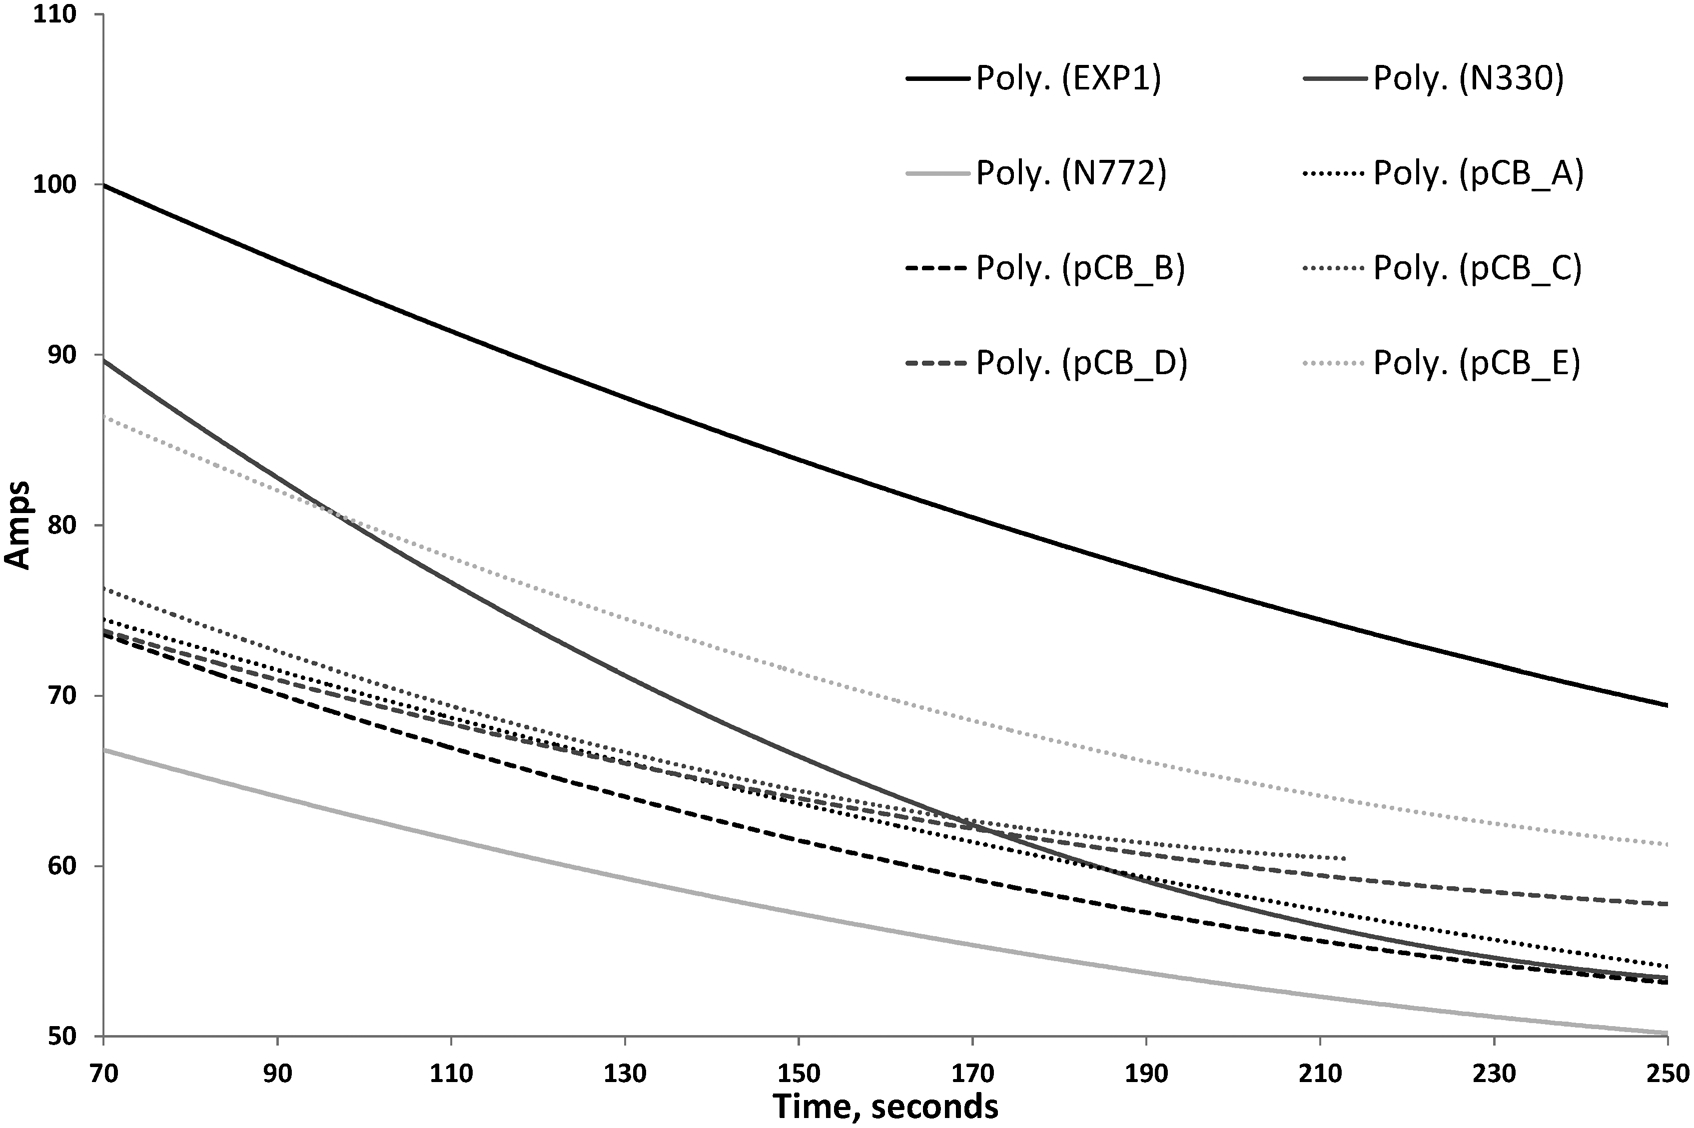
Masterbatch filler incorporation curves
Optical microscopy was used to assess the levels of filler dispersion achieved within each compound with representative images provided in Fig. 7. It is immediately evident that the dispersion levels within the pCB filled compounds are inferior to those filled with the commercial carbon blacks. The pCB compounds can be ranked in the following order (from best to worst).

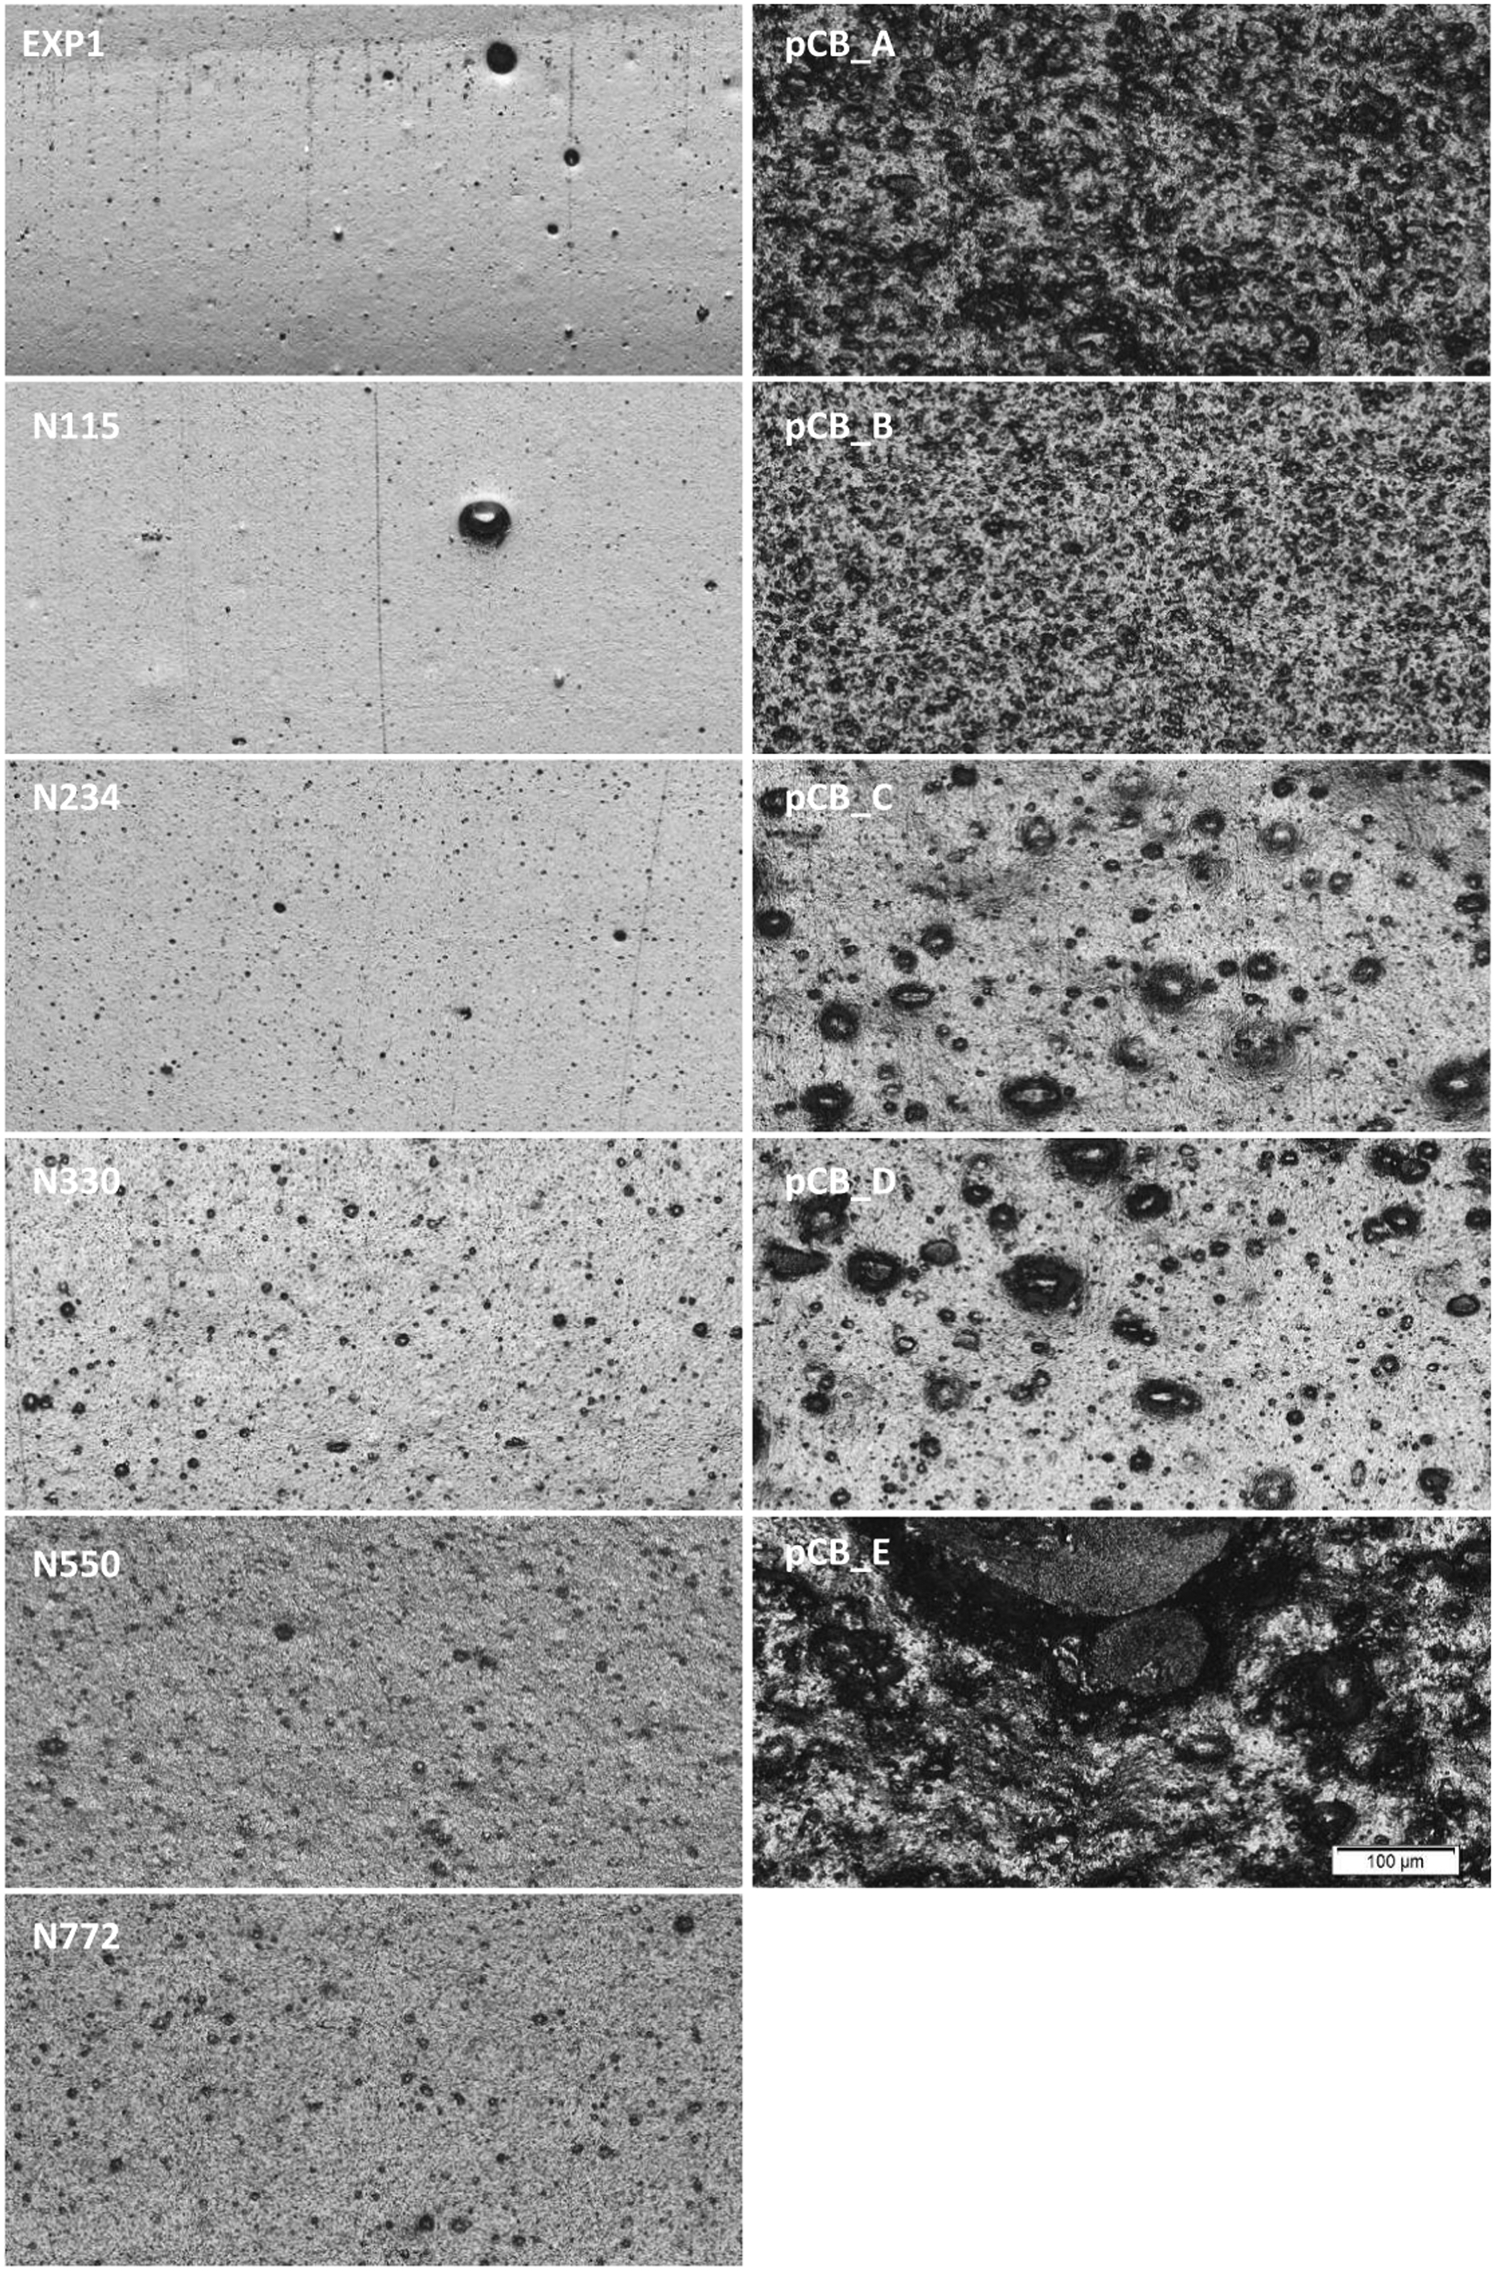
Filler dispersion images
The maximum size of the undispersed pCB domains appears to be closely related to the milled particle size (provided in Table 1). The masterbatch mixer profiles (Fig. 6) confirm the mixing energy had approached a plateau for all pCB samples, indicating that optimal dispersion levels had been achieved. If this is the case, it further suggests that the dispersed particle size is indeed governed by the milling step. Identification of the aggregate size distribution post-milling and post-mixing will be required to verify this hypothesis. Poor dispersion adversely affects physical properties and extruded surface finish, so improvements in this area will significantly expand the potential applications of the recyclate. Owing to the physical appearance and very poor dispersion of pCB_E, this compound was deemed unsuitable for further testing.
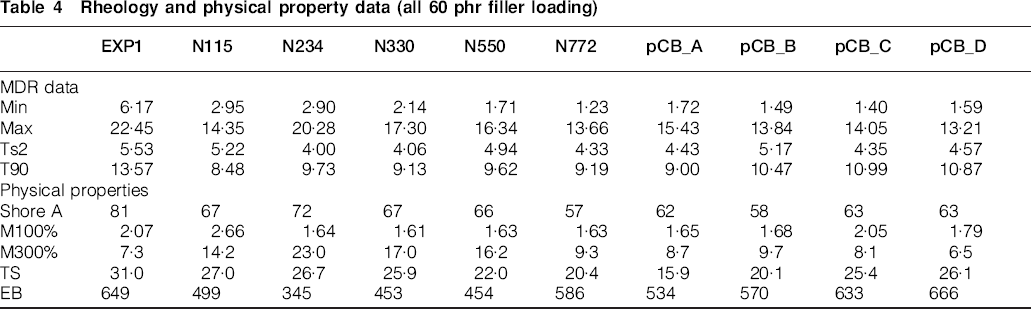
Detailed discussion regarding the differences between the physical properties of the carbon black grades is beyond the scope of this project, however, MDR and basic physical property data are provided in Table 4 for reference. Again, the N772 carbon black provides the closest match to the pCB samples, further highlighting the level of performance suggested by their colloidal properties is not being realised. Based on this data, the pCB samples can be considered as semireinforcing fillers with broadly similar cure characteristics to conventional carbon black.
Rheology and physical property data (all 60 phr filler loading)
Plots of elastic modulii (E′) against strain amplitude are displayed in Fig. 8. For the commercial carbon blacks, strain dependency was found to increase with surface area, as expected with the associated increase in filler–filler interactions. Plots of loss modulus (E″) and tan δ (E″/E′) show the same trend (not shown). The pCB samples all exhibit elastic and loss moduli falling between that of the N550 and N772 carbon blacks, in line with the physical property data. There are a number of factors that will be contributing to the strain dependency of the pCB filled compounds, these being:
carbon content: the average carbon content of the carbon black samples was measured as 97·7%, with volatiles and ash accounting for the remaining 2·3%. The carbon content of the pCB fillers was in the region of 61·3–85·4%. Based on these figures, actual carbon loadings can be calculated:
Carbon blacks = 58·6 phr
pCB_A = 46·9 phr
pCB_B = 51·2 phr
pCB_C = 46·1 phr
pCB_D = 36·8 phr
The reduced effective carbon loadings with the pCB's will inherently reduce carbon filler–filler interactions, thus reducing the Payne effect
carbonaceous residue content: filler–filler interactions between commercial carbon black particles are associated with the van der Waals type interactions between the graphitic crystallite ends exposed at the surface. It has been shown that pCB contains a proportion of carbonaceous residue formed during decomposition of the polymer. 3 It is proposed that the amorphous nature of such residues deposited on the original carbon black surface (as suggested via the TGA investigation), leads to a reduction in filler–filler interactions
ash content: the biggest contributor to the ash content of the pCB fillers was shown to be silica (Fig. 4), which will contribute to the networking effect. Silica, absent a coupling agent, exhibits stronger filler–filler interactions over that of carbon black. The other inorganic components, being of significantly lower surface area, will act as diluent fillers only
dispersion: Payne demonstrated that improved carbon black dispersion through extended mixing cycles reduces the strain dependency of the compound.
26
From this viewpoint, it may be expected that the poor dispersion levels achieved with the pCB fillers will have some contribution to increasing ΔE′ (
 −
−
 ). ΔE′ does rank the fillers in the same order as would be expected from the dispersion images (and STSA measurements), with the higher surface area of pCB_D accounting for the greater ΔE′ value over pCB_C:
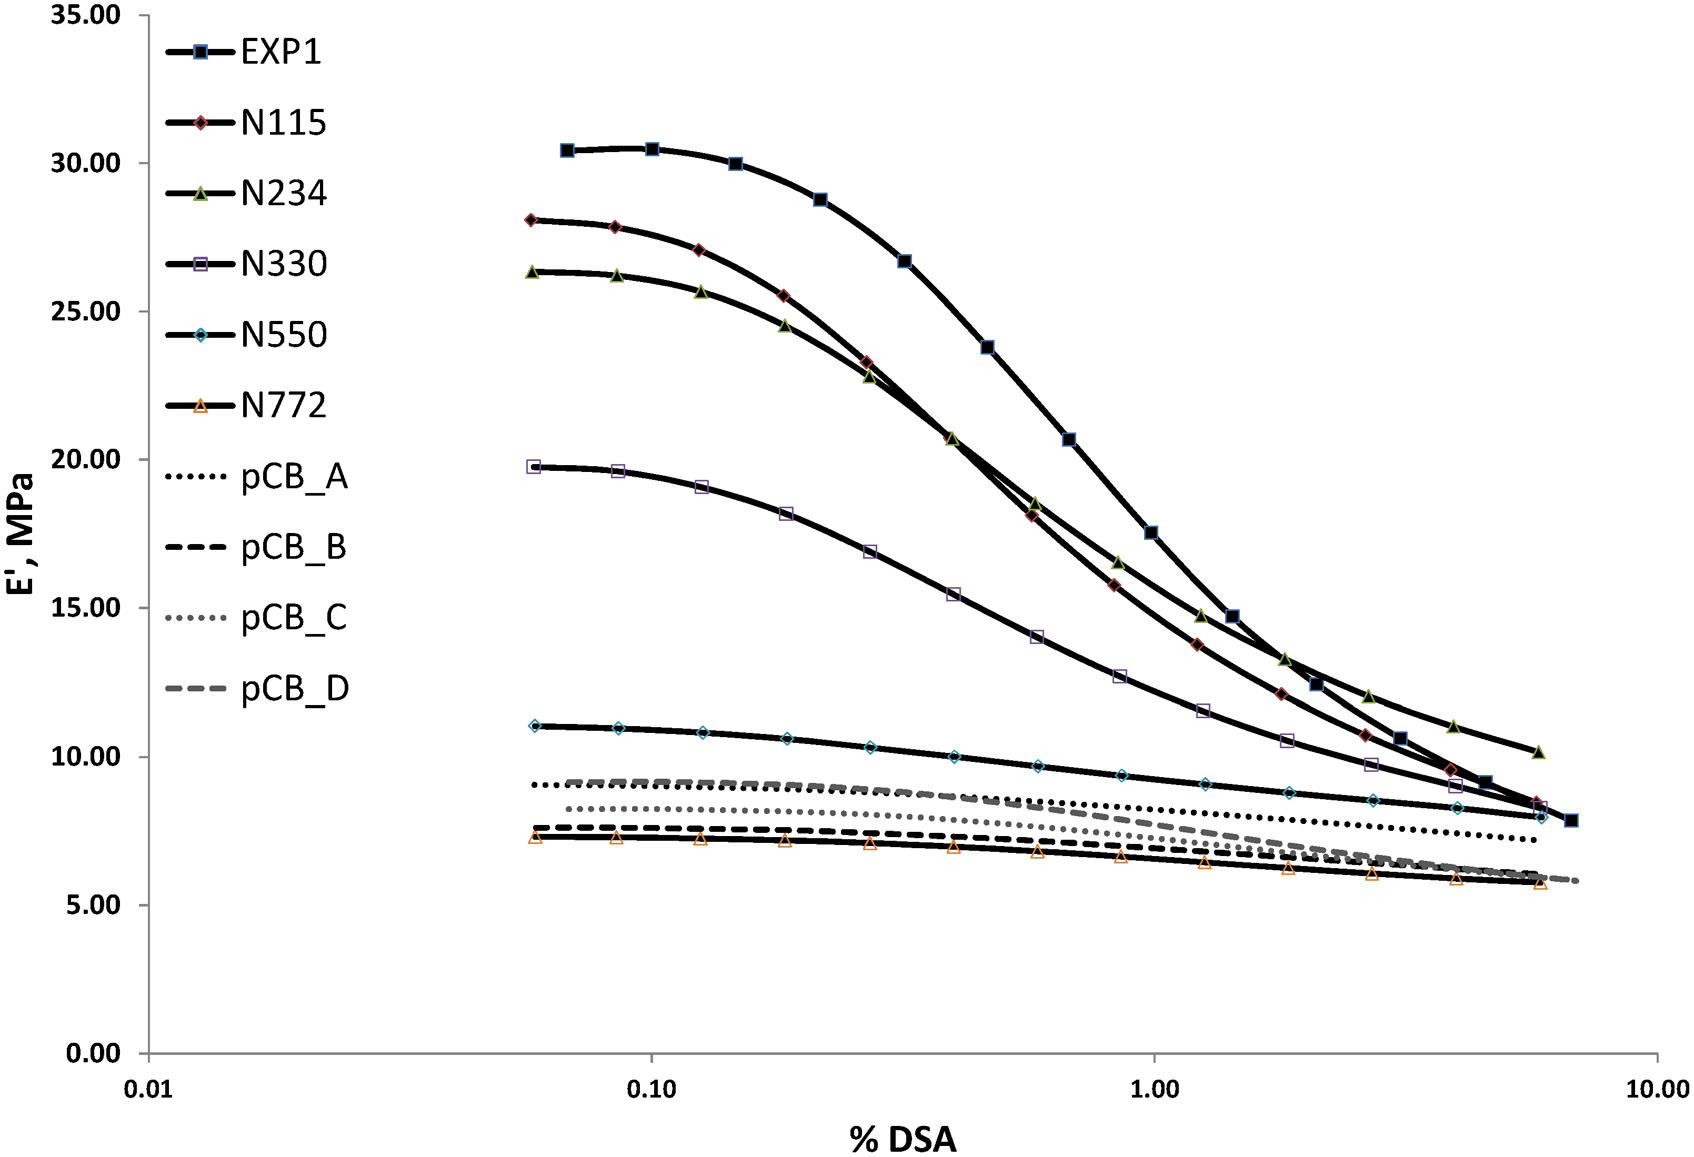
Elastic modulus (E′)

A plot of E″ maximum against ΔE′ for commercial carbon blacks produces an excellent correlation (Fig. 9), in line with previous studies.15–17 The authors also demonstrated that carbon blacks exhibiting significantly different surface activity or morphology to the norm, fall away from this line of unity. The data does suggest the pCB samples have reduced surface activity, likely resulting from the deposition of carbonaceous residues during pyrolysis. Extrapolation of the trendline indicates that pCB of higher surface area will fall further away from the performance of the commercial carbon blacks. The data are in agreement with the T50% values generated via TGA testing, in that all pCB samples appear to have similar surface characteristics regardless of the pyrolysis process or feedstock adopted.

versus ΔE′
The relationship between carbon black surface area and the network effect (ΔE′) is provided in Fig. 10. The commercial carbon blacks generate an R2 value of 0·99 when the very high surface area EXP1 grade is not included. This chart further highlights the ΔE′ values of the pCB samples to fall well below that predicted from their respective surface area measurements. Reduced surface activity due to the amorphous nature of carbonaceous residues will contribute to this, but it also suggests that the surface area predicted by STSA measurements is overestimating that available to the polymer matrix. The correlation between networking efficiency and surface area for the pCB samples produced an R2 value of 0·99, suggesting the filler–filler interactions are not influenced by the non-carbon species present. If it is accepted that the carbonaceous residues formed on the carbon black surfaces are dictating surface chemistry, then it is likely that such residues will also form on the surfaces of the inorganic components, imparting the same surface chemistry. As such, all particles behave the same surface activity regardless of their bulk composition.
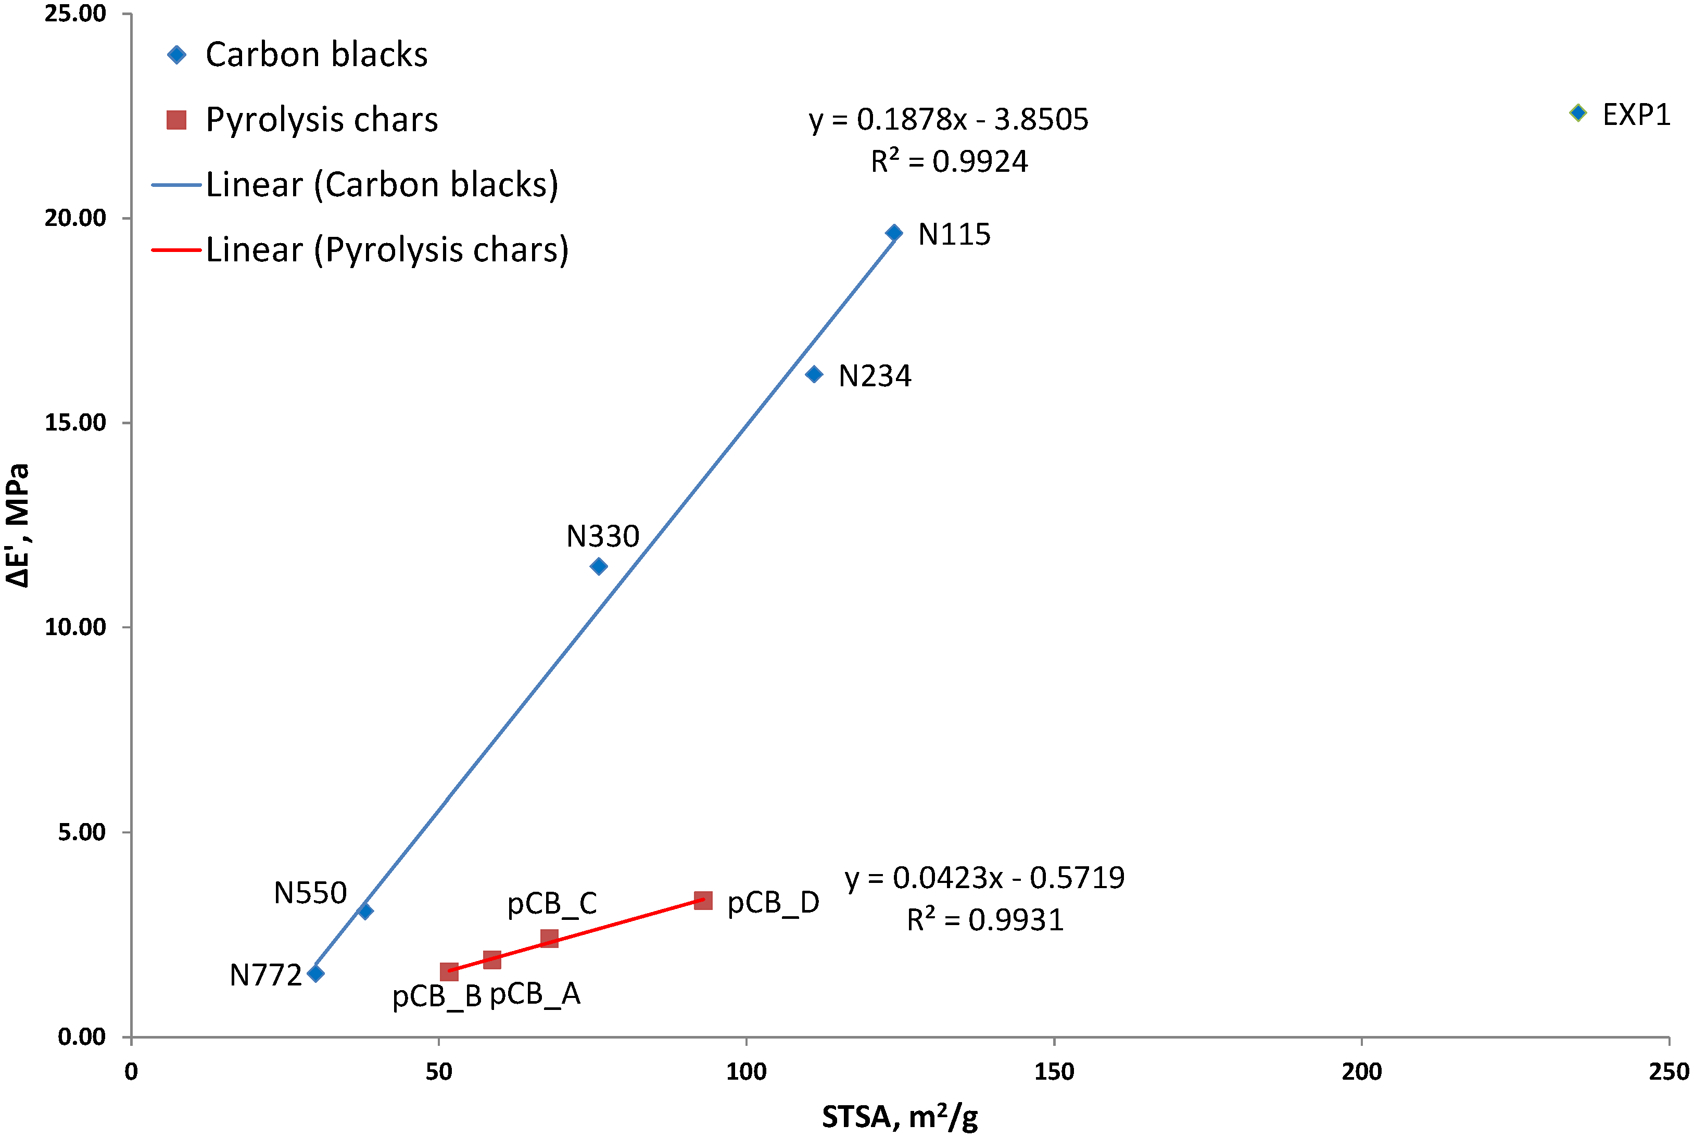
ΔE′ versus surface area
Additional compounds were prepared containing pCB fillers at loadings adjusted to match the carbon content of the carbon black filled compounds, i.e. 58·6 phr. Note that pCB_C and pCB_D were not included at this stage due to limited supply of material. As expected, increased shear forces were generated during the mixing cycle, but no evidence of improved dispersion was observed. This further supports the conclusion that the milled particle size of the pCB materials is influencing dispersability. Rheology and physical property data are provided in Table 5, showing the expected increase in hardness and stiffness over the 60 phr loaded compounds. Increasing the pCB content has also led to faster scorch and cure times; a result of the higher mixing temperatures generated at the higher loadings.
Rheology and physical data for adjusted loading pCB compounds
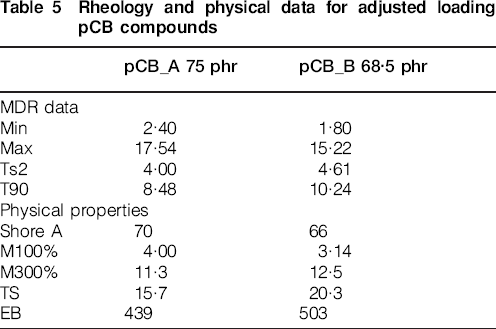
The higher pCB loadings imparted greater strain dependency on the compounds with increased E′ and E″ modulii (graphs not shown); however, the level of filler networking was still well below that predicted by their colloidal properties (Fig. 11). The presence of silica within the pCB samples will also contribute to the measured values of ΔE′; therefore, the values represent an overestimation of the carbon black networking efficiency. At the pCB loadings utilised here, pCB_A and pCB_B contribute 11 and 4 phr of silica respectively. These observations further emphasise the significantly reduced carbon filler–filler and filler–polymer interactions of the pCB fillers in comparison to commercial carbon blacks of the same surface area. The key confirmation gained from the equivalent carbon loading pCB compounds is that the dispersability of the filler is having a greater influence on performance over that of the ash content.
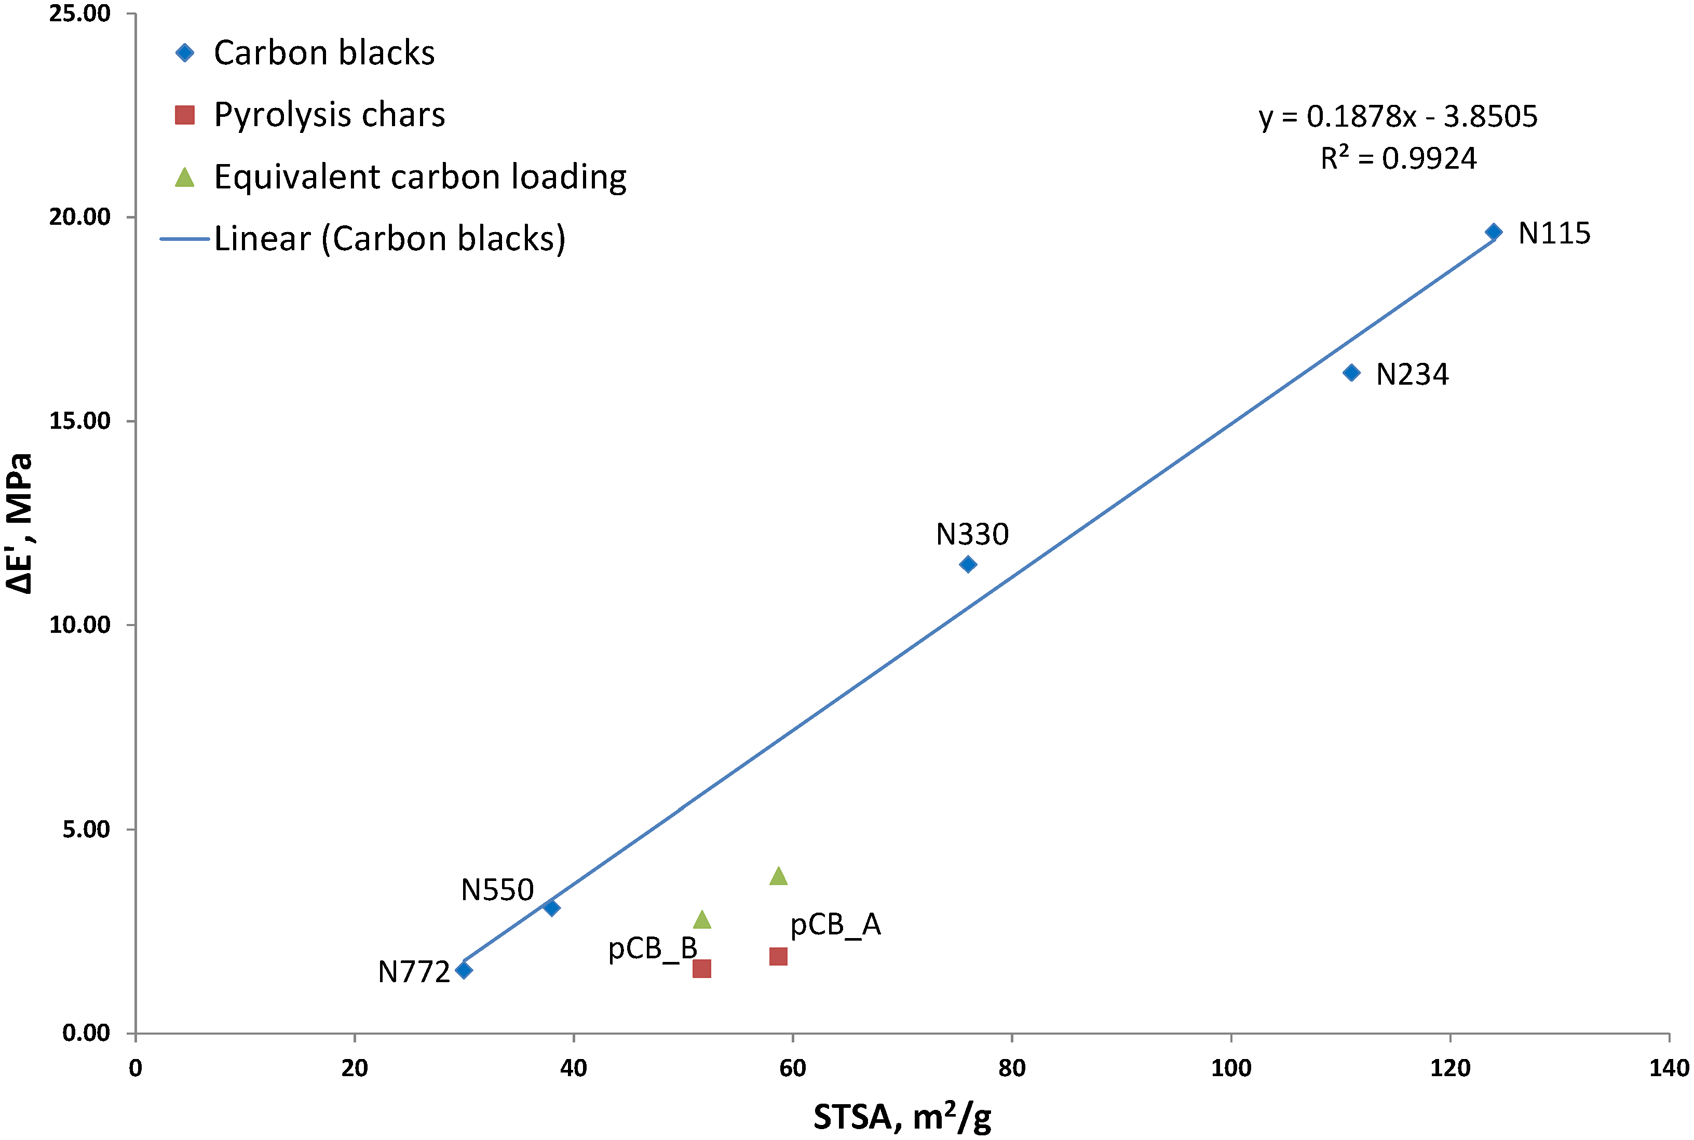
ΔE′ versus surface area for equivalent carbon loading pCB compounds
Conclusions
Five pCB samples generated from differing pyrolysis processes and feedstock were subjected to compositional and in-rubber evaluations. The pCB materials were confirmed to consist of varying levels of carbon black, carbonaceous residues and inorganic matter, as reported elsewhere.20–24 The carbon black and inorganic matter being reclaimed compounding ingredients and related impurities, with the carbonaceous residues being formed by condensation of polymer decomposition products during pyrolysis. 3 The levels of carbonaceous residue were estimated to be in the region of 7–11 wt-%, via TGA testing. EDX analysis highlighted silica and zinc oxide to account for the vast majority of the inorganic matter within the samples, with levels varying in accordance with the selected feedstock.
The relationship between carbon black surface area and T50% (temperature to 50% decomposition) reported by Maurer 25 was confirmed. This is based on commercial carbon blacks having consistent surface activity per unit area. A similar relationship was observed for the pCB samples, albeit at T50% values significantly below those of the carbon blacks. The T50% values rely solely on the carbon content of the pCB fillers, suggesting the carbon surface activity per unit area to be broadly similar regardless of the pyrolysis process or feedstock used. It is proposed that the amorphous nature of the carbonaceous residues at the pCB surface contributes to the earlier onset of oxidation over that of carbon black, which contains both amorphous and graphitic phases. The relationship between graphitic content and oxidation temperature was emphasised via testing of a graphite sample which yielded a T50% value well above those of the carbon blacks.
A generic SBR formulation containing 60 phr filler was used to evaluate the in-rubber performance of the pCB fillers in relation to carbon blacks ranging in surface area from 30 to 235 m2 g−1. Traditional surface area and structure measurements suggest the pCB samples to have colloidal properties falling in the region of N300 to N500 carbon blacks; however, in-rubber performance was found to be more akin to N700 series carbon blacks. Fundamentally, this disparity in performance appears to be the result of the carbonaceous residues on the pCB surface, which both reduce surface activity and dispersability of the recyclate. Significant improvements in pCB dispersion will be essential in exploiting the potential applications for such materials.
Plots of
 against ΔE′ for commercial carbon blacks generated an excellent correlation, as had been previously reported.15–17 Similarly, the relationship was apparent for the pCB samples but having a more acute slope, further confirming reduced surface activity. The networking efficiency (as indicated by ΔE′) of the pCB fillers was well below that predicted from their respective surface area measurements. Reduced surface activity due to the amorphous nature of carbonaceous residues will contribute to this, but it also suggests that the surface area predicted by STSA measurements is overestimating that available to the polymer matrix. The correlation between networking efficiency and surface area for the pCB samples produced an R2 value of 0·99, showing the level of filler–filler interactions to be independent of the non-carbon species present (such as silica and zinc oxide). If it is accepted that the carbonaceous residue formed on the carbon black surface is dictating surface activity, then it is likely that such residues will have also formed on the surfaces of the inorganic components, imparting the same surface chemistry. The DMA data are in good agreement with the T50% values generated by TGA testing, in that all pCB samples appear to have similar surface characteristics regardless of the pyrolysis process or feedstock adopted.
Based on the findings of this study, current pCB materials can be considered as semireinforcing fillers and could find use in applications currently occupied by N600 to N700 series carbon blacks. It is considered that attempts to optimise the pyrolysis process for in-rubber performance (rather than yield) may prove fruitful in terms of improving dispersability and subsequent reinforcement. It is the intention to use the TGA and DMA calibration type graphs generated herein, as feedback tools for optimising the pyrolysis process.
Footnotes
Acknowledgements
The authors would like to thank Avon Rubber PLC for funding this work and Birla Carbon for providing the carbon black samples.