
Abstract
The present paper deals with the fatigue crack growth in a carbon black-filled styrene butadiene rubber (CB-SBR) under fully relaxing loading conditions. More precisely, it is devoted to the determination of the scenario of crack growth. For that purpose, an original ‘microcutting’ technique, previously applied by the authors on natural rubber (NR), is used to observe microscopic phenomena involved in fatigue crack growth thanks to scanning electron microscopy (SEM). Results show that the crack tip grows following a tearing line by generating ligaments; it explains the differences between fatigue responses of crystallisable and non-crystallisable rubbers during crack propagation. So, contrary to crystallisable elastomers such as NR, the microstructure of SBR is similar at crack tip and in the bulk material, and the crack tip does not resist crack propagation. Moreover, the morphology of fracture surfaces only depends on particles encountered by the fatigue crack during its propagation.
Introduction
Most of the studies dealing with fatigue crack propagation in elastomers distinguish the materials, which are subjected to strain-induced crystallisation, and those which do not. It has been shown that strain induced crystallisation has beneficial consequences on fatigue performance at moderate or large strain and reduces sensitivity to environmental effects.1, 2 Trabelsi et al. have used X-rays diffraction to investigate crystallisation in the vicinity of the crack tip under static loading conditions.3, 4 For fatigue loading conditions, we have studied damage at crack tip in carbon black filled natural rubber (referred to as CB-NR through the rest of the paper) and identified physical phenomena involved in fatigue using an original ‘microcutting’ technique. 5 Moreover, these observations have been used to determine the micromechanisms of fatigue crack growth and to highlight the influence of strain induced crystallisation at the microscopic scale.
For non-crystallisable elastomers, continuous crack growth under a static loading conditions can be significant, 6 i.e. no physical phenomenon such as strain induced crystallisation prevents the crack from growing. For fatigue, it is necessary to improve classical results obtained by either purely mechanical approaches7, 8 or fractographic analyses of fracture surfaces 9 by identifying the damage mechanisms at the microscopic scale. In the past, it has been shown that observing the stretched crack tip by scanning electron microscopy (SEM) is an interesting way to investigate these mechanisms.5, 10–12 Nevertheless, no such study was proposed for non-crystallisable elastomers.
The aim of the present work is to apply our SEM observation method detailed in Ref. 5 to carbon black filled styrene butadiene rubber (referred to as CB-SBR through the rest of the paper) in order to exhibit the fatigue damage phenomena and to determine the scenario of fatigue crack growth in these materials. The first section presents material and samples, and briefly recalls the observation method. The second section presents the results and describes the microscopic scenario of fatigue crack growth in CB-SBR. Finally, concluding remarks close the paper.
Experimental method
This section describes samples, loading conditions and experimental apparatus and technique.
Sample and material
The samples considered here are axisymmetric ‘diabolo’ samples as firstly proposed by Beatty. 13 The diameter at the middle of the sample is equal to 20 mm. Aging is overcome by freezing and thaw.
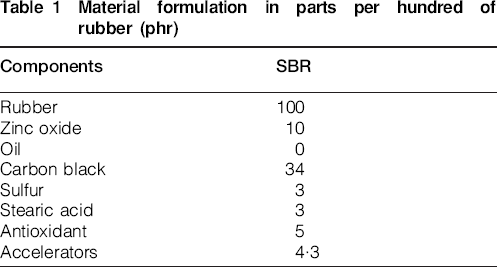
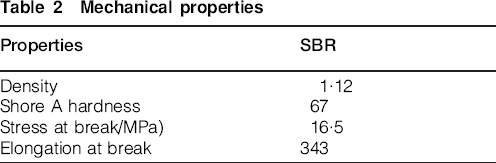
The material is a CB-SBR, cured for 5 min at 160°C (mould temperature). Table 1 summarises its chemical composition, similar to the one of the NR considered in Ref. 5, and Table 2 presents some of its mechanical characteristics. The material being prepared by a random copolymerisation process, polymer chains are structurally irregular and then the material can not crystallise under loading.
Material formulation in parts per hundred of rubber (phr)
Mechanical properties
Fatigue loading conditions
Samples were tested under fully relaxing uniaxial loading conditions at 23°C regulated temperature: sinusoidal signals and loading frequencies below 5 Hz (to limit the rise in temperature of the surface under 20°C). Two types of fatigue tests were performed: experiments until fracture at various maximum stretch ratios between 1 and 2, and experiments until a self-initiated fatigue crack reaches several millimetres long at the surface of the undeformed samples for a stretch ratio equal to 1·33.
SEM and microcutting technique
Microscopic observations are performed with a HITACHI S-3200N model SEM using secondary electrons (samples are coated with a thin gold layer) and an energy dispersive spectrometer of X-ray (EDSX) is used to determine chemical elements on fracture surfaces.
The observation technique has been thoroughly discussed in Ref. 5, it is briefly summarised here. After testing until a self-initiated crack appears at their surface, samples are fixed in a rudimentary static tensile apparatus and stretched to open the crack (stretch ratio equal to 1·33). Then, this apparatus is placed in the SEM to observe the crack tip. Therefore, to observe damage induced by fatigue loading conditions behind the crack, the crack tip is ‘microcut’ by imparting a sufficient amount of energy (by simultaneously stretching the sample to 1·33 and locally concentrating the electron beam) to break cross-links between macromolecules.
Results and discussion
In this section, results issued from the examination of fracture surfaces by SEM are first presented. Then, using our microcutting method, mechanisms of fatigue crack growth at the microscopic scale are identified and features observed on fracture surfaces are related to the morphology of crack tip.
Description of fracture surfaces
The fracture surfaces are observed by SEM; an example of photomicrograph is shown in Fig. 1. To illustrate the discussion, we propose to describe fracture surface with the help of the schematic views presented in Fig. 2.
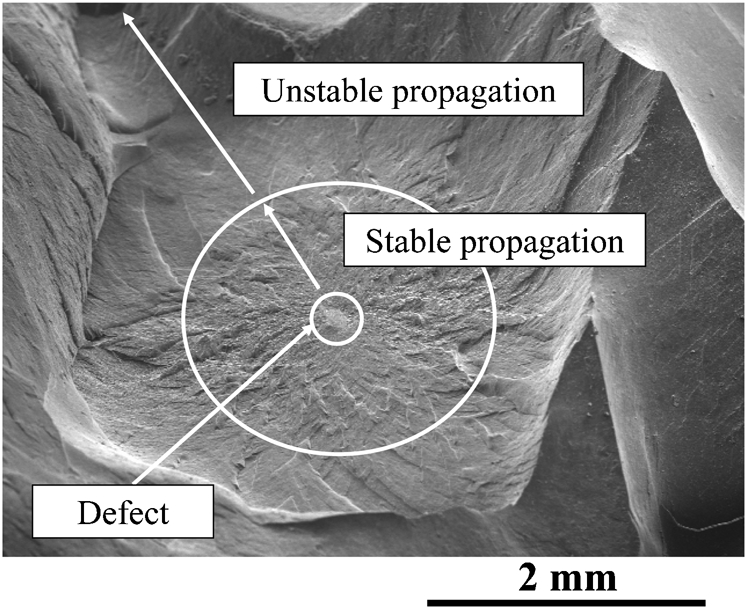
Photomicrographs of fracture surface in CB-SBR
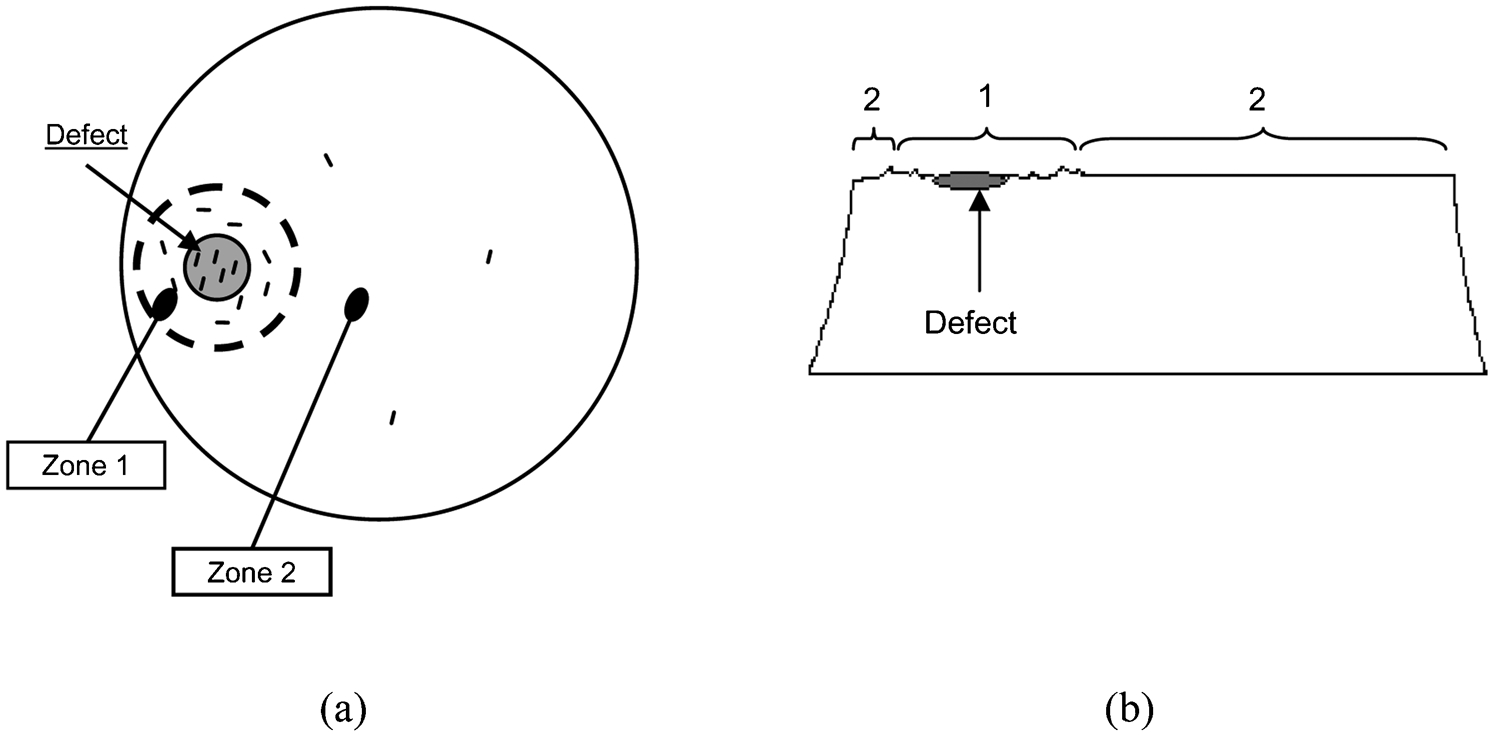
a top view; b side view
Except the nucleation defect area, only two different zones (denoted zones 1 and 2 in Fig. 2a) are observed, independently of the maximum stretch ratio applied. Considering several samples, we observe that the nucleation defect is located between sample surface and 6 mm far from the surface and its maximum size is 300 μm in diameter. As shown in Fig. 3, the EDSX analysis demonstrates that these defects contain more sulphur than the rest of the material. Therefore, they correspond to overvulcanised zones in the section. Surface of Zone 1 is rough; it corresponds to a stable propagation of the crack and surrounds the defect. Its size can reach 6 mm in diameter. Zone 2, which surrounds Zone 1, represents the rest of the fracture surface. It corresponds to an unstable propagation of the crack. The surface is relatively smooth and slight bifurcations of the crack can be observed. No fatigue striations are observed for every loading conditions considered in this study.
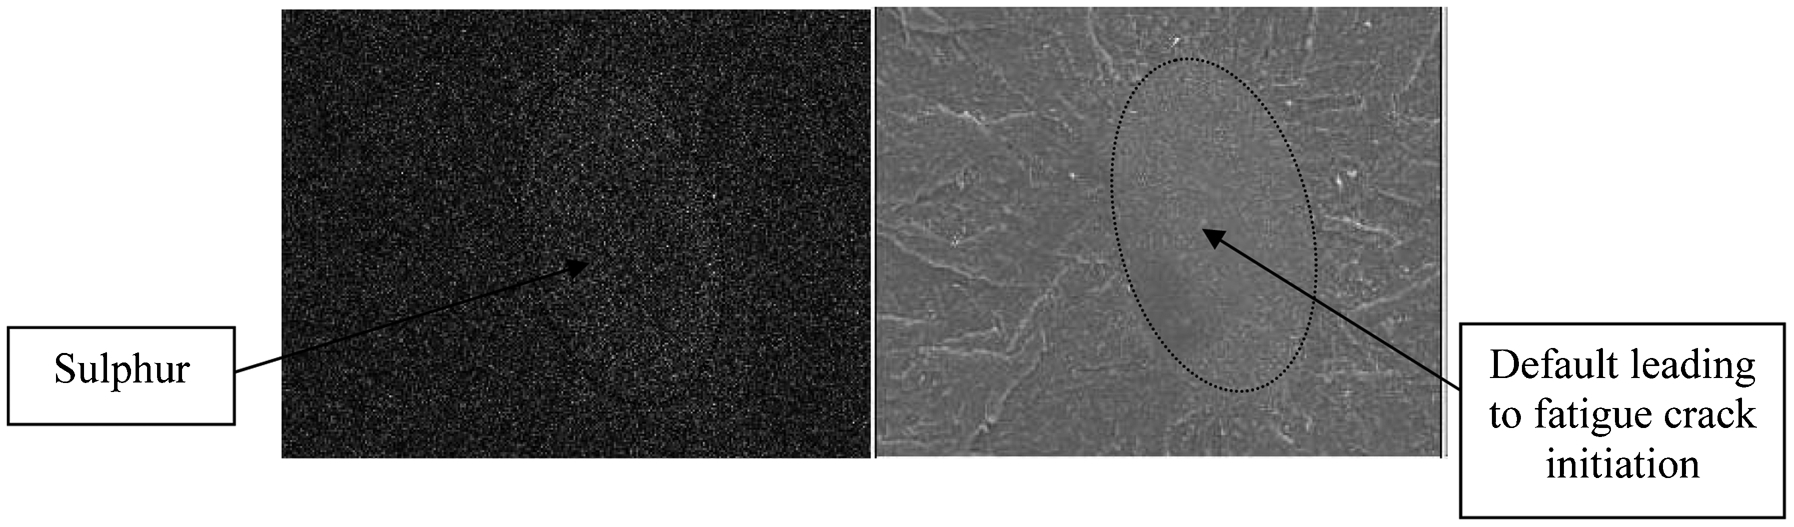
EDSX analysis of defects from which crack initiation occurs
These results are quite different from those obtained for CB-NR. 14 Indeed, for CB-NR, Zone 1 is always located in subsurface (between 100 and 500 μm far from the surface). Moreover, Zones 1 and 2 correspond to stable propagation of the crack and are covered with wrenchings issued from the failure of ligaments at crack tip. Finally, fatigue striations can be observed just before sample failure.
Description of crack tip
As shown previously, the study of the morphology of fracture surfaces is not sufficient neither to identify phenomena involved in crack propagation nor to explain fracture chronology. Thus, it is necessary to investigate crack propagation by observing crack tip. For this purpose, observation is carried out on samples for which fatigue tests were stopped when a 5 mm length crack appears at their surface.
Figure 4 presents the fatigue crack and its surroundings: Fig. 4a shows the schematic view, and Fig. 4b presents a photomicrograph of the three zones D, E and F. As for CB-NR, six different areas can be observed as the samples is stretched to the elongation applied during the fatigue test. Before the occurrence of the crack, there are only two zones: the central zone of the sample, denoted A in Fig. 3a, which is the most stretched part of the specimen, and Zone B situated on both sides of Zone A. When the crack occurs, four new zones appear: Zone C which corresponds to the parts of Zone A that are relaxed during crack opening, and Zone D, E and F which constitute the crack itself. Figure 3b shows that Zone F stands for the crack tip, Zone D represents the smooth surfaces generated during crack growth and Zone E denotes the frontier between them. In fact, the major difference between Zones D and F is their stretching level. These three zones also exist for CB-NR, except that Zone D is covered with numerous wrenchings (see Fig. 4 in Ref. 5).
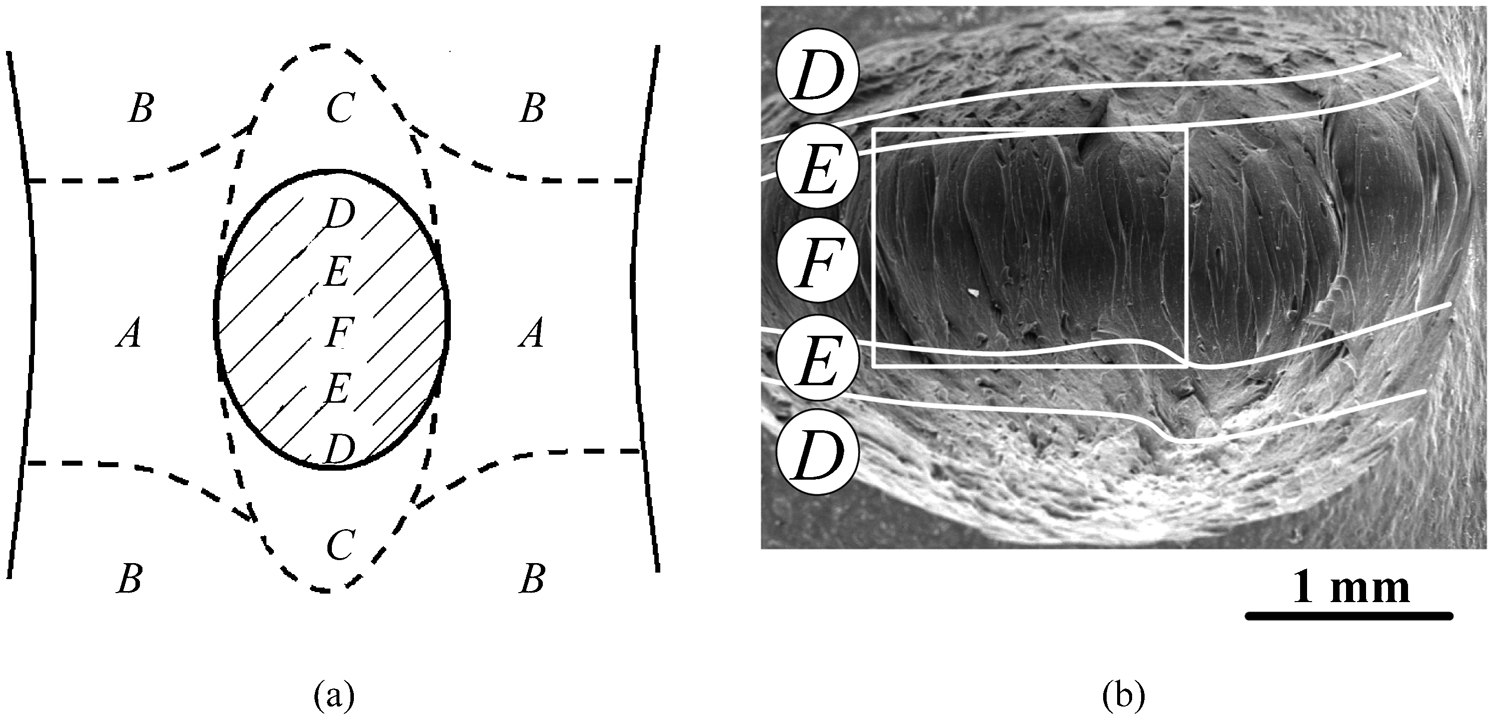
a schematic view of crack (D–F) and its surroundings (A–C) and b front view of crack for CB-SBR
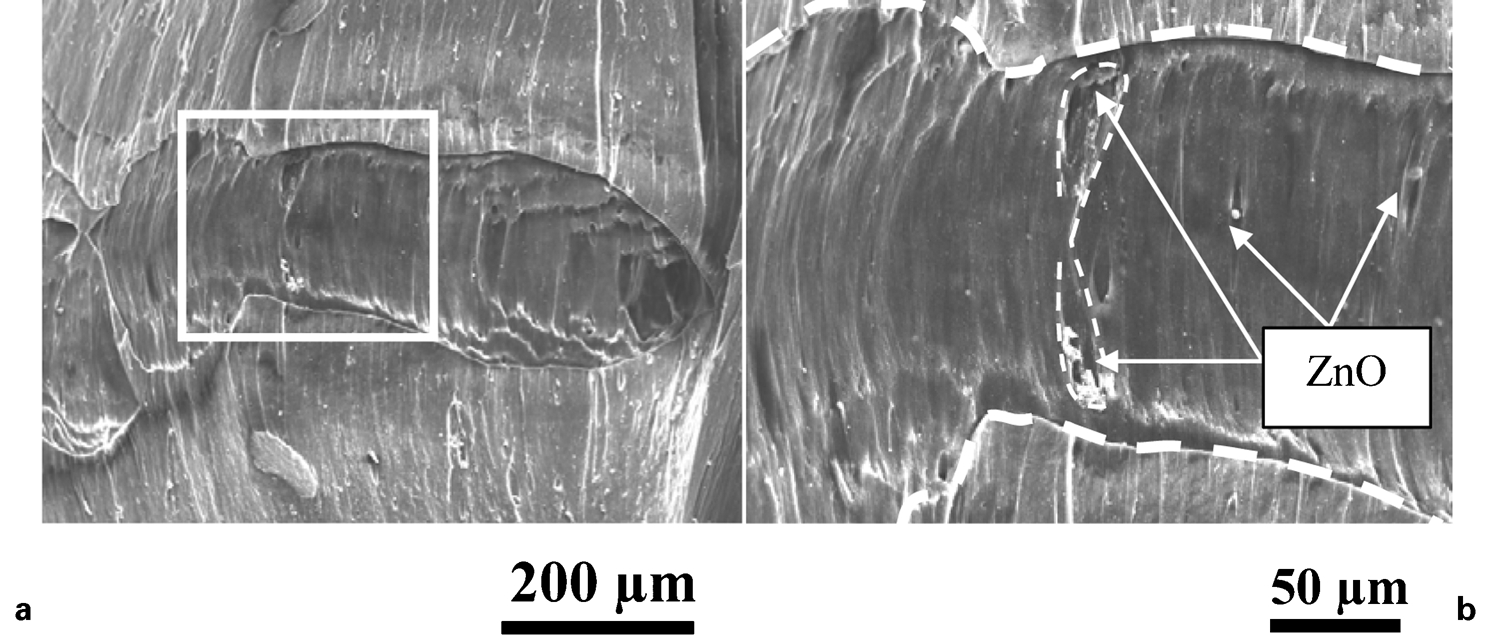
Figure 5 presents magnification of CB-SBR crack tip. This photomicrograph corresponds to the encircled zone in Zone F in Fig. 4b. Many of long ligaments take place at crack tip and the size of Zone E is revealed very small (see the top of Fig. 5). Therefore, it seems to indicate that the broken surface generated by crack growth immediately joins both sides of the crack (Zone F). To describe the zone in which the crack propagates, we should continue to zoom in at crack tip. Figure 6 presents two magnifications of the crack tip. As shown in Fig. 6a, every ligament comes from a line that crosses the crack tip (the white dotted line in the figure). This result is in agreement with the work of Gent 10 who observed, for static loading conditions, a ‘tear line’ at crack tip in a precut carbon black-filled polybutadiene (a material that does not crystallise under loading) sample. In the following, the term ‘tearing line’ will be preferred to ‘tear line’ as suggested by Gent. Figure 6b is a zoom in of the encircled zone in Fig. 6a. Zinc oxides are present everywhere on the surface. Some of them are surrounded by elliptical cavities which walls are forming ligaments. The size of these oxides varies between a few hundred nanometers and 5 μm.
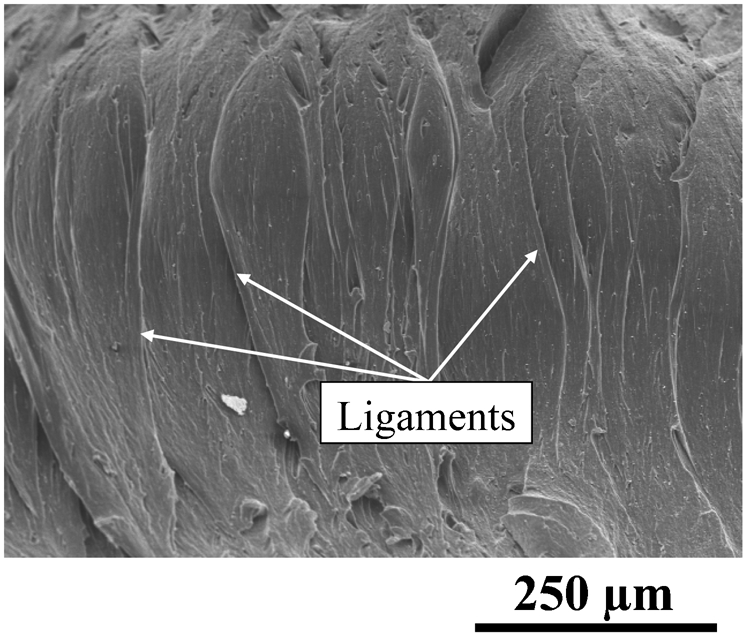
Magnification of Zone F in CB-SBR
Details of crack tip for two magnifications
This brief description of the whole crack is not sufficient to determine the scenario and chronology of fatigue crack propagation. Thus, our microcutting technique is now applied to observe the damage generated by fatigue behind the crack tip.
Crack tip microcutting
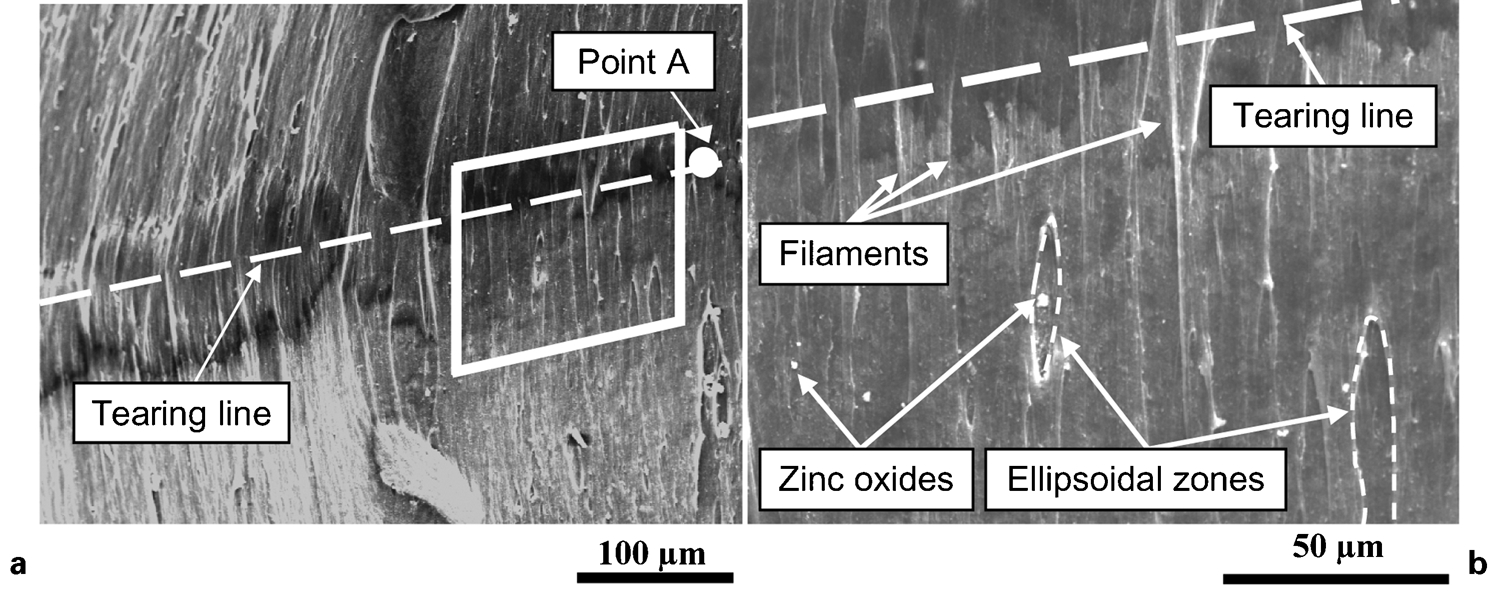
The zone propitious to microcutting corresponds to the tearing line previously described. It is the zone in which crack grows with the less energy. Thus, crack tip microcutting was performed by concentrating the electron beam at a point of this tearing line (point A, Fig. 6a). As material response, a microcut immediately initiates at this point and propagates towards the right side by revealing the zone located behind the crack tip. The artificial microcrack obtained is shown in Fig. 7a. It is to note that, for the same adjustment of the electron beam as in Ref. 5 for CB-NR, the time needed to initiate microcrack is inferior to 1 s instead of several seconds for CB-NR. Moreover, ligaments observed all over the crack tip fail without any resistance and for the same energy brought by the electron beam. It seems to indicate that the microstructure of ligaments in CB-SBR is the same whatever the deformation state, i.e. ligaments are not crystallised and the material microstructure is homogeneous at the crack tip. Figure 7b is a magnification of the encircled zone in Fig. 7a. Here, new ligaments are generated and the microcrack propagates through ZnO particles. Chemical links between ZnO and rubber matrix being highly weak, this zone looks like a cavity opened and stretched. This phenomenon generates two elliptical zones in which ZnO particles are observed. It is to note that elliptical zones observed on both sides of tearing line in Fig. 7b proves that this phenomenon takes place also naturally (during natural crack propagation). If ZnO particles are not crossed by the crack in their middle, elliptical zones are only observed on one side of the tearing line (Fig. 7b). Finally, the size of revealed cavities being not superior to the one of ZnO particles, our observations do not allow to highlight cavitation from ZnO particles at the fatigue crack tip in CB-SBR. These observations demonstrate that the roughness of fracture surfaces is only due to particles (ZnO, carbon black agglomerates) encountered by the crack during its propagation into a linear zone.
a artificial microcrack obtained after concentrating electron beam on point A in Fig. 6a; b magnified view of encircled zone of a
At this point, it could be interesting to highlight that physical phenomena observed during fatigue crack propagation in CB-SBR, i.e. non-crystallisable rubber, are totally different that the ones observed during fatigue crack propagation in CB-NR, i.e. crystallisable rubber. First, nature and origin of ligaments are not the same in both materials. In CB-SBR, non-crystallised ligaments come from a tearing line, more precisely from the encounter between crack tip and particles, and do not resist crack propagation while in CB-NR, crystallised ligaments are generated from highly stretched zones between elliptical zones and resist crack propagation. The fact that CB-SBR does not resist crack propagation is also deduced from the time needed to initiate microcutting for the same level of energy. It is shorter than in CB-NR. Second, contrary to CB-NR, no cavitation phenomenon is observed in CB-SBR.
Concluding remarks
As a summary, an original technique of in situ microcutting developed during a previous study and the observation of the material microstructure behind the crack tip have led to describe the fatigue crack growth mechanism in CB-SBR.
Our experiments lead to two main results: (1) in the deformed configuration, the crack tip of CB-SBR corresponds to a tearing line and is composed of non-crystallised ligaments; (2) crack grows without encounter any resistance, i.e. no crystallised zones resist propagation, and the morphology of fracture surfaces only depends on heterogeneities revealed by the fatigue crack propagation (generally ZnO particles or carbon black agglomerates).
Finally, the present study, compared to the one carried out on CB-NR, allows completely explaining the different responses in crack propagation between crystallisable and non-crystallisable rubbers.
Footnotes
Acknowledgements
Authors would like to acknowledge Allevard Rejna Autosuspensions for its financial support and the Trelleborg French Laboratory for having performed fatigue tests.