
Abstract
A sequentially coupled structural–mass diffusion model has been proposed to evaluate the behaviour of elastomer O-rings exposed to rapid gas decompression in the presence of CO2. The coupling between mass diffusion and the structural deformation of the O-ring was achieved by employing the Peng–Robinson equation of state and two user-subroutines to evaluate the pressure exerted by the rapidly expanding gas. The finite element analysis (FEA) model has been used to evaluate stress and strain distribution inside the O-ring during rapid gas decompression. It was shown that the nominal stresses go through a stress–state change from compression to tension during the decompression cycle, and the strain rate during the stress–state change is dependent upon the decompression rate. The FEA model revealed that the elements in the centre region of the O-ring's cross-section experience high tensile strains and stresses during each decompression cycle.
diffusivity coefficient (mm2 s
1
) mass concentration of gas (mol mm− 3) solubility coefficient (mol mm− 3 Pa
1
) gas permeability [mol m (m2 s Pa)1] temperature (°C) nominal stress in x direction, y direction or nominal shear stress (MPa) nominal strain in x direction, y direction or nominal shear strain strain energy per unit reference volume (N mm− 2)Nomenclature
Introduction
Rapid gas decompression (RGD), commonly known as explosive decompression, is an operational condition during which applied system pressure is quickly released, resulting in the expansion of absorbed gas damaging elastomer O-rings, 1 . Even though the understanding of failure mechanism in RGD has advanced substantially in the past 20 years 2 , there is still yet a numerical model to be developed to accurately evaluate the stress and strain distribution inside elastomer seals during each decompression cycle.
A numerical model was developed by Ho 3 to model fluid ingress into elastomer seals, and the resulting long term material property changes caused by volume swell and chemical reaction between elastomer and absorbed fluid. The model was used for calculating the required soak time in the rig tests, designed to investigate RGD. However, the model cannot be used to predict the stress and strain distribution inside the O-ring during RGD. A finite element analysis (FEA) model was created by James et al. 4 in a joint programme MODES (Modelling of Decompression in Elastomeric Systems) to research the mechanisms and prediction of RGD damage. The model calculates the stress and strain levels caused by seal compression from the seal housing, thermal expansion and the volumetric expansion upon decompression. The volumetric expansion of the O-ring due to expansion of absorbed gas was taken into account by increasing the temperature of the O-ring in order to produce the required expansion. This method assumes that the expansion of the O-ring due to absorbed fluid is uniform inside the O-ring structure. However, during each decompression cycle, the fluid concentration is non-uniform across the O-ring's cross-section, and therefore, the pressure exerted onto the O-ring by the expanding fluid is also non-uniform.
Omnes et al. 5 developed an FEA model to simulate the behaviour of seals during RGD. The structural deformation of the O-ring due to the expansion of absorbed fluid was taken into account by coupling the mechanical model with the diffusion process, using an expansion coefficient due to diffusion. The method proposed by Omnes et al. is quite complex to evaluate.
A different numerical model is proposed in this research to evaluate the deformation of an O-ring due to the non-uniform pressure exerted by the rapidly expanding gas during RGD. The FEA model evaluates the pressure exerted onto the internal structure of the O-ring by the absorbed gas at various points within the O-ring structure. The O-ring is divided into several finite elements, and the pressure exerted unto each element by absorbed gas in that particular element is evaluated using a user subroutine. This pressure is then applied to the model using another user subroutine.
Numerical model
The numerical model was broken down into three stages:
The structural model was used to evaluate the interaction between the O-ring and the housing gland surface. The mass diffusion model was used to analyse gas diffusing in and out of the O-ring. Coupled structural–mass diffusion model was used to evaluate the structural deformation of the O-ring due to RGD.
Structural model
The deformed O-ring from the structural model analysis was imported and used in the mass diffusion analysis as the input geometry. The geometry of the O-ring housing was designed based on the RGD test rig, which was designed to subject O-rings to RGD conditions according to the Norsok M-710 Rev. 2 6 standards. The temperature for both the O-ring and its housing gland surfaces was raised and kept constant at 100°C. The O-ring was subjected to a 14% compression by the top housing. The structural model was modelled as an axisymmetric model shown in Fig. 1.
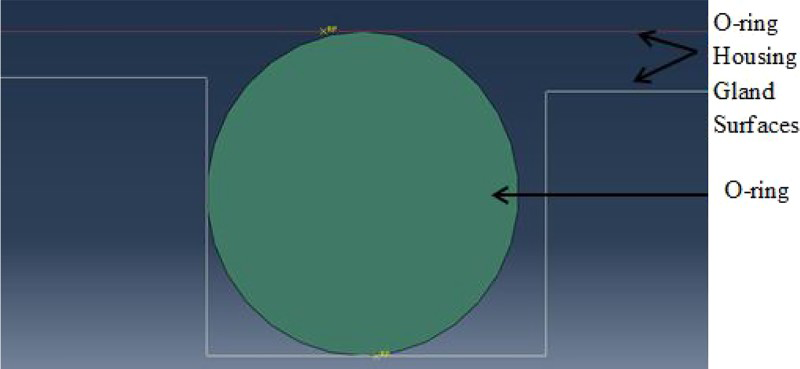
Axisymmetric model of O-ring contained in its housing gland surfaces with appropriate boundary conditions
Hyperelastic model
Unlike metals that exhibit a linear stress–strain behaviour, elastomers stress–strain behaviour is quite complex. This is because their stress–strain behaviour is highly nonlinear, and they need to be analysed as non-linear hyperelastic materials. In FEA, the mechanical response of a hyperelastic material is described in terms of a strain energy potential, U (ε), which describes the strain energy stored in the material per unit volume as a function of strain at that point in the material. In this research, the elastomer O-ring was modelled using the polynomial strain energy potential
7
.
 and
and
 are the first and second deviatoric invariants, and
 is the elastic volume ratio.
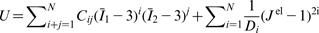
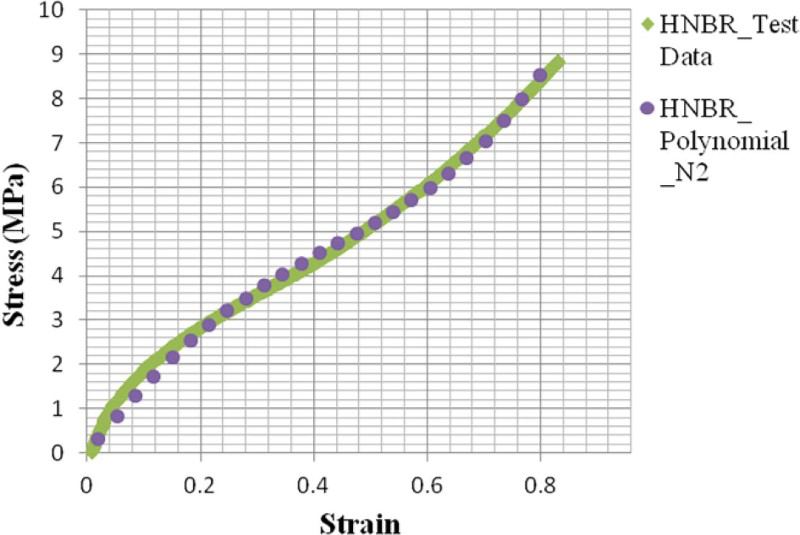
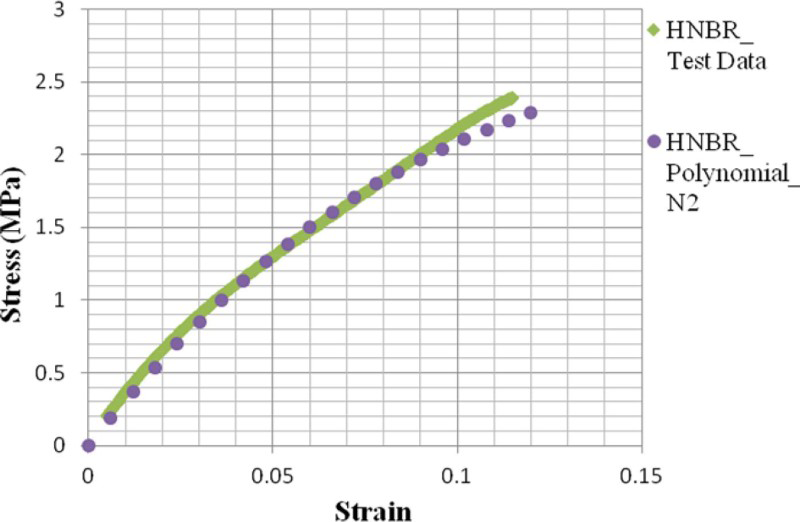
The strain energy potential depends on the test data conducted under different states of stress in order to predict the behaviour of rubber subjected to multiaxial stresses. Figures 2 3 –4 show the stress–strain curves generated from the polynomial material model compared to the experimental data. The experimental data were obtained at 100°C. The material model seems to predict the stress values at various strain levels with acceptable accuracy.
Stress–strain curves generated from polynomial_N2 material model compared to test data measured under uniaxial loading for both HNBR
Stress–strain curves generated from polynomial_N2 material model compared to test data measured under shear loading for both HNBR
Stress–strain curves generated from polynomial_N2 material model compared to test data measured under equibiaxial loading for both HNBR
Mass diffusion model
The diffusing gas is modelled using the governing equations for mass diffusion, which are an extension of Fick's law. These equations allow non-uniform solubility of the diffusing gas in the base material and for mass diffusion driven by gradients of pressure and temperature. The mass diffusion behaviour is taken into account using an extended Fick's law
8
:
The mass diffusion model was designed based on the Norsok M-710 RGD test regime; however, since the damage is known to occur during the decompression stage, the mass diffusion model only focused on the decompression stage. This stage is modelled in two steps:
Gas is allowed to diffuse into the O-ring until full saturation. A transient step then evaluates the diffusion of gas out of the O-ring during the decompression cycle as a function of time.
During the transient step, the external gas is reduced from 8 to 0 MPa at three different rates of 2, 4 and 8 MPa per minute. The mass concentration values in each element during the transient step are written to an external file using the URDFIL user subroutine. The external file is then used for sequentially coupling the mass diffusion model with the structural model.
Material model
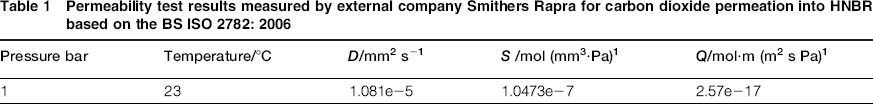
Assuming steady state diffusion, the time lag method by Daynes 9 can be applied to evaluate the diffusion coefficient (D) and the solubility coefficient (S) from the permeation test at different temperature and pressure according to the ISO 10 Standards.
The permeation data presented in Table 1 were measured at 1 bar and room temperature, and these values will be different if they were measured at RGD conditions. Therefore, the time taken for gas to diffuse out of the O-ring during RGD from the numerical model will not be representative of the actual time taken by carbon dioxide to diffuse out of the O-ring. However, the mass diffusion behaviour should be similar, and also since the aim of this paper is to present a new novel numerical technique for analysing coupled structural–mass diffusion problems, the permeation data will suffice. In addition, for simplicity reasons, swelling of the elastomer material due to the presence of CO2 is not included in this analysis. However, the proposed FEA model is amenable to include the swelling of the elastomer material due to the presence of CO2.
Permeability test results measured by external company Smithers Rapra for carbon dioxide permeation into HNBR based on the BS ISO 2782: 2006
Sequentially coupled structural–mass diffusion model
The coupled structural–diffusion model is solved as a sequentially coupled model:
Initially, the O-ring is subjected to a compression force by the O-ring housing gland surfaces. The deformed O-ring is then imported into the mass diffusion model and used as input geometry in the mass diffusion analysis. The results from the mass diffusion analyses are then imported into the structural model and are used to set boundary conditions during the decompression cycle. The structural model is used to analyse the structural deformation of the O-ring due to the rapidly expanding gas.
The coupling between the structural deformation of the O-ring and the mass diffusion is achieved using two user subroutines to evaluate the pressure exerted onto each element surface during the decompression period. During RGD testing, the temperature in the system is kept constant at 100°C; however, as the absorbed gas expands due to external pressure drop, the local temperature is likely to change. For simplicity, the coupled structural–mass diffusion model assumes that the temperature is constant for both gas and structure; hence, there is no temperature difference at the gas/structure interface. In addition, the coupled FEA model assumes no swelling of the elastomer material due to the presence of CO2 under high pressure. However, the coupled FEA model can be modified to include the swelling properties of the elastomer material. Figure 5 shows a summation of the forces acting on an O-ring during the decompression process.
Axisymmetric view of O-ring in service under compression forces from housing gland surfaces and working fluid, and tensile forces from absorbed gas
Geometry and boundary conditions
The coupled structural–mass diffusion model is solved in four steps:
The first step raises the temperature of the system to 100°C. The second step involves compressing the O-ring by its housing gland surfaces. The third step is a gas absorption step, in which gas diffuses into the O-ring until full saturation. In addition, in this step, the external compressive pressure from the working fluid is applied. The fourth step is the decompression step, in which a user subroutine is applied to evaluate and apply the internal pressure exerted unto the internal structure of the O-ring as the absorbed gas diffuses out during the decompression cycle.
In the fourth step, the external pressure exerted by the working fluid is reduced at three different rates of 2, 4 and 8 MPa per minute. Pressure from the expanding gas is applied onto each element's walls, and the pressure is acting normal to the internal walls of each element as shown in Fig. 6. A DLOAD user subroutine imports data from the mass diffusion analysis and uses the data to evaluate the pressure exerted unto the internal surfaces of each element by the absorbed gas.
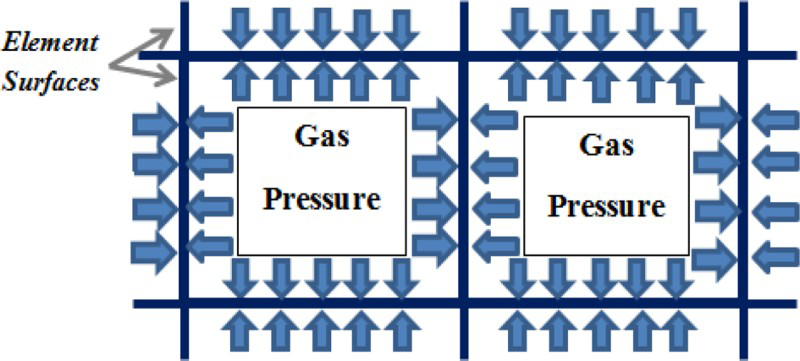
Two elements subjected to pressure from absorbed gas
Peng–Robinson equation of state
The pressure exerted onto the internal structure of the O-ring due to the expanding gas was evaluated using an equation of state. At present, there is no single equation that accurately predicts the properties of all substances under all conditions. Some of the more popular equations of state proposed include Van Der Waals
11
, Benedict–Webb–Rubin
12
, Beattie–Bridgeman
13
and Peng–Robinson
14
equation of state. Among these equations, the Peng–Robinson equation is probably the best compromise between mathematical simplicity and accurate representation of data for the range of temperature and pressure to be investigated. It is typically written as follows:
At critical temperatures:
At temperatures other than the critical:


 is a dimensionless function of reduced temperature and acentric factor and equals 1 at the critical temperature. v is the molar volume and is given in m3 kmol
1
.
is a dimensionless function of reduced temperature and acentric factor and equals 1 at the critical temperature. v is the molar volume and is given in m3 kmol
1
.
The gas concentration (kmol m− 3) is evaluated as the inverse of the molar volume. The pressure exerted onto the internal structure of the O-ring will therefore be non-uniform since the pressure is calculated from the gas concentration inside the O-ring during RGD, and this gas concentration is non-uniform inside the O-ring during the decompression cycle.
Results
Coupled structural–mass diffusion model results
Figures 7 and 8 show the stress distribution inside an O-ring after 1 s during the decompression cycle. At this stage, the forces acting on the O-ring are as follows:
Compression force from the housing gland surfaces Stresses due to thermal expansion Pressure from the external working fluid and Internal pressure from the absorbed gas
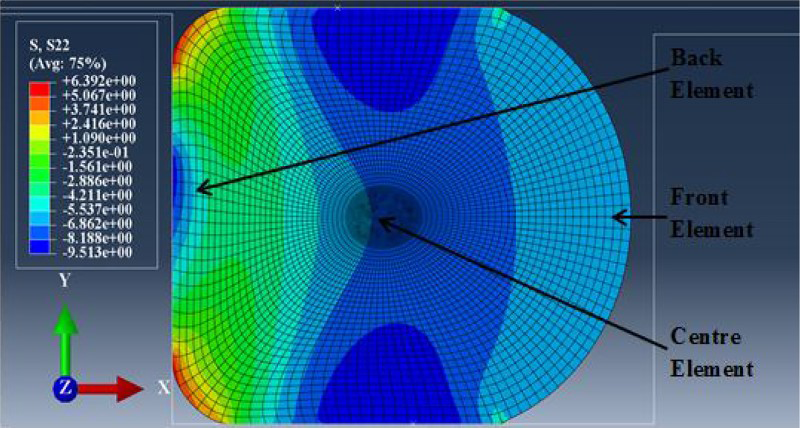
Stress distribution (S22) inside O-ring after 1 s during decompression cycle
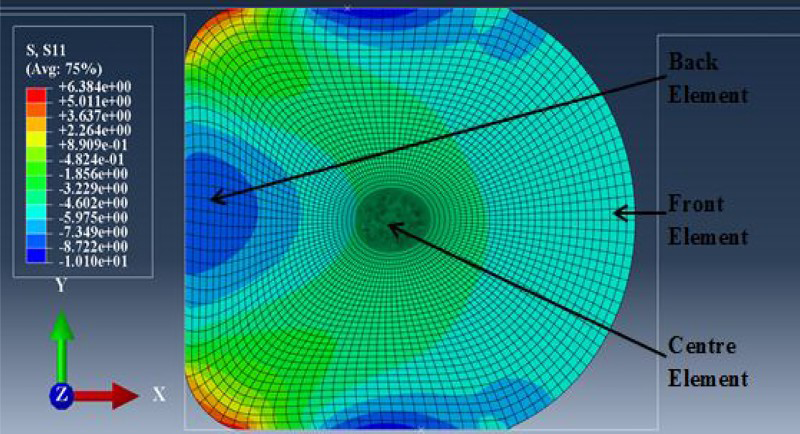
Stress distribution (S11) inside O-ring after 1 s during decompression cycle
Most of the elements in the O-ring are under compression in both x and y directions. However, as the external pressure from the working fluid is reduced, most of the elements experience a stress state change from compression to tension. Figure 9 shows the evolution of stress (S22) with time in three different elements across the O-ring's cross-section as shown in Fig. 7. The stress values are averaged values at the centroid of each element. The plot shows that the stress (S22) changes from compression to tension during the first few minutes of the decompression cycle. This stress state change was also observed for stress in the x direction (S11). The stress state change is a result of the reduction in external pressure exerted by the working fluid.
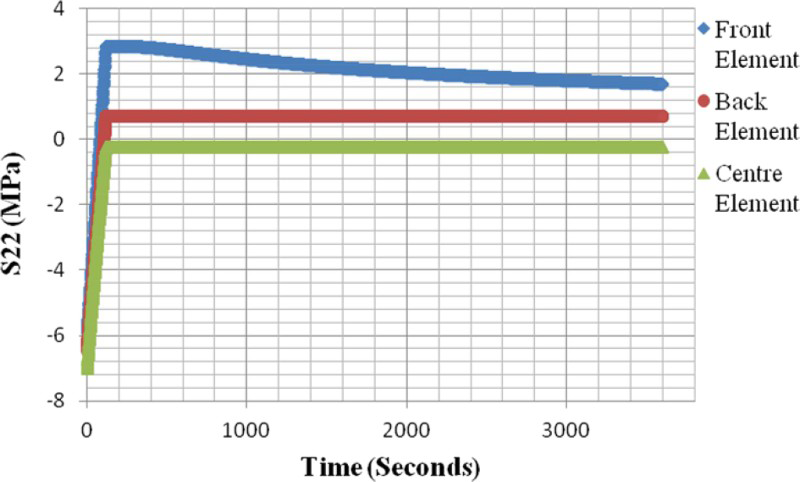
Evolution of stress (S22) with time in three different elements across O-ring cross-section during decompression cycle
Figures 10 and 11 show the stress distribution inside an O-ring after an hour during the decompression cycle. At this stage, the external pressure has dropped to zero; hence, there is no external pressure acting on the O-ring from the working fluid. The only forces acting on the O-ring are as follows:
Compressive stresses from the housing gland surfaces, Thermal stresses and Tensile stresses from the absorbed fluid
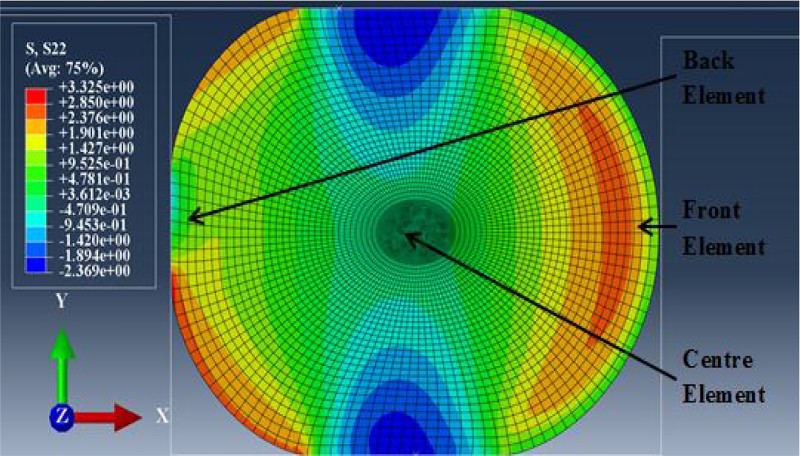
Stress distribution (S22) inside O-ring after an hour during decompression cycle
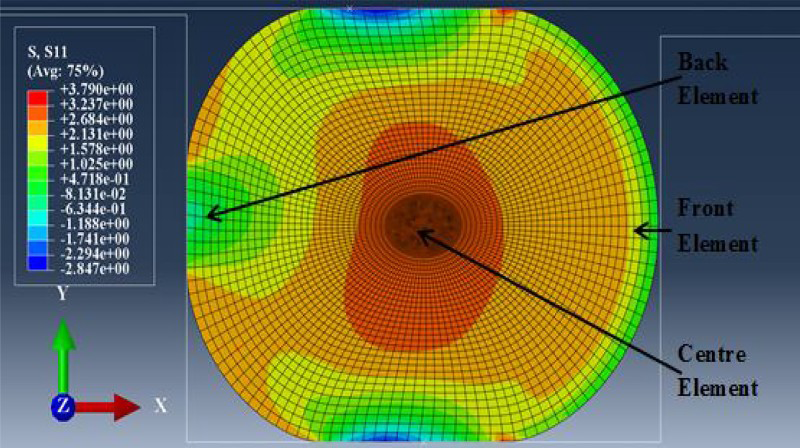
Stress distribution (S11) inside O-ring after an hour during decompression cycle
At this stage, most of the elements in the O-ring are under tensile stress in both x and y directions. ighElements in the centre region of the O-ring experience the highest tensile stresses S11 during RGD. Figure 12 shows the nominal strain (NE11) distribution inside an O-ring after an hour during the decompression cycle. Elements in the centre region experience the highest tensile strains in the x direction and compression strains in the y direction. The combination of high tensile strains (NE11) and tensile stresses (S11) in the centre region is probably the reason cracks tend to initiate and propagate in the centre region of the O-ring and normal to the external pressure direction as observed in RGD experiments and as noted by Rispin 15 .
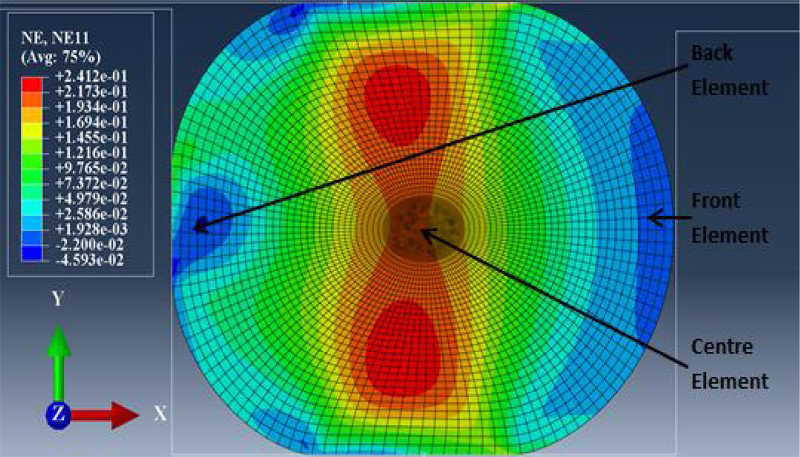
Nominal strain (NE11) distribution inside O-ring after an hour during decompression cycle
Figure 13 shows the evolution of nominal strain with time in a centre element during the decompression cycle at three different decompression rates. It also shows that the higher the decompression rate, the higher the strain rate during the first few minutes during the decompression cycle. This trend was also observed for stress and strain in the y direction (S22 and NE22). This behaviour is why O-rings are more likely to fracture when the external pressure is released at a high rate during RGD.
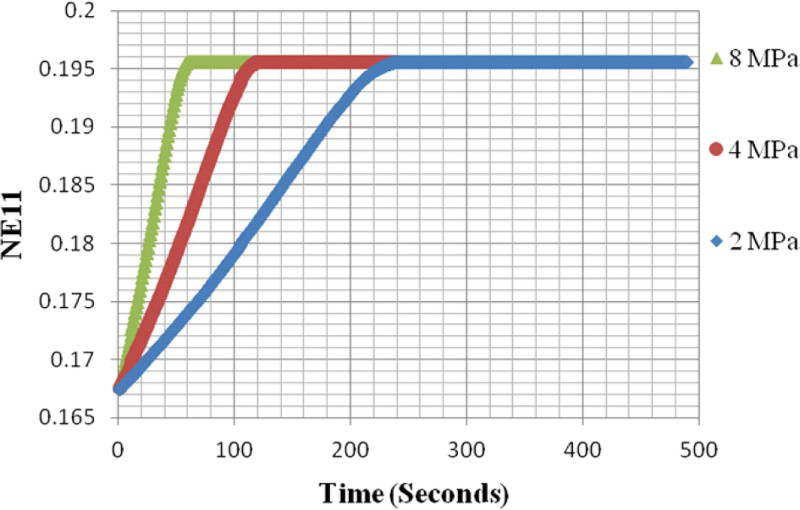
Evolution of nominal strain (NE11) with time in centre element during decompression cycle at three different decompression rates
Conclusions
A sequentially coupled structural–mass diffusion model has been proposed to model the behaviour of elastomer O-rings exposed to RGD in the presence of CO2 in order to evaluate the local mechanical fields and to understand the conditions necessary for damage initiation and propagation. The coupling between mass diffusion and structural deformation of the O-ring was achieved by employing the Peng–Robinson equation of state. The equation of state was used to evaluate the pressure exerted by the expanding gas inside the O-ring. URDFIL and DLOAD user-subroutines were used to sequentially couple the mass diffusion of the absorbed gas and the structural deformation of the O-ring due to the pressure exerted by the absorbed gas.
The model has been used to evaluate the stress and strain distribution inside the O-ring during RGD. The stress and strain distribution was shown to be affected by the external compression stresses from the working fluid, the housing gland surfaces and by the internal stresses from the expanding absorbed fluid. It has been shown that S11 and S22 go through a stress–state change from compression to tension during the decompression cycle. The strain rate during the stress–state change is dependent upon the decompression rate: the higher the decompression rate, the higher the strain rate. This phenomenon is the reason why O-rings fail more often when the external pressure is released at high rates during RGD.
The FEA model revealed that the elements in the centre region across the O-ring's cross-section experience the highest tensile strains and stresses in the x direction. The combination of high tensile strains (NE11) and tensile stresses (S11) is probably the reason cracks tend to initiate and propagate in the centre region and normal to the external pressure as observed in the RGD experiments and as noted by Rispin.