
Abstract
In this study, mechanical and dielectric properties of epoxy nanocomposites with two types of graphene, < 10 layer stacks (GEC10) and < 30 layer stacks (GEC30) were investigated. Results showed that the number of graphene layers remarkably affected the dielectric properties of epoxy nanocomposites. The real and imaginary parts of relative permittivity and loss tangent of GEC10 samples were noticeably enhanced and reached to 1.29, 20 and 15.6 times respectively for 1 wt-% graphene sample compared to GEC30 samples. Meanwhile, tensile tests showed a peak for tensile strength of GEC10 and GEC30 samples with 0.1 wt-% graphene, which improved by 13 and 7.9% with respect to pure epoxy respectively. In addition, flexural properties did not change significantly compared to the pure epoxy.
Keywords
Introduction
Carbon has been a multipurpose material for researchers and technologists. It has several structures such as graphite, diamond, fullerene (C60 and C70), carbon nanotubes and graphene. Among these structures, the newly discovered graphene with two-dimensional honeycomb structure of carbon atoms with sp2 bonds can be used as building block to construct other carbon structures.1, 2 It has excellent and exceptional properties such as thermal conductivity of 5000 W m− 1 K− 1, electrical conductivity of 6000 S cm− 1, tensile strength of 130 GPa and large specific surface area of 2630 m2 g− 1.3–5 Graphene can be produced by two bottom–up and top–down processes. 1 In bottom–up process, graphene is synthesised by various methods such as chemical vapour deposition, electric arc discharge, epitaxial growth, chemical conversion, reduced CO and unzipping carbon nanotubes. Chemical vapour deposition and epitaxial growth methods often produce defect free graphene sheets that are usually used in fundamental studies and electronic applications but are not appropriate for polymer nanocomposites, which usually need large amounts of graphene sheets with functional surface structures.1, 6 The general approach in the top–down process is production of graphene or modified graphene from graphite or graphite derivatives (such as graphite oxide and graphite fluoride) by separation, intercalation and exfoliation techniques respectively. Mechanical exfoliation of graphene from bulk graphite and thermal or chemical reduction of graphene oxide are two common methods. Reduction methods are suitable for large scale production of graphene that are needed for production of polymer nanocomposites.4, 7, 8 Obviously, the number of graphene layers depends on the production methods. For example, graphene that is produced by mechanical exfoliation often consists of stacks of multilayer sheets in platelet morphology similar to graphite order, while reduction of graphite derivatives method produce graphene with one to few no order wrinkle sheets with several defects such as Stone–Wales and single or multiple vacancies. 4
Graphene has attracted tremendous attention as nanofiller since its discovery in 2004 by Gim and colleagues 9 due to its excellent properties, various methods of production, high purity and availability and low cost of raw materials (graphite).4, 10 The main efforts have exercised the effect of graphene to enhance polymer composites since 2008.11–22 Their results usually indicated that the mechanical properties of graphene–polymer nanocomposites such as tensile, impact and bending strength increased to a peak at extremely low content of graphene due to its reinforcement effect, but decreased with the formation of agglomeration zones of graphene.11–13 On the other hand, surfactant or functional agents caused better dispersion and acceptable interface bonding of graphene with matrix, which shifted peak to greater graphene content and enhanced mechanical properties.14–17 However, thermal, electrical and dielectric characteristics of polymers continuously had been improved with graphene content.18–22 Although these results were influenced by specific surface area of graphene that was dictated by number layers of graphene, little information had been reported about the influence of this parameter on the properties of nanocomposites. In this research, the influence of number of layers of graphene on the mechanical and dielectric properties of graphene–epoxy nanocomposites (GECs) was investigated. To do so, graphene nanoplatelets with < 30 layers (GNP30) were prepared and graphene nanosheets with < 10 layers (GNS10) were synthesised by thermal reduction method. 23 Afterwards, GNP30 epoxy nanocomposite samples (GEC30) and GNS10 epoxy nanocomposite samples (GEC10) were fabricated with the maximum 1 wt-% graphene content. Subsequently, tensile, bending, dielectric characteristic in X band (8–12 GHz) and the fracture surface of these nanocomposite samples were investigated.
Exprimental
Materials
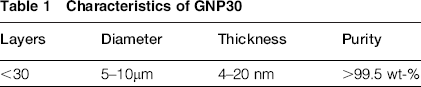
GNP30 with characteristics listed in Table 1 is used in this research. Graphite powder (art. no. 1.04206.2500), acetone and other materials for synthesis of GNS10 were purchased from Merck Co., Germany. Epoxy resin (M506) based on the bisphenol-A and the hardener (HA11) polyamine were provided by Mavad Mokarrar Co., Iran.
Characteristics of GNP30
Graphene nanocomposite sample production
Graphene was dispersed in acetone using a probe sonicator agitated at 100 W for 2 h. Then epoxy resin was added to the solution and sonicated for 90 min. Then, acetone was removed in vacuum chamber at 60°C for 18 h. Subsequently, hardener was added and mixed by a magnetic stirrer. Finally, the mixture was degassed in vacuum chamber and injected into the tensile, bending and waveguide sample moulds. Curing was completed after 7 days at room temperature. Pure epoxy samples were also produced as reference sample for comparison with the nanocomposites.
Characterisation
Raman spectrums of samples were obtained by Senterra, 2009 (Bruker, Germany) with a 785 nm Ar laser between 200 and 3500 cm− 1. Fourier transform infrared (FTIR) spectra of nanocomposite samples were prepared by a Tensor 27 FTIR (Bruker, Germany) between 500 and 4000 cm− 1. The morphology of graphene and fracture surface of the epoxy and nanocomposite samples were examined by a field emission scanning electron microscope (FESEM, Hitachi S4160, Japan). Graphene samples were dispersed in acetone and dropped onto a glass lam and coated with gold for FESEM image. A mechanical testing machine [Hegwald Peschke (HP) inspect 50, Germany] was used to evaluate tensile and bending properties of the nanocomposite samples. Tension test was carried out by a 100 kN load cell with a crosshead speed of 1 mm min− 1 based on ASTM D638-03 standard. Three-point flexural test was performed on samples 10 mm wide, 100 mm long and 4 mm thick with a support span of 60 mm at constant crosshead speed of 1 mm min− 1 according to ASTM D790 standard. A vector network analyser (ZVM, Rohde & Schwarz, Germany) was employed to determine the complex relative permittivity. For this, waveguide with inner dimensions 22.86 × 10.16 mm (8–12 GHz, X band) was used.
Results and discussion
Characterisation of graphene samples
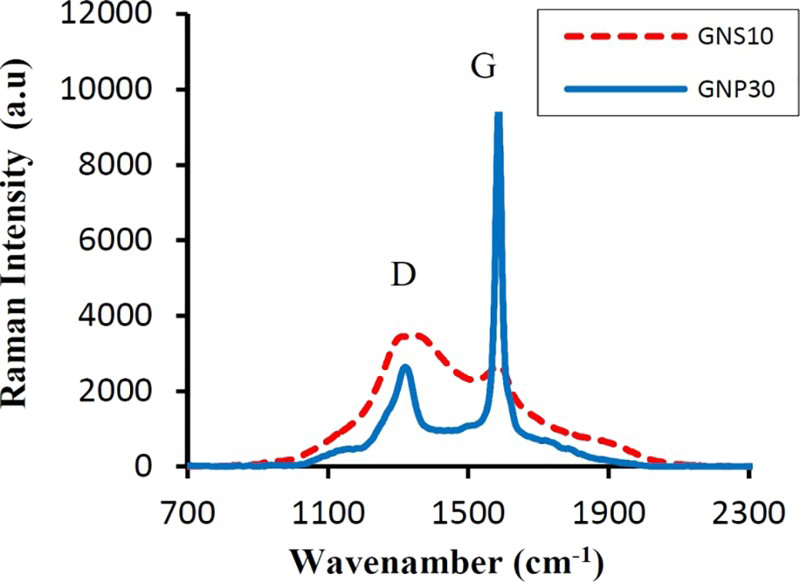
Raman spectra of the GNS10 and GNP30 are illustrated in Fig. 1. Both of graphene samples showed D and G bands respectively at 1340 and 1585 cm− 1. D band is attributed to the disordered carbon materials, and its intensity is dependent on the presence of sixfold aromatic rings. The G band is indicated by the bond stretching of sp2 carbon pairs in the graphite plane.11, 21 The relative intensity of ID/IG is usually relevant to the relative disorder present in graphitic structures. 24 Therefore, the sharper and further intensity of G band compared to D band in GNP30 is related to the normal stretch of sp2 carbon pairs bond and relatively ordered sheet with less damage or defect in sixfold aromatic rings. Meanwhile, the broadening and intensity of these bands in GNS10 are related to the existence of defects in sixfold aromatic rings with stretching of sp2 carbon pairs bond in sheets. The ID/IG = 1.3 for GNS10 compared to ID/IG = 0.28 for GNP30 indicated the high relative disorder of GNS10 structure.
Raman spectra of GNS10 and GNP30 samples
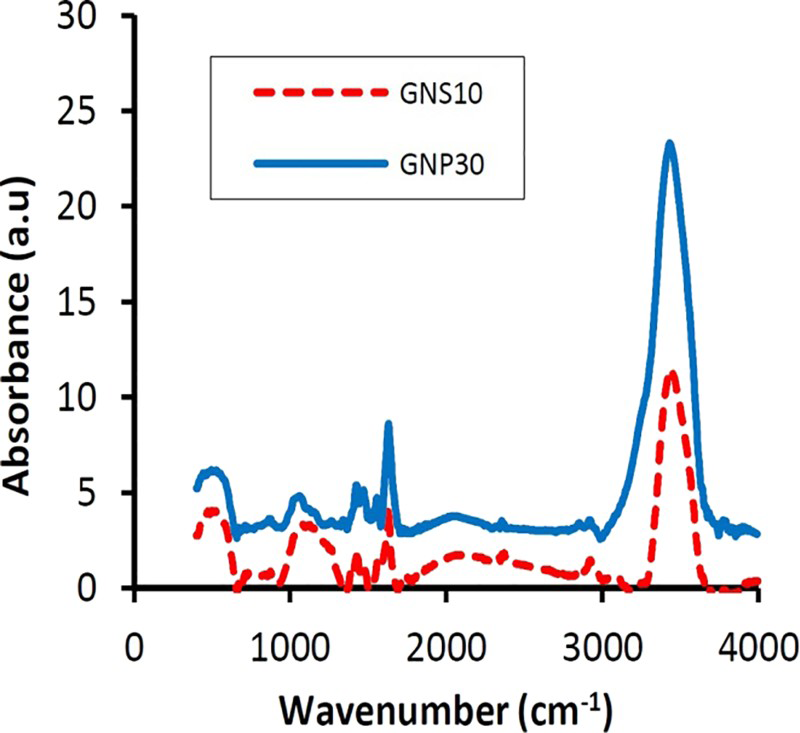
Figure 2 shows the FTIR spectra of nanocomposite samples. According to this figure, peaks at 1050, 1440, 1625 and 3430 cm− 1 respectively confirmed the existence of the C–O stretching vibrations of the epoxide groups, the C–OH stretching vibrations of carboxyl groups, C = O stretching vibrations from carbonyl groups and O–H stretching vibrations of hydroxyl groups in the GNS10 and GNP30 structures. Images (FESEM) of GNS10 and GNP30 are shown in Fig. 3. Wrinkle sheets and plate's thickness of approximately < 5 nm and width of 1–4 μm can be seen in Fig. 3a, which indicates < 10 layers stacks for GNS10. Figure 3b shows the morphology of GNP30 that includes plates with < 20 nm thickness that can be attributed to < 30 layers stacks.
Fourier transform infrared spectrum of GNS10 and GNP30 samples
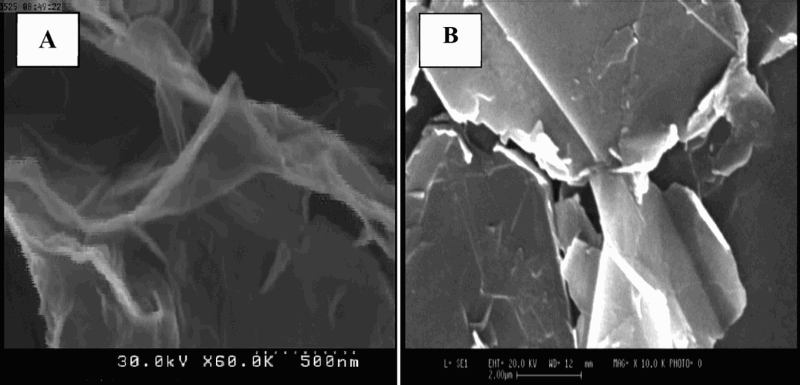
a Images (FESEM) of synthesised GNS10 and b SEM images of GNP30
Tensile characteristics
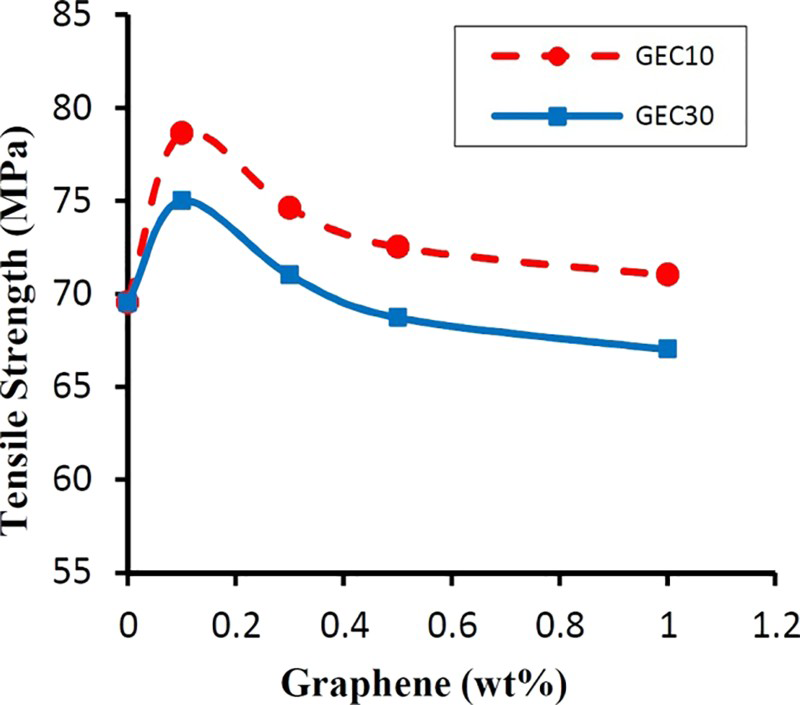
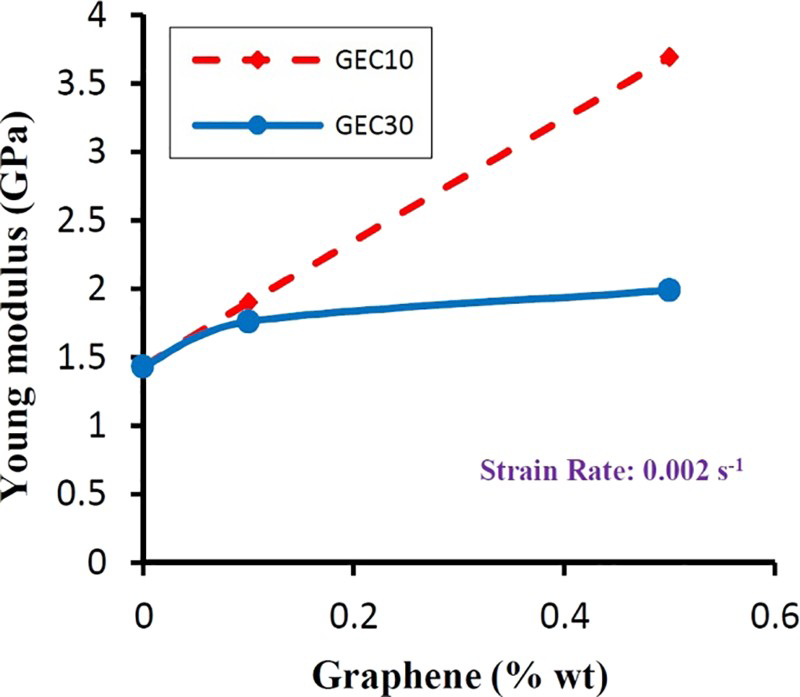
The tensile strength of nanocomposite samples with graphene content is illustrated in Fig. 4. GEC10 and GEC30 samples represented the same behaviour such that the tensile strength respectively improved by 13 and 7.9% at 0.1 wt-% graphene content. Increase in tensile strength at low graphene content and its decrease with graphene content are respectively due to the reinforcement effect and initiation and propagation of cracks in the agglomeration zones of graphene.11, 14 As Fig. 5 shows, elastic modulus of GEC10 noticeably increased with graphene content to 85 and 158% at 0.5 wt-% graphene respectively compared to GEC30 and pure epoxy.
Tensile strength of GEC10 and GEC30 samples
Young's modulus of GEC10 and GEC30 samples
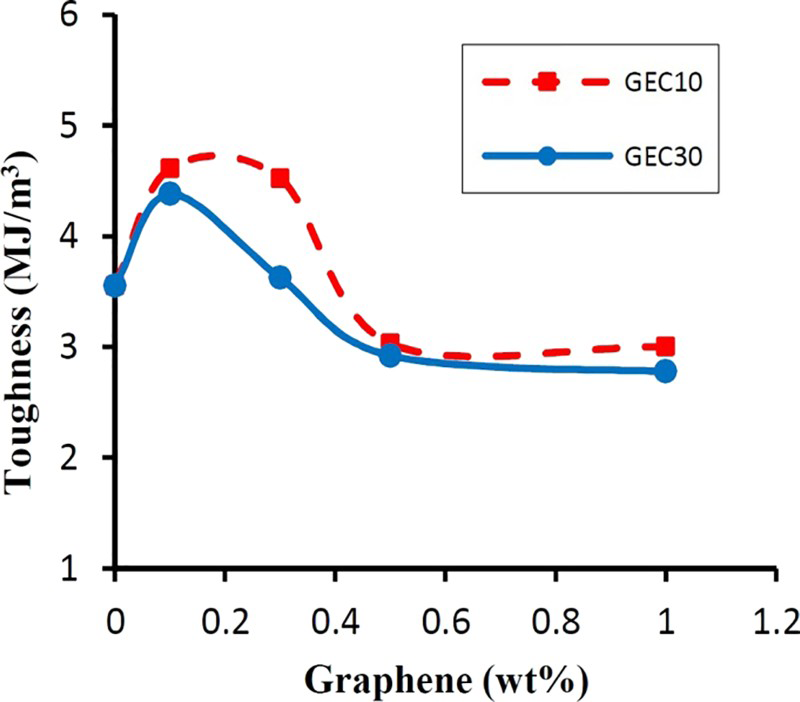
The better enhancement of GEC10 samples can be attributed to the highly effective and wrinkle surface of GNS10 and also high strength of interface bonding in these samples (Fig. 6). Toughness of GEC10 and GEC30 samples are illustrated in Fig. 7. GEC10 showed higher toughness than that of GEC30 up to 0.5 wt-% graphene. Equal value of toughness in the 0.5–1 wt-% graphene range confirmed that the toughness did not depend on the number of layers when numerous agglomeration zones existed.
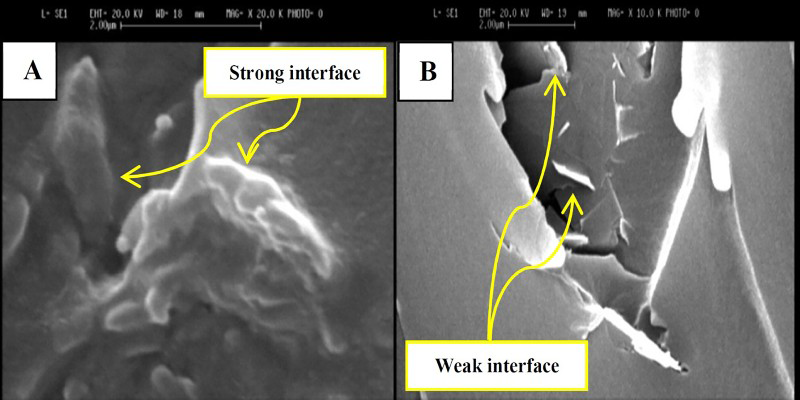
a GEC10; b GEC30
Toughness GEC10 and GEC30 samples
Flexural characteristics
Flexural test results are shown in Fig. 8. Similar to tensile behaviour, flexural strength of GEC10 was enhanced to 3.3% for 0.1 wt-% graphene sample compared to pure epoxy. Meanwhile, flexural strength of GEC30 decreased with graphene content. The variation of flexural modulus with graphene content is demonstrated in Fig. 9. Flexural modulus of GEC10 and GEC30 samples are a little higher and a little lower than the pure epoxy respectively. Weaker result of GEC30 samples is attributed to their larger size and weaker interface strength than GEC10 samples. Comparison of the tensile properties with the flexural properties indicates the role of graphene morphologies on these properties and the fact that they serve better under tensile loading than bending due to better tensile properties than the flexural properties of graphene.
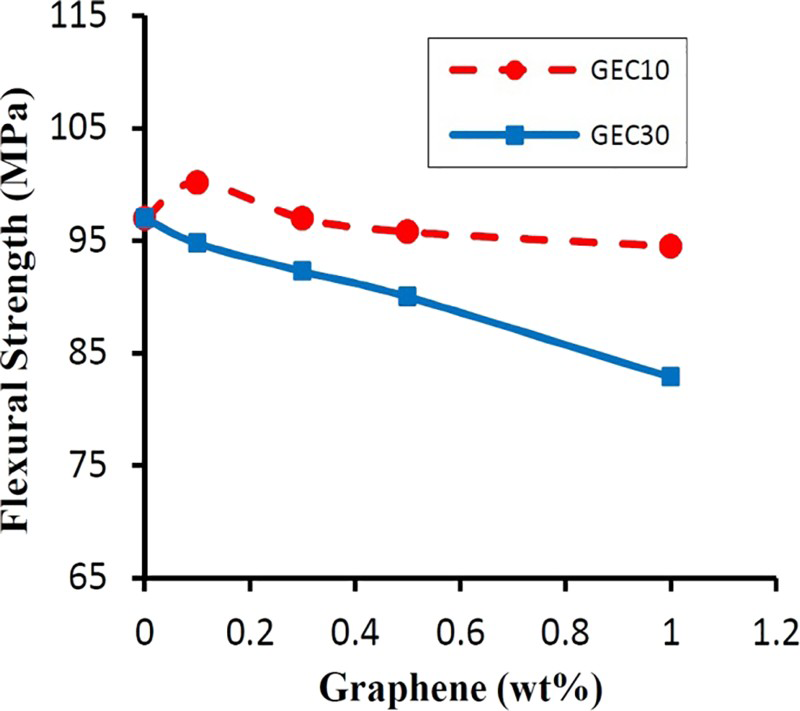
Flexural strength of GEC10 and GEC30 samples
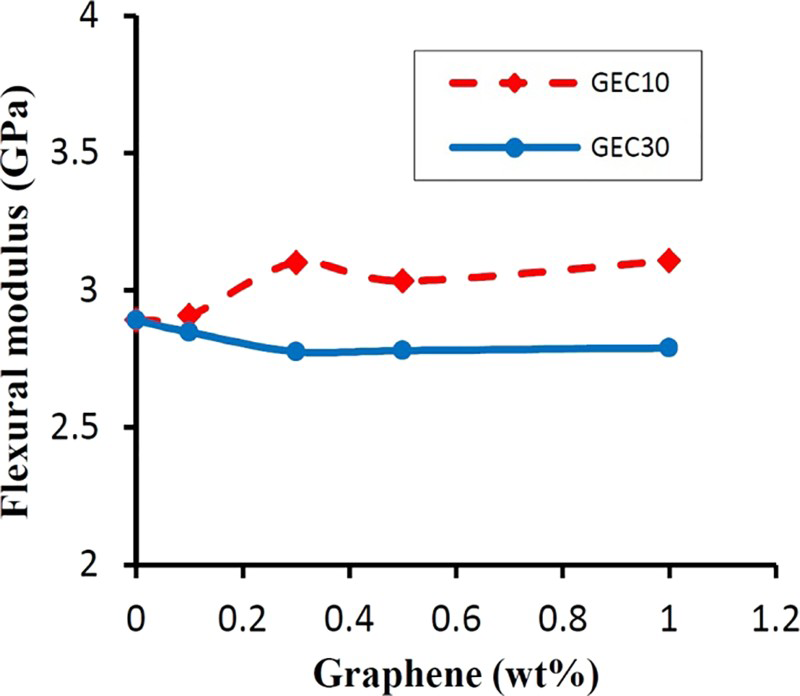
Flexural modulus of GEC10 and GEC30 samples
Fourier transform infrared spectroscopy results
The FTIR spectra of GEC10 and GEC30 and pure epoxy samples are shown in Fig. 10. The broad band ∼3300 cm− 1 and peaks at 2925 and 2855 cm− 1 are related to the hydroxyl groups (O–H), CH2 and CH3 bands respectively. Peaks at 1726 and 1226 cm− 1 and 1103 cm− 1 also confirmed the presence of carbonyl (C = O) and carboxyl (C–OH) and epoxide (C–O) groups respectively.
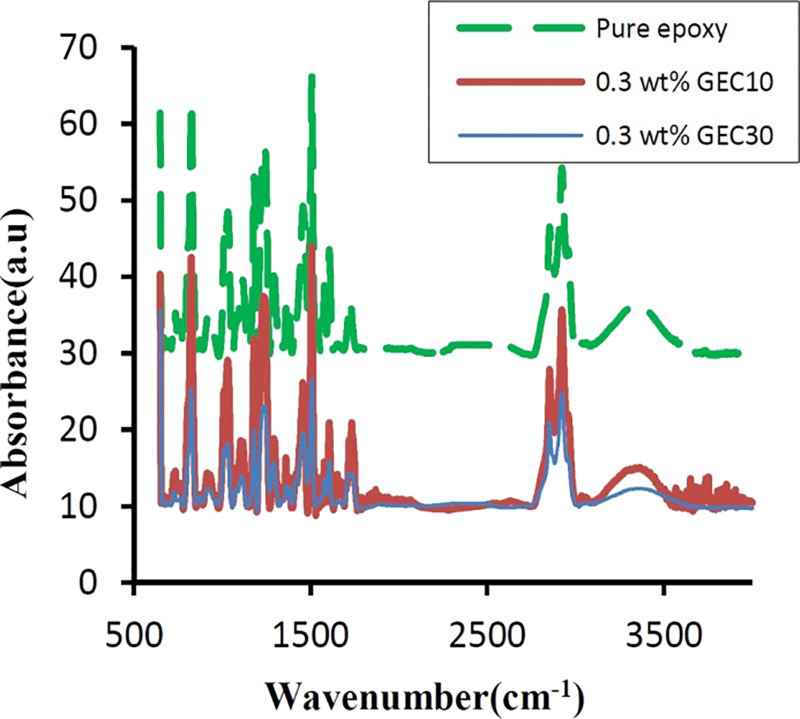
Fourier transform infrared spectroscopy for GEC10 and GEC30 and pure epoxy samples
Raman spectroscopy results
Figure 11 illustrates Raman spectroscopy results of GEC10 and GEC30 samples. Both of them represented similar behaviour. The D band remained constant at 1300 and 1295 cm− 1 for GEC10 and GEC30 samples respectively, and their intensity increased with graphene content. Furthermore, for both GEC10 and GEC30 nanocomposite samples, G band position was moved to the left with increasing graphene content. These results indicated that graphene agglomeration was increased with the graphene contents. 24 The higher intensity of GEC30 spectra specified major plate stocks in its structure.
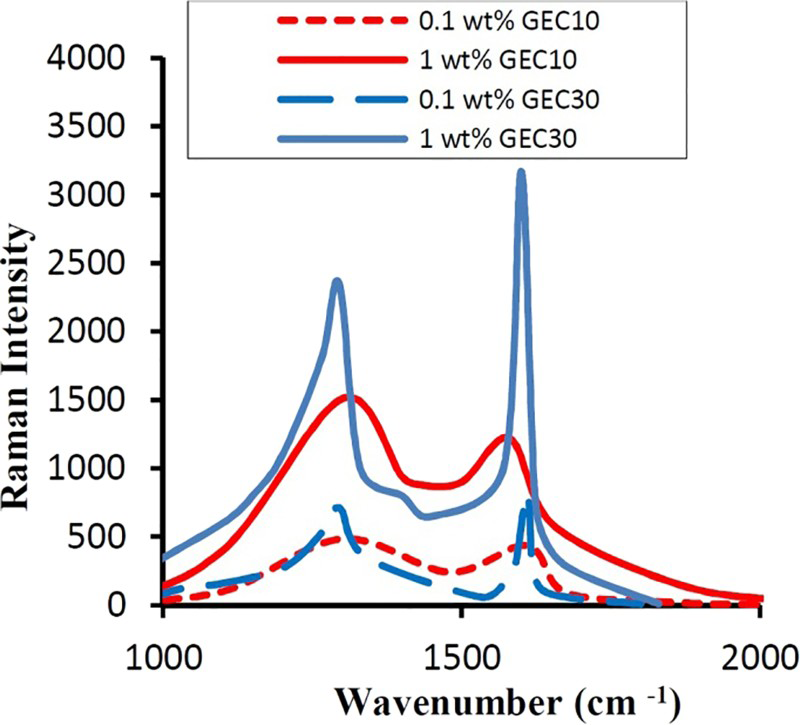
Raman spectroscopy for GEC10 and GEC30 samples
Fracture surface
By adding graphene in pure epoxy, the mirror fracture surface converted to rough surface that is finer for GEC10 samples (Fig. 12). This is due to the wrinkle and high effective surface of GNS10. As the graphene content increased, the graphene agglomeration appeared in the fracture surface of samples as shown in Fig. 13.
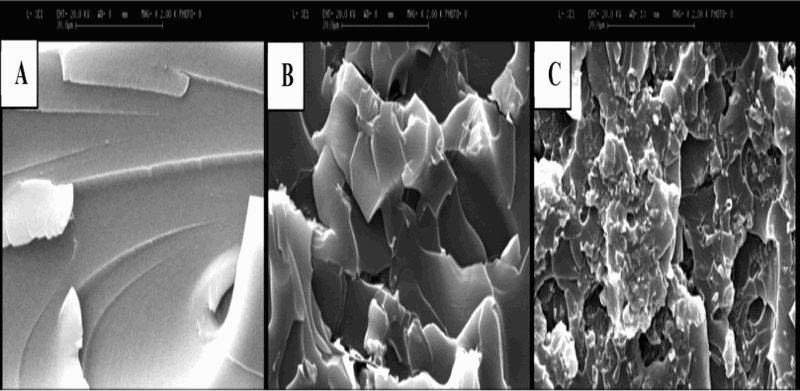
a pure epoxy; b 0.5 wt-% graphene GEC30; c 0.5 wt-% graphene GEC10
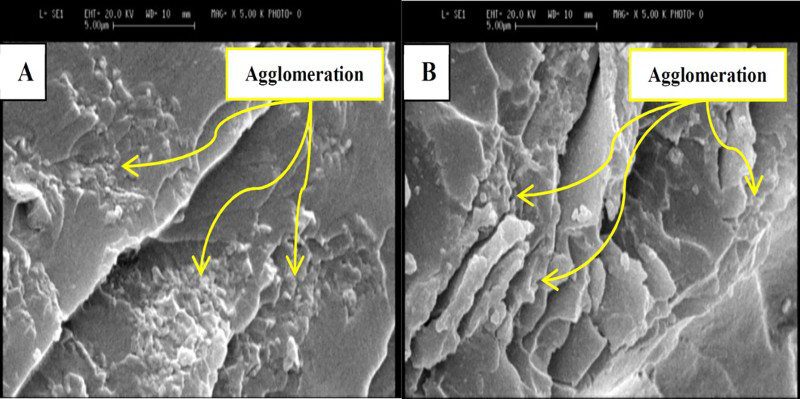
a GEC10; b GEC30
Dielectric properties
The complex relative permittivity (
 ) of GEC10 and GEC30 samples were determined by extraction of the scattering parameters from VNA instrument and using Nicholson–Ross–Weir conversion technique.20, 25 The complex relative permittivity stayed approximately constant in the range of calculation (8–12 GHz, X band). Thus, its average value was used for comparison of GEC10 and GEC30 samples as illustrated in Fig. 14. The GEC30 samples did not indicate considerable improvement. Meanwhile, real and imaginary parts of complex relative permittivity of 1 wt-% graphene content of GEC10 sample enhanced 1.76 and 34 times with respect to pure epoxy and 1.29 and 20 times compared to the sample with the same composition of GEC30. The loss tangent of the samples is illustrated in Fig. 15, which was determined from
 relation. The loss tangent of 1 wt-% GEC10 sample increased to 19 and 15.6 times compared to pure epoxy and GEC30 respectively. The significantly better dielectric result of GEC10 samples was due to wrinkle sheets with high inter connection and high effective surface of GNS10 compared to GNP30.
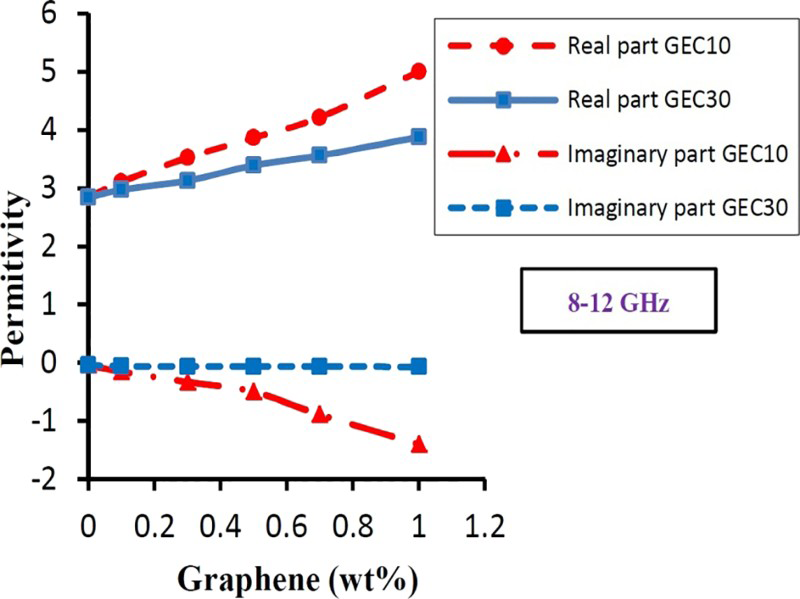
Relative permittivity (real and imaginary parts) of GEC10 and GEC30 samples
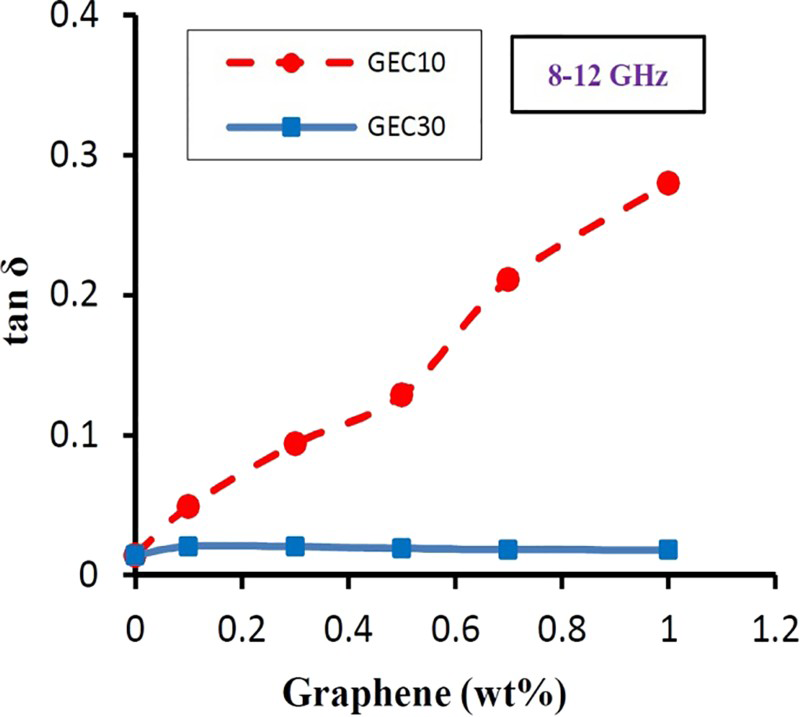
Loss tangent of GEC10 and GEC30 samples
The general test results are illustrated in Table 2. GEC10 samples represented better results in dielectric properties compared to GEC30 and pure epoxy samples. By loading graphene in epoxy matrix, the flexural properties of the composites did not considerably changed due to inherently flexural properties of graphene, but these properties decreased in the GEC30 samples due to flatter, thicker and larger plates of GNP30.
Summary of results
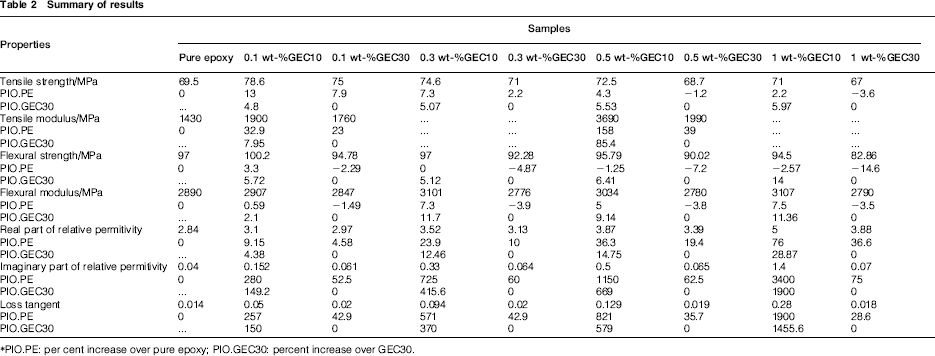
PIO.PE: per cent increase over pure epoxy; PIO.GEC30: percent increase over GEC30.
Conclusions
In this study, the influence of the number of graphene layer on properties of epoxy nanocomposites was considered. GEC10 and GEC30 samples demonstrated similar tensile behaviour. The tensile strength reached a peak at 0.1 wt-% graphene and then decreased with graphene contents due to the initiation and propagation of cracks in agglomeration zones. GEC10 samples showed better results, as its tensile strength enhanced to 13 and 4.8% at peak compared to pure epoxy and GEC30 samples respectively. In addition, GEC10 samples represented higher Young's modulus that reached to 158 and 85.4% for 0.5 wt-% graphene sample compared to pure epoxy and GEC30 samples respectively. On the other hand, the approximate constant toughness of GEC10 and GEC30 samples with more than 0.5% graphene confirmed the independence of toughness on graphene number layers due to high agglomeration. Graphene did not change flexural properties compared to pure epoxy, though its intrinsic flexural properties are adequate for many applications. Graphene transformed the mirror fracture surface of pure epoxy to rough surface that is rougher in GEC10 samples. The significant effect of graphene number layers was seen in the improvement of dielectric properties of pure epoxy. GEC10 sample with 1 wt-% graphene increased real and imaginary parts of relative permittivity and loss tangent to 176, 3400 and 1900% compared to pure epoxy and 129, 2000 and 1560% compared to GEC30 nanocomposites.