
Abstract
A study was conducted to investigate the bending moment coefficient in unbalanced boron/epoxy–aluminium single lap joints subjected to tensile loading. It is well known that the main feature of the single lap joint is the eccentric loading path, which results in large deflections of the outer adherend and the overlap. In addition, the joint edge moment or bending moment coefficient at the end of the overlap is a significant feature. Four different overlap lengths (13, 20, 30 and 40 mm) have been analysed. A geometrically non-linear, two-dimensional finite element analysis was also performed to provide useful comparisons with the theoretical analysis. The analytical results mainly proved that, as the overlap length increases, the bending moment coefficient mainly decreased at the stiffer adherend, while the maximum l/c ratio is also decreased. The latter conclusions show that unbalanced (asymmetrical) single lap joints should be designed and manufactured with extreme care.
Keywords
Introduction
The adhesively bonded single lap joint (SLJ) has been extensively studied, with most of the analytical and theoretical work being focused on predicting the state of stress within the thin adhesive layer. The SLJ is one of the most commonly used bonding configurations. The use of adhesive bonded joints in load bearing structures is of great interest to the aerospace, automotive industry and machine tools modules development. 1 Adhesively bonded lap joints are most preferred, because they develop smooth load transfer and have fewer points of stress concentration when compared to mechanically fastened joints.2, 3 Presenting a smooth exterior, spreading of the load and ease of joining thin or dissimilar materials are all reasons why the use of adhesives for bonding structures is steadily growing and finding new applications. The stress and strain concentrations are of particular interest at the overlap edges owing to the gradual load transfer. These are enhanced because of the joint rotation, especially in the presence of asymmetric loads. 4 Many researchers such as Volkersen, 5 Goland and Reissner, 6 Oplinger,7, 8 Hart-Smith 9 and Li 10 performed analysis of SLJs. The first theoretical model for analysing a balanced SLJ was the one-dimensional (1D) bar model (shear lag model) proposed by Volkersen. Goland and Reissner performed an investigation on the cylindrical bending plate of a SLJ, while Oplinger developed a beam method by considering the overlap bending moments and introducing the individual tensile forces in the upper and lower adherends at the overlap edges. Furthermore, Hart-Smith developed a layered beam model to solve the SLJ.
The classic theory of Goland and Reissner neglects the shear deformation of the adherends. To date, closed form solutions of balanced (symmetrical) SLJs for predicting bending moments and shear forces at the overlap edges, as well as the adhesive shear and peel stresses in the adhesive layer, have not been well established yet. Furthermore, several researchers have proposed 2D analytical solutions, which were focused on the joint overlap, to ensure that the stress free boundary conditions would be satisfied at the free end.11, 12 Moreover, review papers present cases of analytical modelling in the existing literature,13, 14 while Luo and Tong 15 presented fully coupled non-linear governing equations for single lap adhesive joints. Meanwhile, other researchers 16 proposed the non-linear equations of equilibrium of bonding region employing geometrically non-linear analysis. They suggested closed form solutions, as the non-linear equations were rewritten in terms of adherend displacement components (large deflection), adhesive peel and shear stresses. 16
Finite element analysis (FEA) has been employed by Wooley and Carver 17 who conducted geometrically linear modelling and performed extensive parametric studies. They used plane stress elements and modelled the adhesive layer with two rows of elements, thus obtaining the stress variation across the adhesive thickness. Linear analysis was also performed by Guess et al. 18 They used a more refined mesh, which allowed them to identify significant stress gradients across the adhesive thickness. Harrison and Harrison 19 presented a simplified analysis in which they considered rigid adherends and studied the adhesive deformations. Tsai and Morton 20 analysed the SLJ using 2D plane strain conditions and a geometric non-linear finite element model. The large deformations generated during the joint loading introduced non-linearity. New bonding techniques, as shown by da Silva and Adams,21, 22 effectively reduced the peak peel stress. To maximise the joint efficiency, an adequate understanding of the variation in adhesive stresses is essential. Du and Shun 23 presented an analytical solution based on 2D elasticity theory in conjunction with the variational principal of complementary energy. Many publications are nowadays available related to the influence of material and geometric changes in bonded joints that enable reduced stresses and consequently increase their strength.24–26 On the other hand, adhesive fillets (spew fillets) can reduce the stress concentration at the end of the overlap edges.3, 27–29 Ascione 30 studied numerically symmetric SLJs subjected to shear/bending moment and axial loading, and Rao et al. 31 achieved the static analysis of adhesively bonded FRP composite laminate SLJs using the finite element method based on the 3D theory of elasticity. Wu and Jenson 32 presented a stress function variational method to determine the interlaminar stresses in SLJs subjected to mechanical and thermal loadings. They introduced two interlaminar stress functions for peel and shear stresses and minimised the complementary strain energy to obtain two coupled ordinary differential equations of stress functions, which were explicitly solved to predict the stress field. Generally, the finite element method is commonly used for studying SLJs and validating analytical models. Experimentally, Li and Sullivan 33 determined the deformation (local and global) of the adherends and adhesive. An investigation on stress distribution was also been performed using optical methods.34, 35
The theoretical study of unbalanced SLJs only started in the 1970s because of the theoretical difficulty it presented. Two methods have been applied in order to analyse unbalanced (asymmetrical) SLJs. The method comprised dimensional beam theory, which is used to determine the loading conditions at the overlap ends, followed by an equilibrium analysis of the overlap section. However, in this method, only the peel and shear adhesive stresses can be calculated. This approach was used by Hart-Smith, Williams, 36 Delale et al., 37 Yang and Pang, 38 and others. The second approach is to apply a 2D elasticity method. The procedure also uses the 1D beam theory to determine the loading conditions at the overlap ends but then utilises the 2D elasticity theory in the overlap section to obtain the peel, shear and the longitudinal adhesive stresses, as in the work of Cheng et al. 39 Shahin and Taheri 40 presented the bending moments and the shear forces at the two ends of the overlap, which affect the peak stresses in adhesive. Analytical treatments of unbalanced joints always end with the numerical solution of the stress functions.41, 42 Sawa et al.43, 44 analysed an unbalanced SLJ subjected to tensile loading and bending moments, while Wu et al. 45 modified the classical equation for solving the unbalanced SLJ.
The purpose of this work was to investigate the bending moment coefficient in boron/epoxy–aluminium 2024 T3 SLJs subjected to tensile loading. Both materials have been used in aircraft structures. The specimens were manufactured by the Hellenic Airspace Industry S.A., while the joints were tested at the University of Patras. Corroborating the analytical modelling, 2D FEA has been employed to determine the bending moment coefficient in two different points across the adherend surfaces of the SLJs for four different overlap lengths. The results obtained from the non-linear FEA are discussed in detail and compared to the closed form solution.
Experimental
Joint configuration
The testing configuration was based on the ASTM standards D 1002-01 for metal to metal SLJs and D 5868-01, which completes the D 1002 standard and extends the application to composite to composite SLJs. Test specimen configuration is shown in Fig. 1.
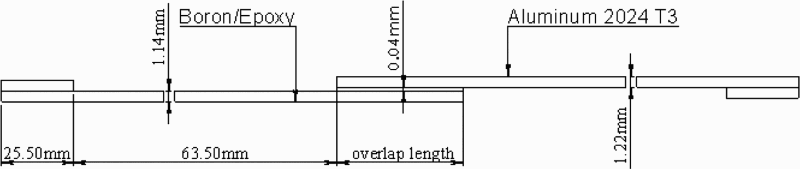
Typical test specimen configuration based on ASTM standard D1002
Generally, in adhesive bonding, the aim is to transfer the load smoothly from one adherend to the other, minimising the peak shear stresses and peel stresses in the adhesive layer. As a rule of thumb, increasing the overlap length reduces the average peel and shear stresses and also the average shear stresses in the middle of the overlap region. Beyond some overlap length value, the peak shear stress no longer changes as one increases the overlap length. The central portion of the joint has zero shear and peel stress. For instance, increasing to 50 or 100 or 200 mm overlap does not affect the peak shear stress (per shear lag model). In this context, in order to investigate the influence of overlap length in the two interfaces, four different overlap lengths were used: 13, 20, 30 and 40 mm. The free length was kept constant at 63.5 mm for all the joint configurations, while the specimen width was maintained at 20 mm. An important parameter affecting the strength of joints is the bond line thickness, which was also kept constant (0.04 mm, after polymerisation), as it was in the form of a thin film. Adhesive polymerisation was achieved in the autoclave chamber (shims or carrier was not used). The bondline thickness obtained was extremely thin and cannot be used in aerospace industry because the conventional thickness is 0.12–0.25 mm.
Materials and testing
Two different materials have been used to model the adherends. The first adherend material was boron/epoxy, which was in a prepreg form; eight layers of 0o resulted in a layer thickness of 1.14 mm. Boron/epoxy was supplied on unidirectional rolls in the form of prepreg and stored at 0°C until use. The composite material was thawed, unrolled and cut into the desired sizes. Further, the composite was cured in an autoclave at 7 bars and 180°C for 6 h under pressure and vacuum to produce hardened composite plates. The second adherend material was aluminium 2024 T3 at a thickness of 1.22 mm. Before the adhesive polymerisation, a specific treatment (erosion) was performed on the inner aluminium surface. During shot blasting, the impact angle would remain constant at 30°, while the speed of the erodent particles was kept constant at 70 m s− 1. Aluminium surfaces obtained a final roughness of 2 μm. The velocity of the erosive particle has a very strong effect on the wear process.46–48 When the velocity increases, the erodent material may deform plastically upon particle impact. After erosion impact, aluminium surfaces were coated by a silane containing Si–O–C n H2n+ groups, which, after hydrolysis produced silanol groups –Si–OH, interacts with the metallic substrate to form a complex interface region, containing –Si–O–M bonds (M = metal). For the assembly, FM94, a high strength adhesive produced by Cytec, was used for bonding in the form of a film. After polymerisation in the autoclave chamber at 3.55 bars and 120°C for 90 min, the adhesive thickness was 0.04 mm.
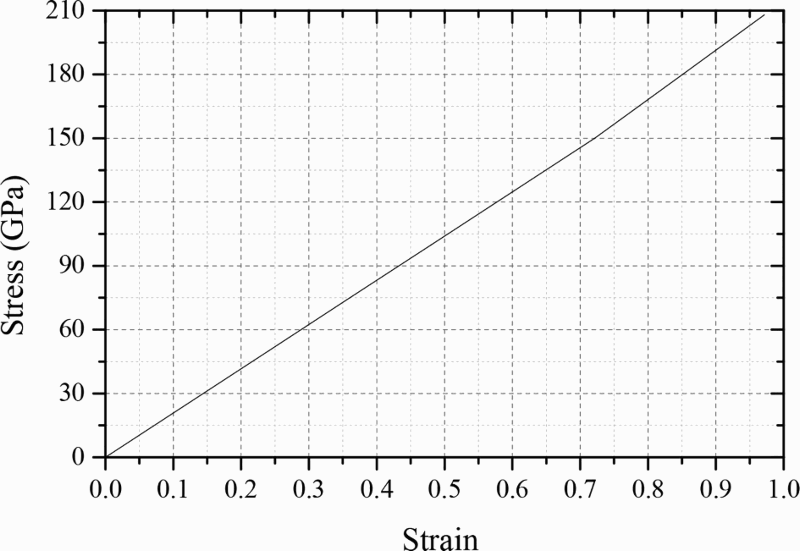
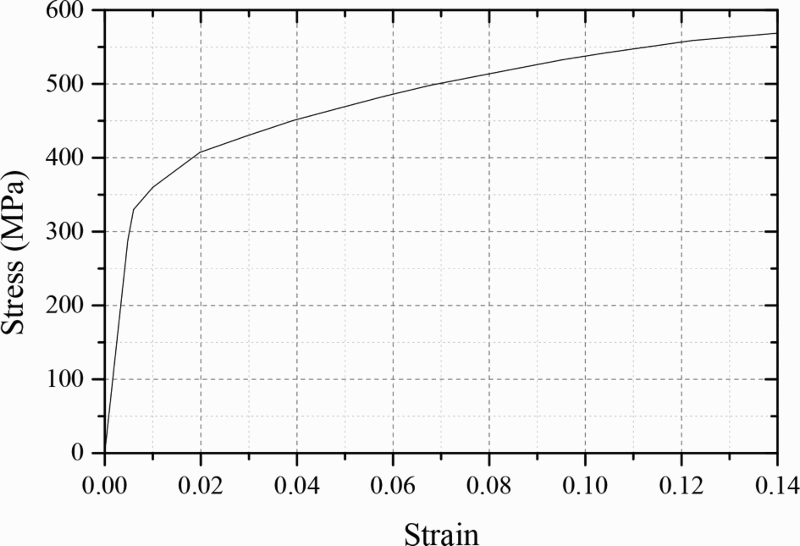
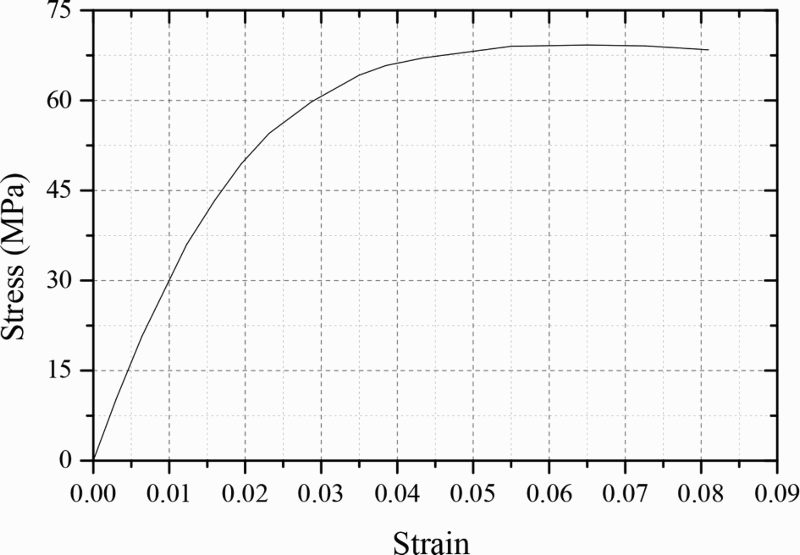
All specimens were tested on an INSTRON 5582 Universal Testing machine, with a load capacity of 100 kN. A displacement rate of 1.27 mm min− 1 was selected. The joints were tested up to failure. The maximum load recorded by the machine was considered as the strength of the joint, while seven specimens were tested for the adhesive material in order to statistically average the mechanical properties. The behaviour of the FM94 is non-linear up to 5% strain. The strain to failure is ∼7–8%. There is no clear point as to where yielding starts to occur. The non-linear behaviour starts at ∼2%, but this does not necessarily mean that permanent plastic deformation has occurred. Mechanical extensometers were used to record the specimen elongation. The mechanical properties of the materials are given in Table 1, while stress–strain curves are presented in Figs. 2 3 –4 respectively.
Materials properties: boron/epoxy, aluminium 2024-T3 and FM94 Cytec
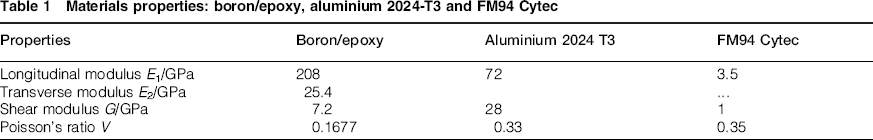
Tensile stress–strain curve for boron/epoxy adherend material 31
Tensile stress–strain curve for Aluminium adherend material
Tensile stress–strain curve for FM94 Cytec adhesive material
Experimental results
In Figure 5, the experimental force–displacement curves of unbalanced SLJs specimens are presented. A significant effect of the overlap length on the maximal force can be observed. A 47% increase of the maximum force can be observed when increasing the overlap length from 13 to 40 mm. On the other hand, for 13 mm overlap length, the behaviour is elastic (up to 5.5 kN). Above the 13 mm overlap length, the curves also contain a completely similar elastic part as those of 13 mm respectively. Above 5.5 kN, the force–displacement relations are globally characterised by a non-linear behaviour up to the maximum load. It is important to mention here that according to the experimental measurements, very good repeatability of results has been obtained, as seven specimens for each case were tested. As shown in Fig. 5, joint strength increases with increasing overlap length (13–40 mm). The stability of the adherend and its surface determine the ultimate limit of durability. One of the factors affecting the ultimate durability is the morphology of the adherends surfaces, which determines the degree of physical bonding between adherends and adhesive. Summarising, the two main types of failure observed in the joints were cohesive failure and apparent interfacial failure. Generally, a cohesive and mixed failure was observed in the joints studied.
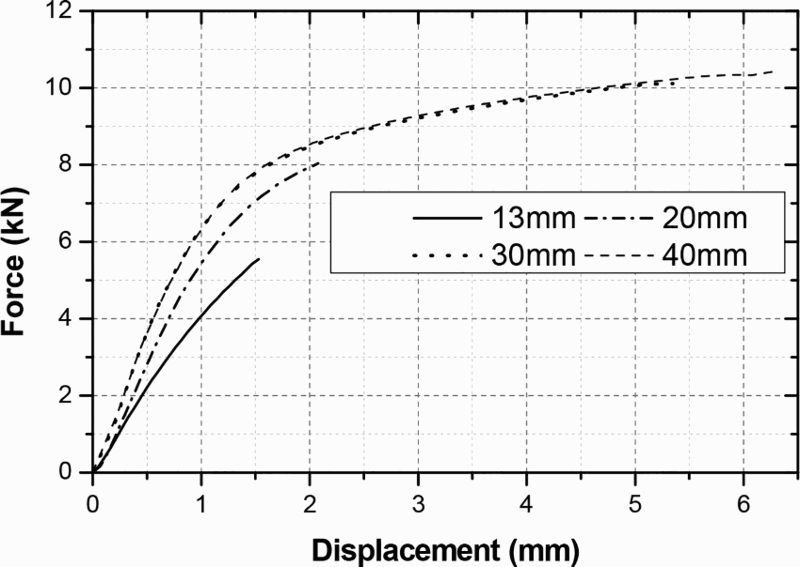
Tensile force–displacement curves for unbalanced SLJs having different overlap lengths
Analytical solution
In order to analyse unbalanced SLJs, there are two key issues to be addressed: first, the neutral point of overlap zone should be found, which is between the neutral planes of the two dissimilar adherend portions (δ01 and δ02) (Fig. 6b, and second, sign convention and coordinate system must be defined (Fig. 6a). Using the specific coordinate system, the bending moment coefficients and deflections of the unbonded adherend sections could be defined as follows:

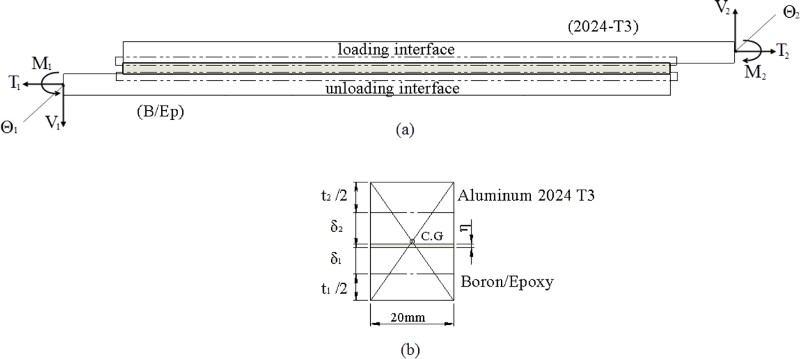
Unbalanced SLJ: a loading conditions and sign (loading and unloading interface; b neutral point of overlap zone between neutral planes of two dissimilar adherends (δ1 and δ2)

Bending moment coefficient
The results of the bending moment coefficient (k) with respect to the overlap length are presented in this section. First, the tensile forces, shear forces and the rotations at the two overlap ends must be determined from equations (3)–(6)).
49
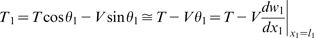
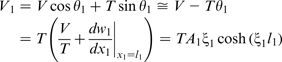
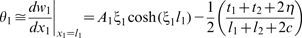
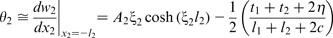
Figure 7 shows that the tensile forces at both unbonded section ends, which are equal and insensitive to the magnitude of the applied tensile loading (
Variation of tensile force at overlap edges as function of applied tensile force (T ) for 13 and 40 mms of overlap lengths respectively
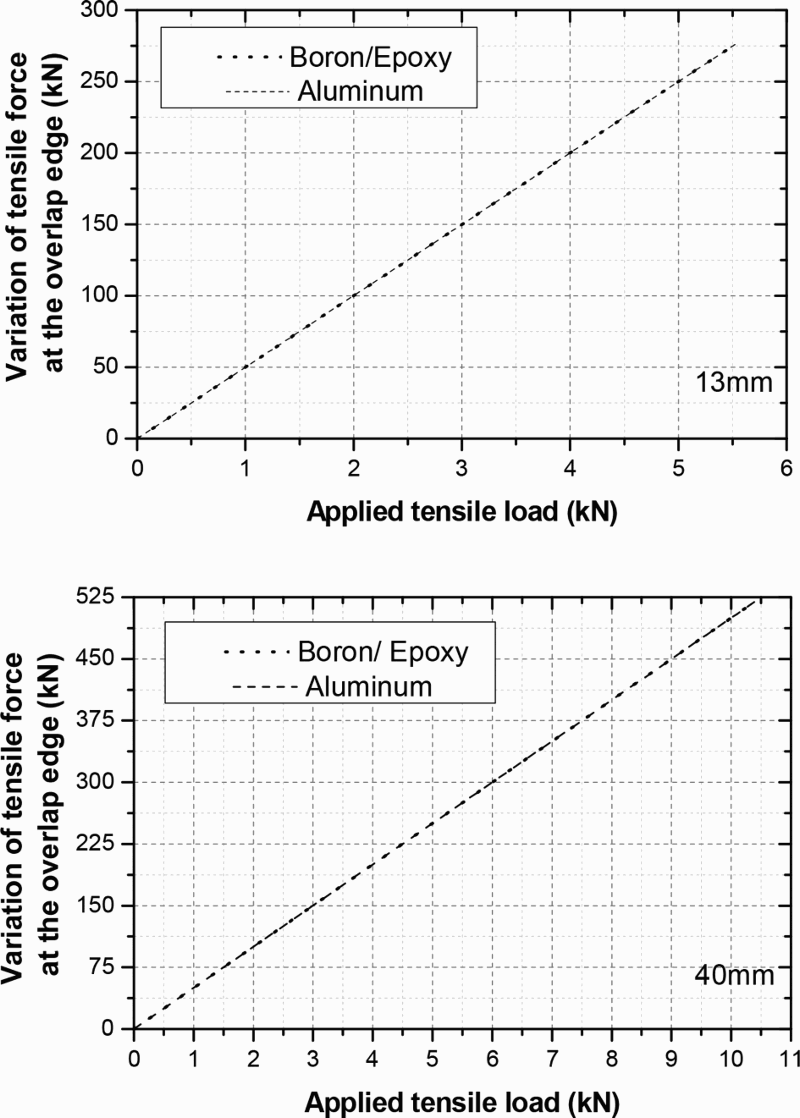
Variation of shear force at overlap edges as function of applied tensile force (T ) for 13 and 40 mms of overlap lengths respectively
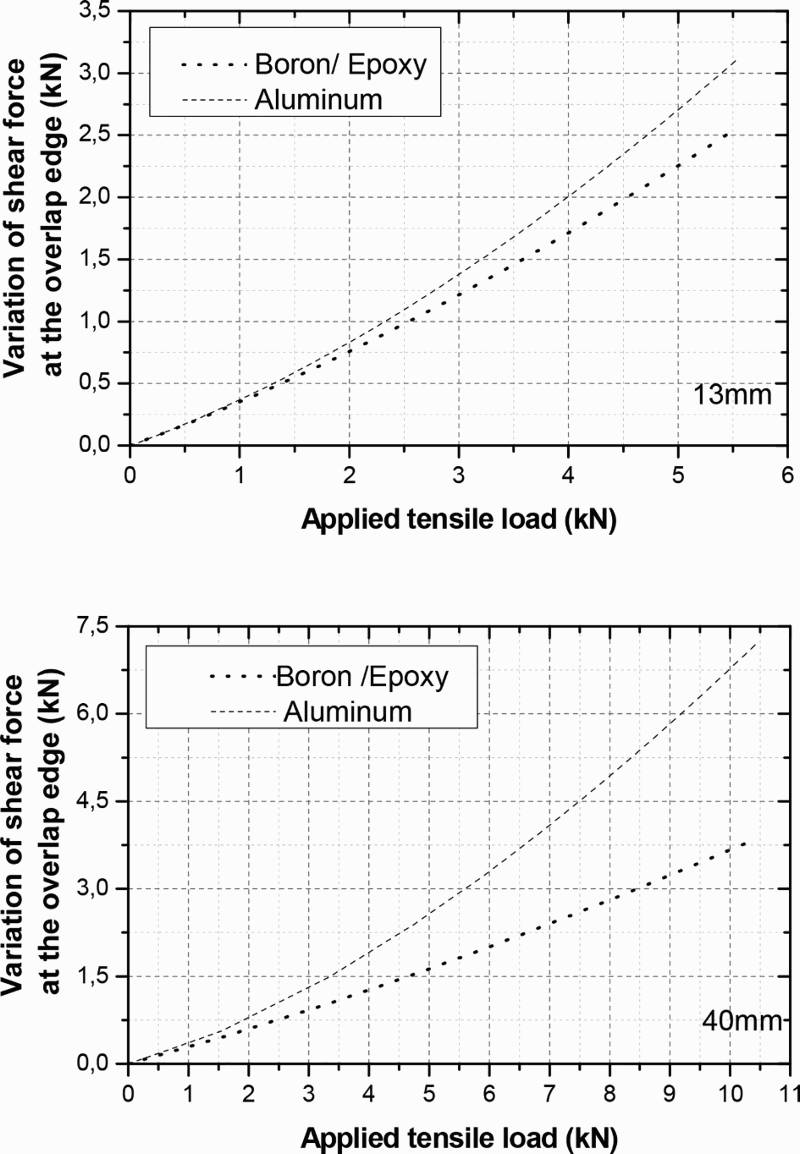
Variation of rotations at overlap edges as a function of applied tensile force (T) for 13 and 40 mms of overlap lengths respectively
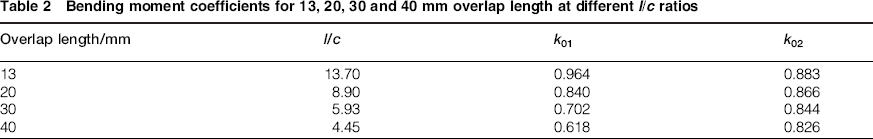
Figures 10 and 11 show the normalised bending moment coefficient, k, variation with tensile load (T) as the l/c ratio increases (for 13 and 40 mm overlap lengths only). All the models available in the literature display k as a family of curves rather than a single curve, thereby showing the high dependence on the l/c value. The grey hatched area represents a region for three cases of k values. The first case refers to k = 0 when the tensile load is zero (T = 0). In the second case, in which the k coefficient is near to 1, the peeling force acts are insignificant due to the bending moment, but for k>1, there is a combination of the shear and tensile stresses in action, which means that tensile stress can influence the bending moment. The peeling forces always act on the adhesive material, even though the effects they cause may be overshadowed by the effects of shear stresses. As shown in the results presented in Table 2, the bending moment coefficient for the stiffer adherend material (k01) is greater than the softer adherend (k02) for a load range between 0 ≤ T ≤ 5.5 kN. It can be seen in Fig. 5 that the aluminium adherend does not yield within the specific loading range because of the relocation of the system neutral axis within the aluminium adherend. The experimental curves exhibit a non-linear behaviour of the specimens, except for the 13 mm overlap length case. Moreover, from 20 to 40 mm overlap lengths, the bending moment coefficient for boron/epoxy was decreased by 26%, while in the aluminium adherend, it was decreased by 4.6%.
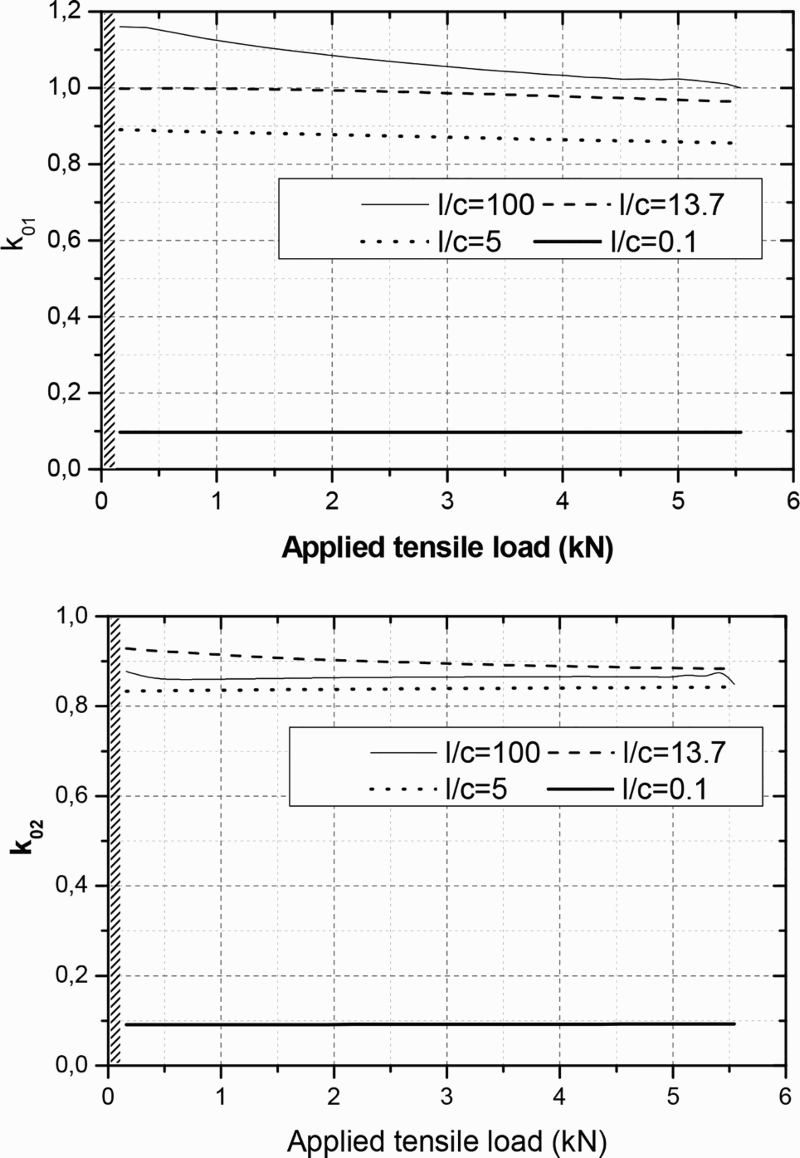
Normalised overlap edge bending moment coefficient (k01: boron/epoxy, k02: aluminium) versus applied tensile load with variation of l/c for 13 mm overlap length
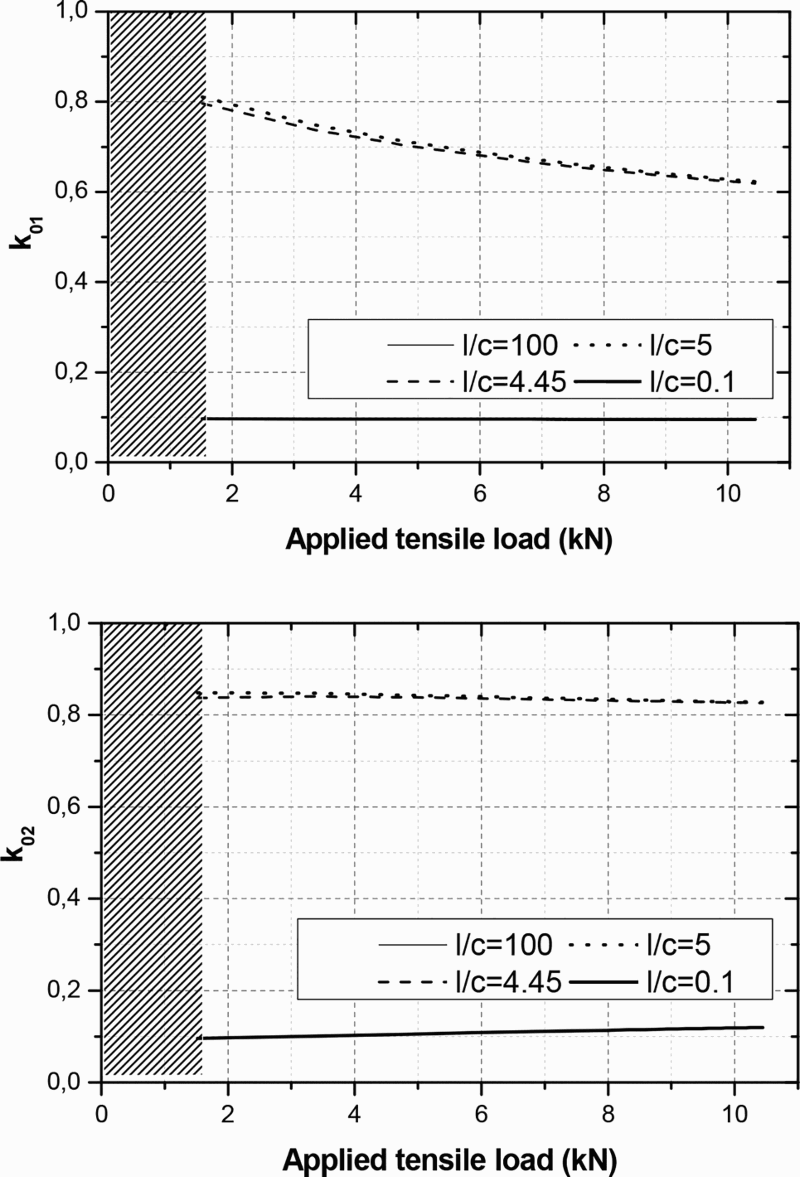
Normalised overlap edge bending moment coefficient (k01: boron/epoxy, k02: aluminium) versus applied tensile load with variation of l/c for 40 mm overlap length
Bending moment coefficients for 13, 20, 30 and 40 mm overlap length at different l/c ratios
Furthermore, as the overlap length is increased from 13 to 40 mm, the maximum l/c ratio is decreased. Indeed, the maximum l/c ratio for 13 mm overlap length is 100, while it becomes as low as 25 for 40 mm of overlap length (55 for 20 mm and 30 for 30 mm). In brief, unbalanced SLJ properties are a direct function of geometry and materials, and should be not manufactured in an arbitrary manner.
Finite element analysis
FEA was carried out using ANSYS Code version 10. The analysis was based on 2D geometrically non-linear plane strain finite element models. An elastic–plastic model was used to predict the progressive failure of the adhesive layer; the following mechanical properties, namely, Young's modulus, Poisson's ratio, and the ultimate stress, were used for the failure model of the adhesive. The laminated composite–aluminium 2024 T3 SLJ was meshed using 8-node (plane 82) isoparametric quadrilateral elements. The 8-node element (PLANE 82) is defined by eight nodes having two degrees of freedom at each node: translations in the nodal x and y directions. The element may be used as a plane element. This element has plasticity, creep, swelling, stress stiffening, large deflection and large strain capabilities. Quadratic elements have midside nodes, and ε x will vary linearly with respect to x axis. For in plane bending problems, quadratic elements are much better than linear elements. In this study, an elastic perfectly plastic model (failure model for the progressive failure analysis) was used to predict the bending moment coefficient at the overlap edges. Because non-identical adherends with differing thicknesses are involved, the FEA model is both mechanically and geometrically asymmetrical. Bending moment coefficient was determined in two different ‘points’ as shown in Fig. 12, while the boundary conditions applied consisted of a hinge at one side and a roller at the other.
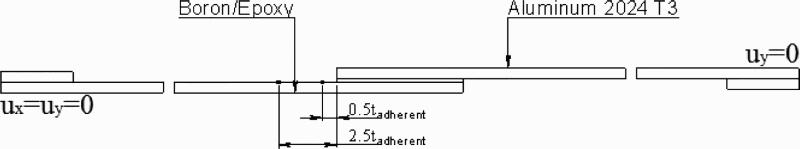
Determination of bending moment coefficient in two different points by finite element method—boundary conditions
In the case that overlap length is >20 mm, plastic regions are initiated at the edge of the overlap zone because of the local deformations at the aluminium adherends. Four elements were placed across the thickness of the adhesive. To determine the conditions for the yielding and subsequent plastic deformation, a yield criterion is required for each of the materials. For the adhesive and aluminium adherend, von Mises criterion was used, which includes a component dependent on the hydrostatic stress. At the ends of the overlap zones, a high stress gradient is expected to occur at the edge of the less stiff adherend. The load is applied incrementally so that the stress–strain distribution follows the load increase, thus enabling the plasticity equations to be solved correctly. This process is needed in the non-linear FEA to avoid the possibility of convergence to an incorrect solution. Load eccentricity is associated with the SLJs, and a relatively large joint rotation occurs when the joint is subjected to axial loading, relieving the bending moments at the end of the joint. In this case, a non-linear analysis is taken into account in Ansys.
In the present study, the adherends of boron/epoxy are assumed to have a linear elastic behaviour, while the adhesive layers of FM94 (Cytec) and aluminium are assumed to be nonlinear. Ansys V.10 is able to account for the large displacement rotations that occur in the SLJ under load; at the same time, the elastic–plastic response of both the adherend and adhesive materials may be included. Consequently, a geometrical non-linearity (effect of large displacements) was also taken into account in this analysis.
Hydrostatic stress distribution
The variation of the hydrostatic stress distribution for four different overlap configurations can be seen in Fig. 13. Under the hydrostatic stress, the volume of the adhesive layer changes. It is clear that hydrostatic stress distributions at the interfaces (as in Fig. 6a) were asymmetric. Along the length of the overlap, a large area exists where the adhesive is under hydrostatic compression. The results indicate that the bending of adherends drastically affects the normal stress concentration in the adhesive layer. The higher hydrostatic stress concentrations occur at the edge corresponding to the less stiff adherend because of bending deformation. As a result, the debonding of the adhesive layer and adherends along the joint is likely to start and propagate due to these transverse normal stress concentrations. The hydrostatic stresses are decreased by increasing the externally applied load. The reduction of the hydrostatic stress is caused by the reduction of the bending moment, which results at large deflections. By comparing experimental findings and FEA analysis for hydrostatic stress distribution, it is confirmed that the plasticisation effect is more accentuated at the edges because of the local deformations of aluminium adherends. In these areas of the joint, the load from one adherend to the other is mainly carried by the edge of the overlap because of tensile stresses (Fig. 14). When the overlap length was increased from 13 to 40 mm,49, 51, 52 there is a larger area where hydrostatic tensile stresses appear on both interfaces.
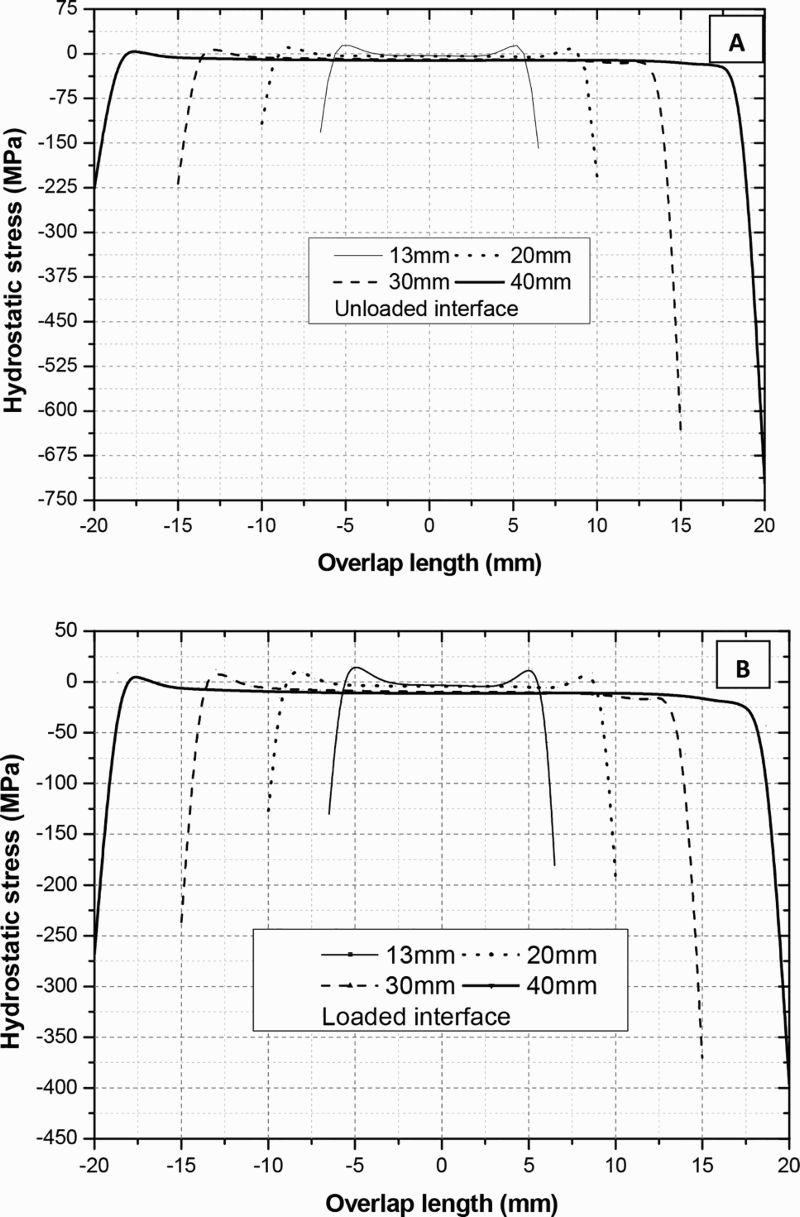
Hydrostatic stress distribution at interfaces for 13 and 40 mm overlap lengths respectively: a unloaded interphase and b loaded interface
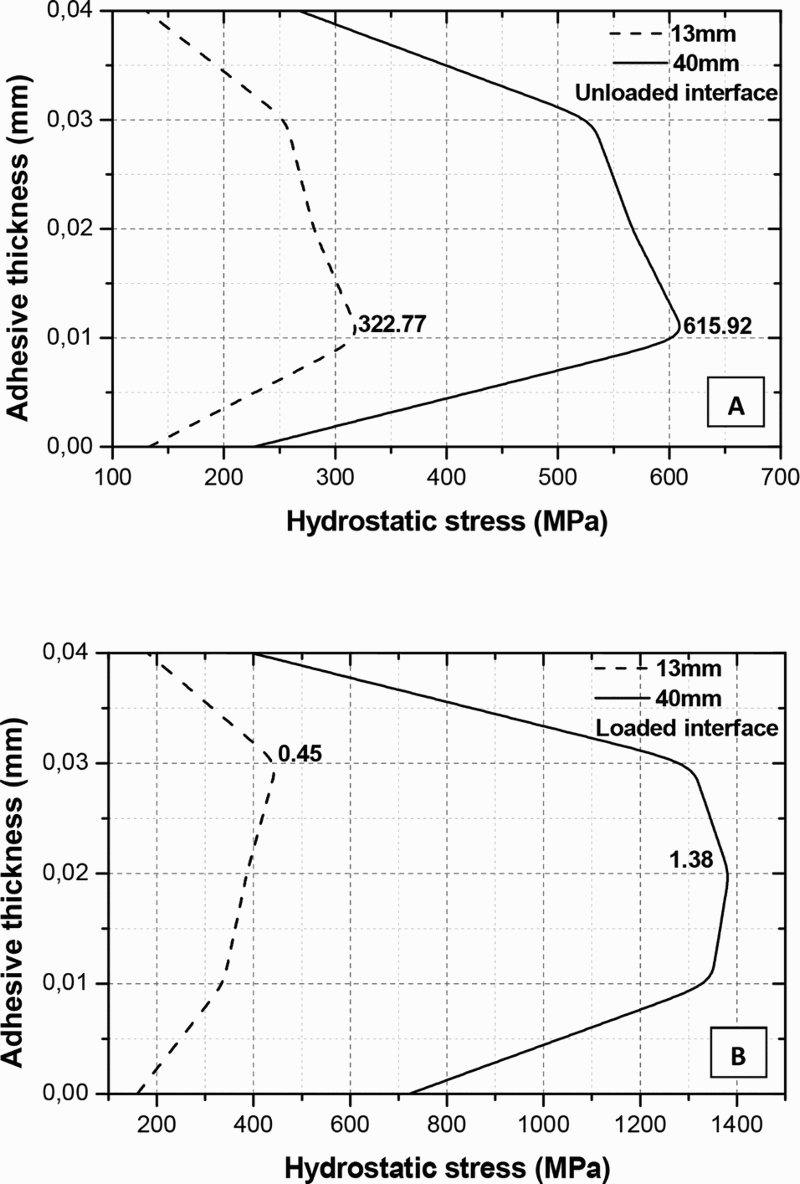
Hydrostatic stress distribution at interfaces for 13 and 40 mm across thickness of adhesive layer: a unloaded interphase and b loaded interface
Based on the above analysis, it can be concluded that the area where the hydrostatic tensile stresses appear is always confined to the ends of the overlap. It exceeds typically 0.5 mm from the edge of the overlap for different overlap lengths. This means that hydrostatic stresses are much more localised and are introduced mainly by the rotation and bending of the aluminium adherends.
Results and discussion
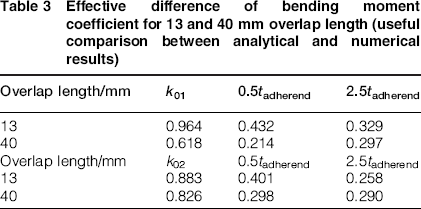
Owing to the great difference in the stiffness of the two adherends in a boron/epoxy–aluminium adhesive joint, the bending moment coefficients are intensified at the end of the joint, from which the less stiff adherend (aluminium) extends. The apparent adherend stiffness imbalance is not to the benefit of the load carrying capacity of the joints. The deformation of the adherends is non-uniform due to the geometrical eccentricity. In the boron/epoxy–aluminium joints, fracture takes place as a result of plastic deformation of the aluminium adherend. Figures 15 and 16 represent the variation of k–T values for both 13 and 40 mm overlap lengths respectively. At low levels of tensile loading, analytical solution yields lower values of k, but as tensile load is increased, the bending moment coefficient decreases because of the elastic–plastic behaviour of the adhesive material. Data presented in Table 3 show that the bending moment coefficient for both 13 and 40 mm overlap lengths is being decreased at a distance of 2.5tadherend, since the plastic deformation takes place in the aluminium adherend. Bending moment coefficient must then be determined not far away from 2.5tadherend at the overlap edge. 53
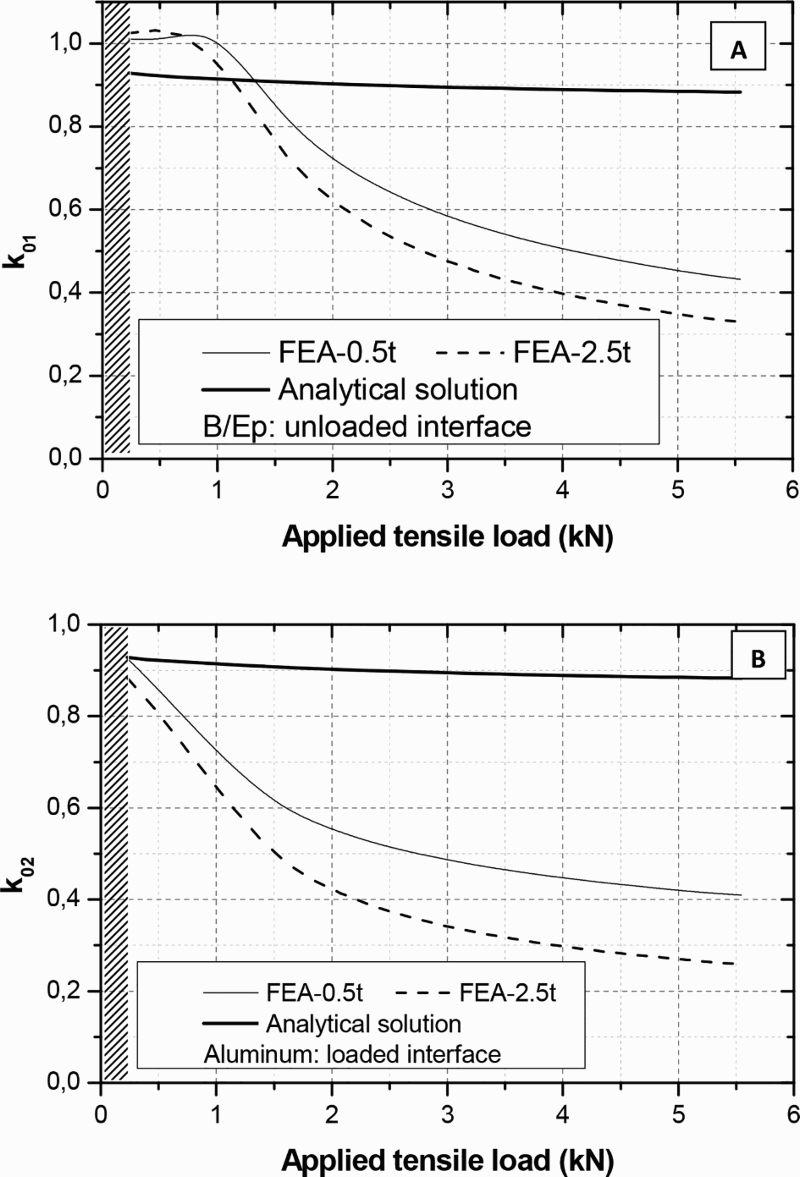
Comparison between analytical and numerical analysis for a unloaded and b loaded interface (13 mm overlap length)
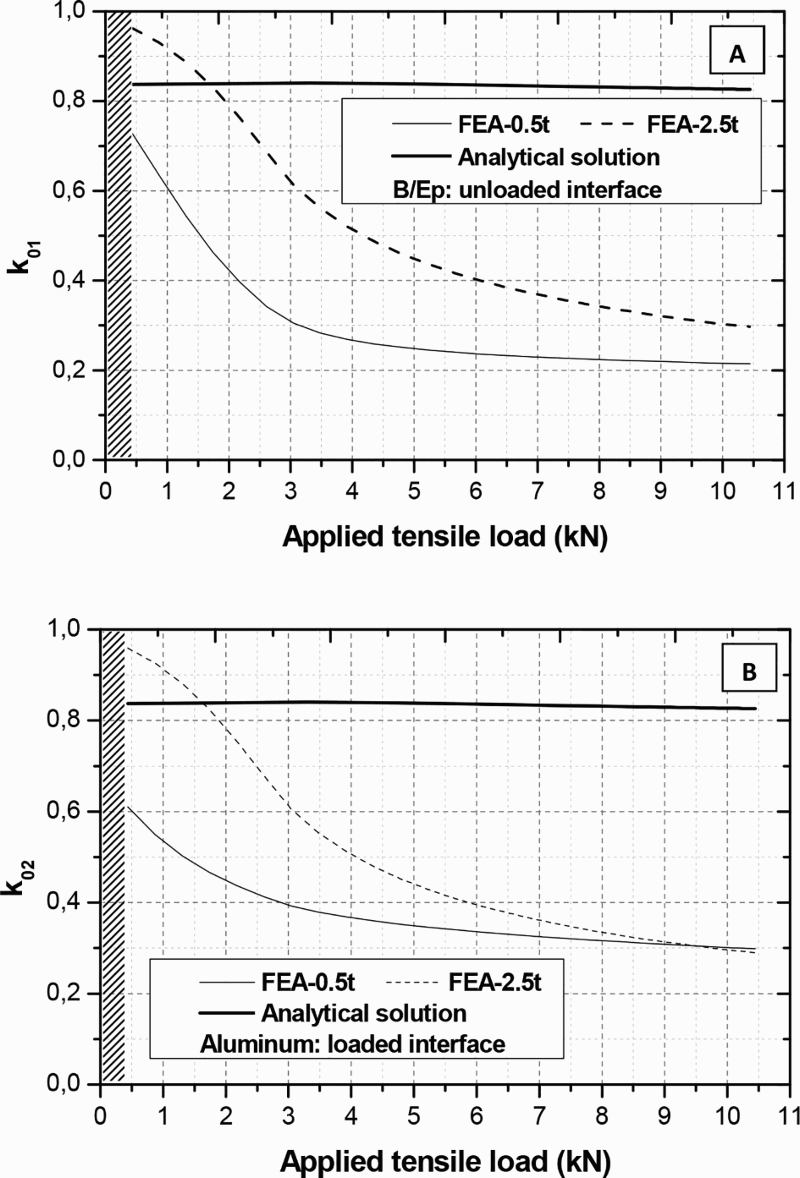
Comparison between analytical and numerical analysis for a unloaded and b loaded interface (40 mm overlap length)
Effective difference of bending moment coefficient for 13 and 40 mm overlap length (useful comparison between analytical and numerical results)
Conclusions
Based on the analysis performed in model specimens of unbalanced SLJs, the following conclusions can be drawn.
It is well known that there are many proposed closed form solutions available in the literature for the case of unbalanced joints because of the coupling between the adhesive stresses. Some useful steps are needed in order to determine the bending moment coefficient. Initially, the neutral point of overlap zone, which lies between the neutral planes of the two dissimilar adherend portions (δ1 and δ2), should be found. Second, it is recommended to determine the tensile–shear forces per unit width at the edges of the overlap length as well as the rotation angularities. By increasing the overlap length of the SLJ, the bending moment coefficient decreased especially in the boron/epoxy adherend.
A finite element formulation for single lap adhesive joints was also presented, which can provide the distribution of the hydrostatic stress in a variety of adhesive joints with any possible adhesive layer conditions and non-identical adherends. The results revealed that the maximum normal stresses increased as the overlap length increased, but the lap shear strength was not proportional to the overlap length. The bending of one or both adherends is a dominant factor on the stress–strain distribution in the adhesive joints, because stresses and strains are much more localised at the edges. Practically, regardless of the adhesive performance, the strength of the joints was dominated by the joint configuration and design.
Furthermore, the results revealed that independently of the calculated point of bending moment coefficient (at 2.5tadherend), k will remained almost constant unless the free length of the joint varied, while the bending moment coefficient was never equal to zero even when c < < l.
Nomenclature: c, half overlap length; 2c, overlap length; Di, adherend bending stiffness per unit width; l, unbonded adherend length (0 < xi < l); Moi, bending moment per unit width; T, tensile load per unit width; Ti, tensile load per unit joint width; Vi, shear load per unit width; ti, adherend thickness; η, adhesive thickness; ξi, joint parameter (
 ); w, transverse deflection of overlap section; δi, distance between neutral planes of adherend; wi, transverse deflection of unbonded deflection; C.G, central of gravity; i = 1,2 (for boron/epoxy and aluminium adherend respectively).