
Abstract
A powder of tungsten carbide WC was mixed with 20 or 50 mass-% of atomised binder powder consisting of iron alloyed with 22 mass-% manganese and sintered at 1300°C. The constitution was calculated with the Thermo-Calc program using the database TCFE6 and compared to the microstructure analysed by light optical microscopy, X-ray diffraction, SEM with EDX and electron backscattered diffraction. The materials 50∶50 and 80∶20 (WC/binder in mass-%) fell just short of the two-phase region of WC+γ and η-M6C appeared. The addition of 1 mass-% graphite shifted 80∶20∶1 beyond this region and entailed M3C cementite. The hot hardness was too low to consider cutting applications. Therefore, the resistance to abrasion by mineral particles was investigated at room temperature by single and multiple scratch tests and by pin on plate wear tests. The good wear resistance is due to the high hardness and size of η-carbides and the intensive cold workhardening in the wear surface, which was supported by transformation induced plasticity and revealed by focused ion beam TEM.
Keywords
Introduction
Standard hardmetals consist of tungsten carbides held together by a cobalt binder. They are produced by powder metallurgy (PM). A content of WC ⩾80 mass-% is aimed at a high wear resistance, while the remainder of the Co binder phase provides the required toughness of tools for metal cutting or wear parts.1 However, sintered WC–Co hardmetals are currently classified by the International Agency for Research on Cancer as probably carcinogenic for humans.2
This and the high price of Co spurred research on replacing cobalt by iron and nickel.3,4 Comparing the isothermal phase diagrams of W–Co–C, W–Ni–C and W–Fe–C5 reveals similarities and a rather narrow region of the WC+fcc phase field, which is encased by precipitation of detrimental graphite on one side and η-M6C phase on the other. The narrow two-phase range of optimal properties is also shown in calculated isoplethal phase diagrams.6 Thus, the control of carbon is a key task of any development. The addition of Ni to Fe raises the carbon activity and spurs the precipitation of graphite, while manganese acts in the opposite direction. Recently, it was demonstrated that a high content of W dissolved in the binder phase raises the hot hardness, which is an important property in metal cutting.7
A study on sintered hardmetals with 80 mass-%WC and an iron base binder with 6, 10 and 16 mass-%Mn pursued the transfer from a martensitic to an austenitic matrix. Carbon was added to avoid η-phase.8 Later, hardmetals with 75 or 85 mass-%WC were investigated using an iron based binder with 13·5 mass-%Mn and additions of carbon.9 The composition of the binder phase is probably close to that of Hadfield steel, which is known for its high workhardening rate. Recently, a grade with 94 mass-%WC was produced with an Fe–13·5 mass-%Mn binder as well, but by the novel process of pulse plasma sintering.10
In the present study, an Fe–22 mass-%Mn binder is used to compact 50 and 80 mass-%WC by sintering at 1300°C. High manganese alloys are known for transformation induced plasticity (TRIP) or twining induced plasticity.11 Their cold workhardening is enhanced by interstitial atoms.12,13 It is the aim of this investigation to characterise the constitution and microstructure of these hardmetals with Fe–Mn binder and their resistance to abrasive wear as encountered in wear parts for mineral processing. It is of interest if cold workhardening in the wear surface is accompanied by TRIP or twining induced plasticity.
Methods of investigation
Calculations
Thermodynamic calculations were carried out to establish the constitution of the Fe–Mn–W–C system. The Thermo-Calc program and the TCFE6 database were used to derive constitutional diagrams and the phase composition. On this basis, suitable materials were selected for manufacture and testing.
Materials
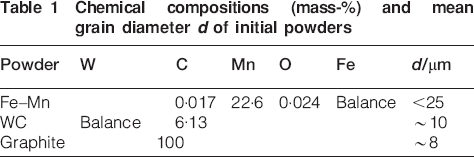
The PM manufacture started from a gas atomised Fe–Mn powder and a crushed WC carbide powder, the chemical composition and grain size of which are given in Table 1. Mixtures of 80 mass-%WC+20 mass-%Fe–Mn powders and of 50 mass-% each were processed in a ball mill for 5 h in ethanol and subsequently compacted at 860°C in a die of 30×15×6 mm in size. In addition, a specimen with (mass-%) 79·2 WC, 19·8 Fe–Mn and 1 graphite was prepared.
Chemical compositions (mass-%) and mean grain diameter d of initial powders
The die compacted specimens were heated in nitrogen gas at a rate of 10°C min−1 with a 30 min holding time at 1100°C to the sintering temperature of 1300°C and held for 1 h, followed by slow cooling in the furnace. One batch of specimens was solution annealed at 1050°C for 1 h and quenched (q) while the other remained in the as sintered state (s). The designation of the different PM materials is explained in Table 2.
Designation of samples based on initial content of powders (representing total element content) and on respective state*
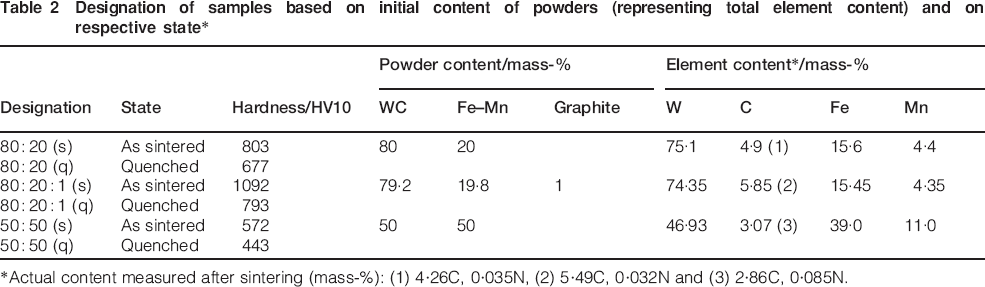
*Actual content measured after sintering (mass-%): (1) 4·26C, 0·035N, (2) 5·49C, 0·032N and (3) 2·86C, 0·085N.
Microstructure and hardness
Light optical microscopy (LOM), scanning electron microscopy (SEM) including energy dispersive X-ray analysis (EDX) and electron backscattered diffraction (EBSD), transmission electron microscopy (TEM), X-ray diffraction (XRD) and microhardness measurements were used to characterise the microstructure of the samples as sintered as well as after solution annealing and to evaluate the surface of the material after wear and scratch tests. A confocal laser scanning microscope (CLSM) was used to measure the scratches on each phase. The hot hardness HV30 was measured at the Fraunhofer Institute IKTS, Dresden, in vacuum after 15 s under load.
Wear and scratch tests at room temperature
A pin on plate test was carried out with specimens of Φ6 mm, rotating slowly. Its end face of area A moved over a plate covered with abrasive paper for a distance L⩽50 m under normal force FN at velocity v (Fig. 1). The dimensionless wear resistance is W−1 = ρAL/Δm, where the density ρ is obtained by submersion test. The mass loss Δm was measured with a precision scale. A multiple scratch test was carried out with the same technique, but without rotation of the sample, with a polished end face and for a distance L≈10 mm. A single scratch test used a diamond cone with vertex angle of 90° and tip radius of 2 μm. Normal loads FN of 50 and 100 nN and a scratch velocity v = 0·4 mm min−1 were applied. The cross-sectional profile, measured by CLSM, provided the area Av of the removed material, and the areas A1 and A2 of deformed ridges on either side of the groove (cf. Fig. 2). From these, fab = [Av−(A1+A2)]/Av was derived for each phase.14 Measuring the tangential force FT led to the scratch hardness FT/AV, and by incorporating the scratch length l to the specific scratch energy, es = FTl/AVl (in J mm−3).
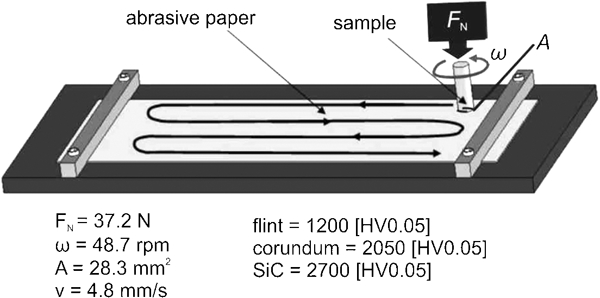
Schematic representation of pin on plate wear tests
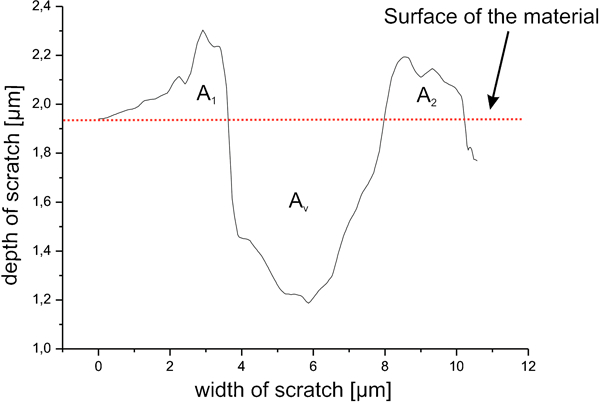
Cross-section of single scratch in austenite of 80∶20 (q) measured by CLSM
Results
Constitution
Isoplethal phase diagrams of the three materials were calculated in dependence of the metal content contained in the initial powder mixture (Table 2) and plotted over the carbon content. As the metal contents of 80∶20 and 80∶20∶1 are quite close, only one system is shown in Fig. 3, which may be used to interpret the other. The alloy system, including 50∶50, is depicted in Fig. 4. The initial carbon content is shifted somewhat to the left because of a slight loss of C during manufacturing (Table 2). Dashed horizontal lines indicate the sintering temperature of 1300°C, the solution anneal temperature of 1050°C and the temperature of 600°C, which was taken as the lower reliable limit of calculation. The equilibrated solution annealed state was preserved by quenching and compared to as quenched (q) samples. The furnace cooled as sintered samples (s) were compared with the state at 600°C. The results are compiled in Table 3, which contains the type, content and chemical composition of phases calculated by Thermo-Calc confronted with EDX measurements of as sintered or quenched samples.
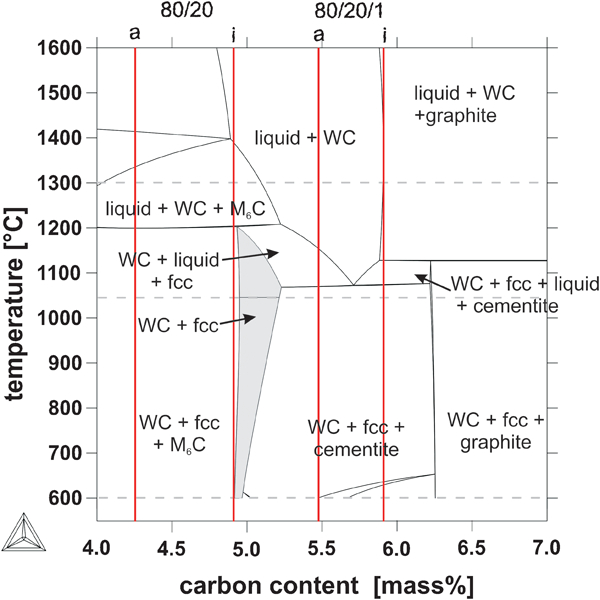
Calculated phase diagram of alloy system 75·1W–15·6Fe–4·4Mn–C (mass-%) corresponding to material 80∶20, which is similar to 80∶20∶1 (compare Table 2) (a: actual; i: initial carbon content)
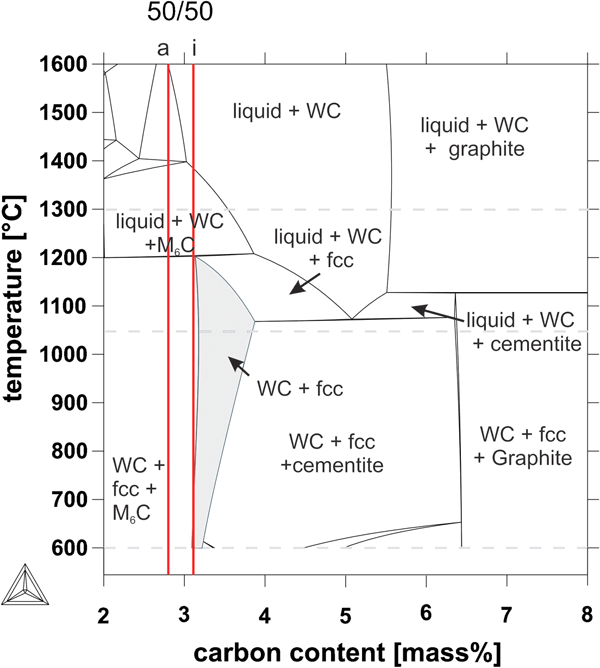
Calculated phase diagram of alloy system 46·9W–39Fe–11Mn–C (mass-%) corresponding to material 50∶50 (cf. Table 2) (a: actual; i: initial carbon content)
Phase characteristics as calculated by Thermo-Calc for actual carbon content (upper or single line) compared with EDX and hardness measurements (lower line) at 1050°C (state q) and at 600°C (taken as state s)
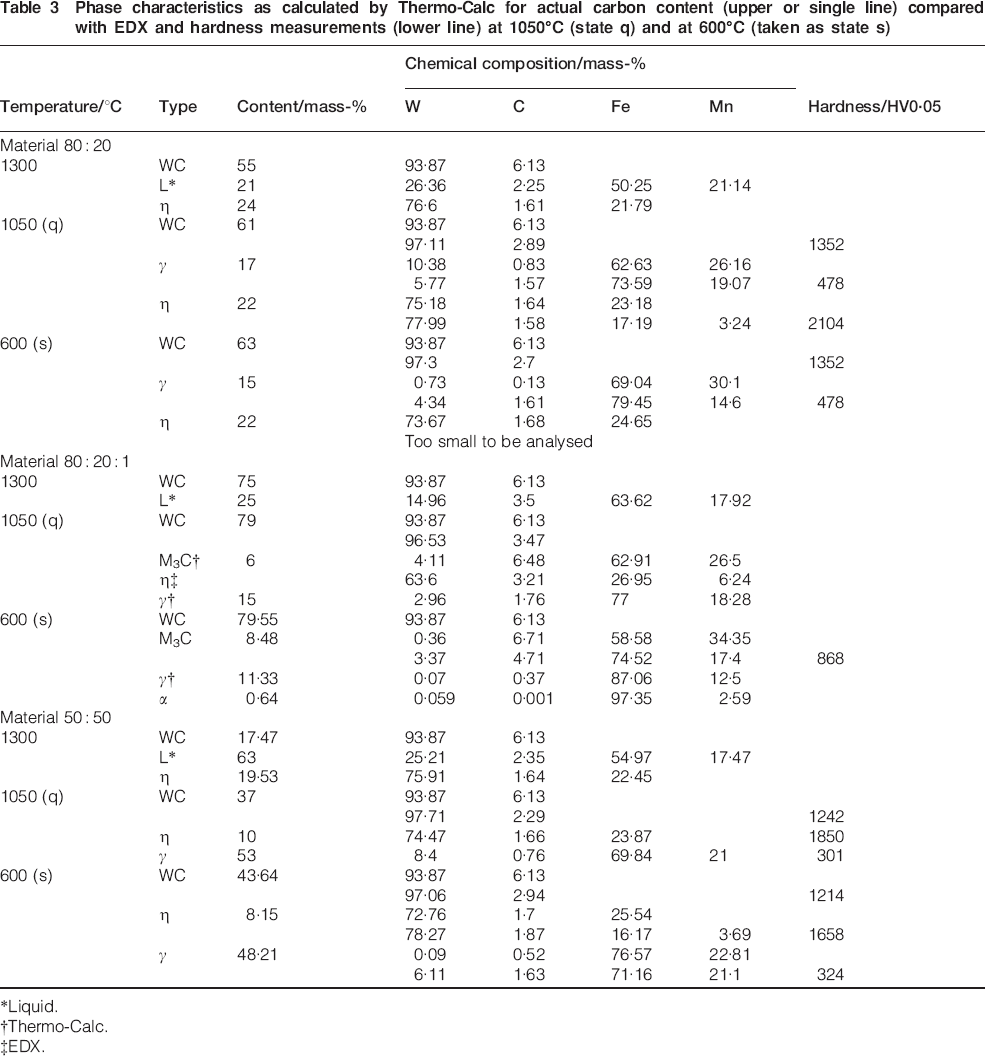
*Liquid.
†Thermo-Calc.
‡EDX.
Figures 3 and 4 clearly show that none of the actual compositions touch the two-phase region of WC+fcc γ (in grey). Instead, η-M6C is added to 80∶20 and 50∶50, while M3C cementite is predicted as the third phase for 80∶20∶1. This is supported by EDX and other measurements presented later. However, η is measured at 1050°C as a fourth phase in 80∶20∶1. The metal content recorded by EDX is known to be more reliable than the carbon content. In general, the measured W/C ratio of WC is higher than the calculated one, which is reflected by the low hardness of this phase, being inferior to that of η. For this phase, the calculated and measured phase compositions come close to each other, but some Fe is replaced by Mn, which is not predicted by Thermo-Calc. In addition, the higher measured content of W in M3C and γ differs from the calculation. No bcc α is found in 80∶20∶1 (s).
In addition to the verification of the predicted phase composition by EDX, the phase contents were measured by metallography and compared to the calculated ones of material 50∶50. In Fig. 5, the volume content of phases is plotted for the actual carbon content in dependence of the temperature. The measured contents are represented by dots for 50∶50 (q) at 1050°C and for 50∶50 (s) at 600°C. Solution annealing brings the measured phase contents close to the calculated ones. After slow cooling in the furnace, the γ content is similar to the one calculated at 600°C, but the change of place between η and WC predicted at ∼1200°C is not measured at 600°C.
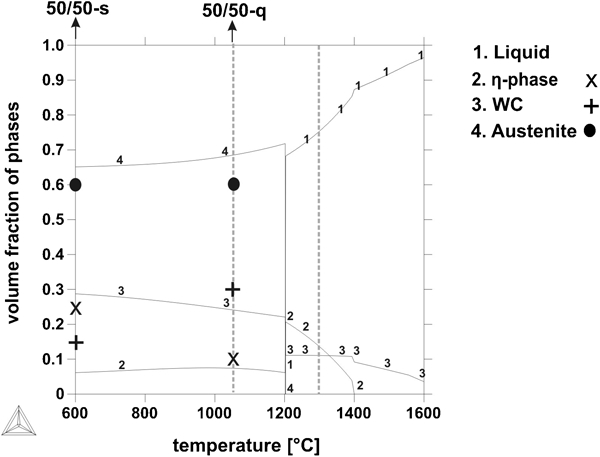
Volume fraction of phases in material 50∶50 for actual carbon content of 2·86 mass-%: lines represent calculated fraction and dots stand for contents measured at 1050 and 600°C respectively
Microstructure
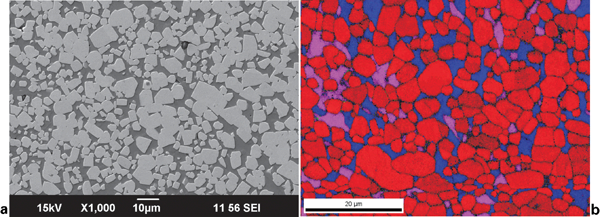
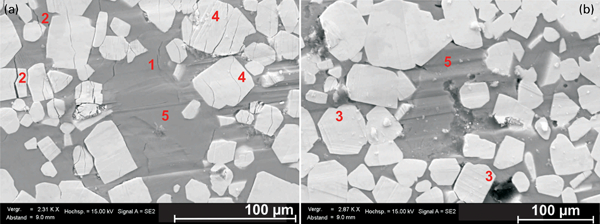
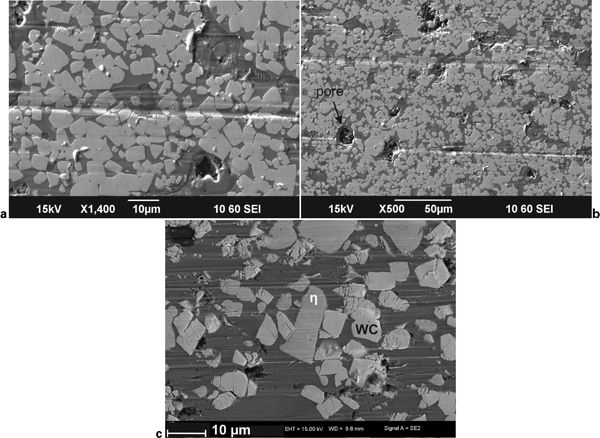
The structure of 50∶50 (s) is shown in Fig. 6. The SEM mode of backscattered electrons hints at a rising content of heavy W in γ (black) over η (grey) to WC (white). This is confirmed by EBSD, which reflects the crystallographic structure of the phases. Fine precipitates are visible in austenite after solution annealing (Fig. 7). The SEM image of 80∶20 (s) is similar to that of 80∶20∶1 (s), which is depicted in Fig. 8a. However, EBSD reveals WC, η and γ in 80∶20 (s) and 80∶20 (q), but WC, M3C and γ for 80∶20∶1 (s) (Fig. 8b). In addition, a small amount of fine η is found in 80∶20∶1 (q) by EBSD spot measurement. The global identification of phases by XRD measurements (Table 4) is in line with the local EBSD except for M3C in 80∶20∶1, whose peaks are concealed by those of WC. The samples contain ∼0·8 vol.-% of pores, and oxides are found in the binder phase.
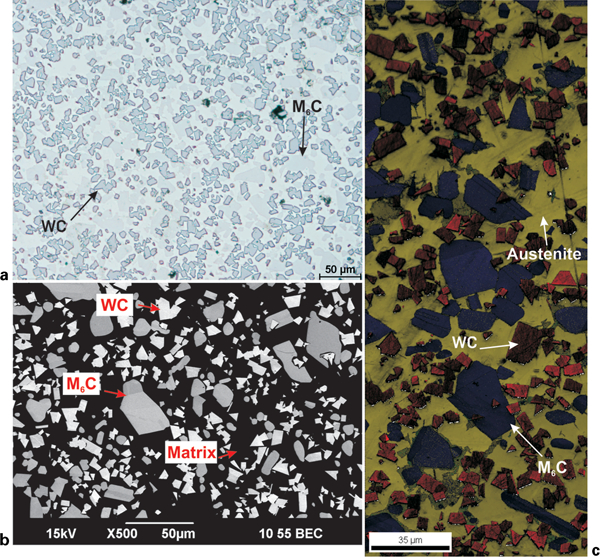
Microstructure of 50∶50 (s)
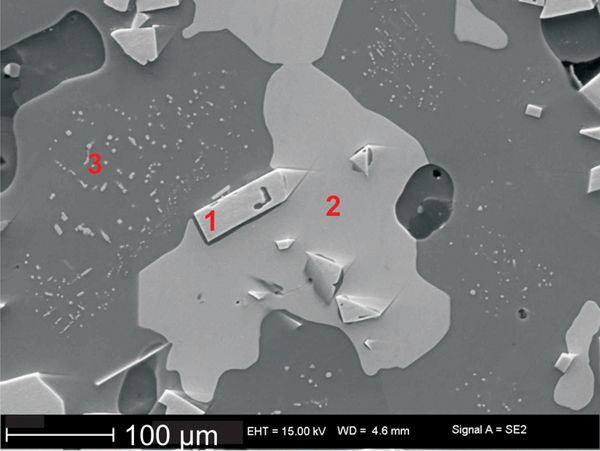
Microstructure of 50∶50 (q) (SEM): 1 = WC, 2 = η and 3 = fine precipitates in austenite
Microstructure of 80∶20∶1 (s): WC = red, M3C = blue, γ = magenta
Phases detected by XRD*
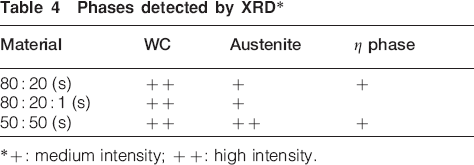
*+: medium intensity; ++: high intensity.
Hardness
The macrohardness in Table 2 is increased by a higher WC content (50∶50→80∶20) and the addition of graphite (80∶20→80∶20∶1), but lowered by solution annealing (as sintered→quenched). The microhardness (Table 3) of WC is below that of η, and γ is harder in 80∶20 than in 50∶50.
The hot hardness was measured to decide if the studied materials are suited for metal or wood cutting or rather for wear parts. The tests were performed under the same conditions as used by Gries,7 whose results are taken for reference (Fig. 9); 80∶20 (s) and 50∶50 (s) contain less WC than the reference materials, which is at least one reason for their lower hot hardness. Porosity and the difference in binder composition may be further causes.
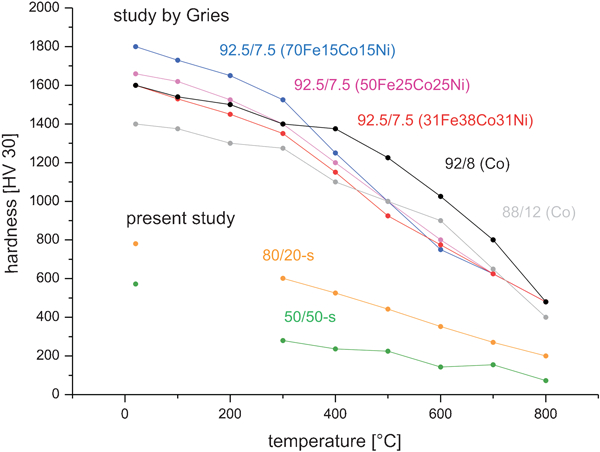
Hot hardness of 80∶20 (s) and 50∶50 (s) compared to reference materials by Gries7 with 88–92·5 mass-%WC and 12–7·5 mass-% binder, composition of which is given in mass-% in brackets
Wear
Single scratch tests
An example of a cross-section through a groove is shown in Fig. 2, which allows to calculate fab and the specific scratch energy es required to remove a given wear volume. The results of one cross-section each are presented in Table 5. As expected, the fab values of the hard phases WC and η are close to one which points to microcutting. This means that the groove volume is removed from the surface. An example of a scratched η particle is presented in Fig. 10. The dark binder phase between the brighter hard phases is now called matrix, because the large fab scatter suggests that not all of it consist of austenite. This would also apply to the difference in microhardness contained in Table 3. The lower the fab of the matrix, the more the microploughing is involved. This means that the part of the groove volume is displaced but not removed. Because of the cone shaped indenter, the fab values of the matrix are smaller than those previously measured with a sharp edged indenter on austenitic steels.15,16
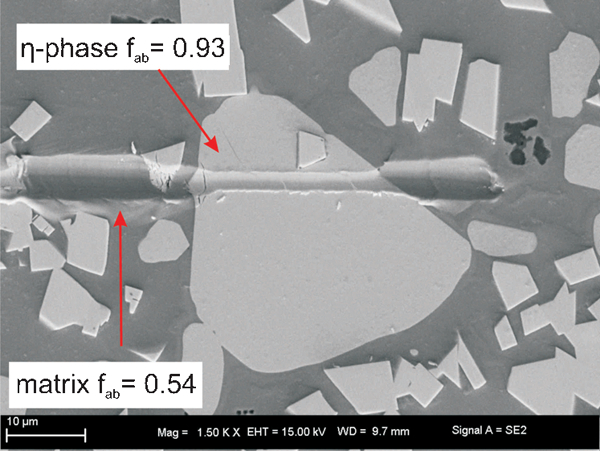
Single scratch on polished surface of 50∶50 (s) (SEM)
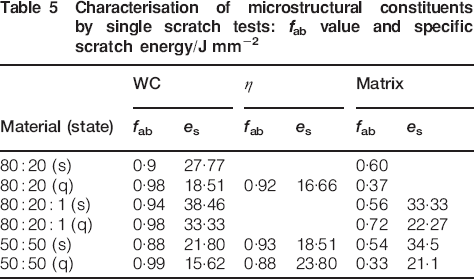
Characterisation of microstructural constituents by single scratch tests: fab value and specific scratch energy/J mm−2
Multiple scratch tests
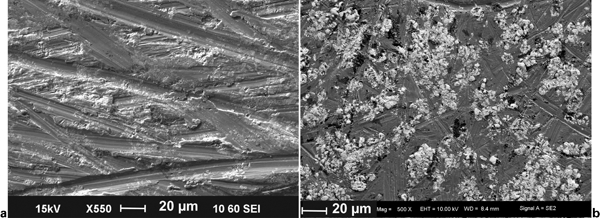
This scratched surface offers a view on the acting wear mechanisms (Fig. 11). Flint is hard enough to groove the matrix of 80∶20-s but not the hard phases of which WC tends to deform and fracture. Cracks extend from WC into the matrix or maybe initiated from below. However, the hard phases are scratched in other areas, as shown for example in Fig. 12a, which is brought about by fractured WC detached from the surface. In Fig. 12b, such a groove of autogenous wear is initiated at a pore. Being harder than WC, η is less affected by autogenous wear and more resistant to cracking (Fig. 12c).
Two indiscriminate locations (a, b) of polished surface of 80∶20 (s) after multiple scratch test with 80 mesh flint (SEM) ((1): crack in matrix; (2): crack of WC extending into matrix; (3): slip lines on WC; (4): fractured WC; (5): grooves in matrix)
Polished surface after multiple scratch test with 80 mesh flint (SEM)
Pin on plate tests
The integral wear resistance (W−1) of the present and reference materials is compiled in Table 6 for two abrasives and mesh sizes, which have a higher impact on the wear resistance than the material composition and state. A coarser mesh size entails wider grooves, which may exceed the size of hard phases. In this case, they are removed with the chip. They remain in the wear surface and act as effective barriers if the mesh size and the respective grooves are finer (Fig. 13).
Wear surface after pin on plate test of 50∶50 (s) (SEM)
Dimensionless wear resistance in 105 W−1 measured by pin on plate tests.
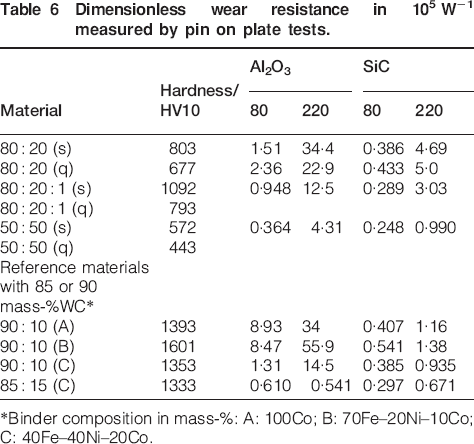
*Binder composition in mass-%: A: 100Co; B: 70Fe–20Ni–10Co; C: 40Fe–40Ni–20Co.
Discussion
General aspects
The present hardmetals, produced on a laboratory scale, suffer from a number of deficiencies. The porosity is four times higher than allowed by ISO 4505. The number of oxides suggests that the oxygen content exceeds the 0·024 mass-% contained in Fe–Mn powder (Table 1) and that further oxygen was picked up during processing. It seems to have caused the slight loss of carbon as well (Table 2). The carbon content was not balanced accurately enough to achieve a two-phase WC+γ structure preferred for WC–Co hardmetals. The low hot hardness excluded service at elevated temperature and shifted the investigation from cutting tests to wear tests at room temperature. More information is contained in Ref. 17.
In spite of these deficiencies, the investigated materials provide an insight into the constitution and microstructure of Fe–Mn based hardmetals and their resistance to abrasion by mineral particles. From a manufacturing point of view, sintering in nitrogen prevented a loss of Mn by evaporation, while N increased with the binder content but remained at a tolerable level (Table 2).
Microstructural aspects
Evolution
The calculation shows that about a quarter of the mass is liquid in 80∶20 and 80∶20∶1 at the sintering temperature of 1300°C (Table 3), which is just sufficient to allow for rapid diffusion as well as for the reformation and rearrangement of the hard phases. In 50∶50, the liquid mass fraction is more than twice, and the volume fraction was about three times as high (Fig. 5). However, the hard phases are rather evenly distributed (Fig. 6), which may be due to the growth of η supporting the WC. The remainder of the agglomerates in the initial WC powder are dispersed in all three materials by the penetration of liquid. The mean size of WC in the microstructure is about half of that in the initial powder, which stems from milling and reactions with the liquid phase. In contrast to WC–Co hardmetals, the edge of the present WC particles is mostly rounded. This was observed earlier in hardmetals with a binder containing iron18 and seems to be in line with the transfer of W and C from WC to the other phases. The already high solubility of C in γ-Fe is further increased by Mn. This is different from a Co binder and causes the drain of C from WC, which is thereby weakened (low microhardness in Table 3) and embrittled (cracks in the wear surface, Figs. 11a and 12c).
Verification of calculations
The initial carbon content of 80∶20 and 50∶50 fell just short of the shaded two-phase region in the respective phase diagrams (Figs. 3 and 4). Thus, η phase was added, the content of which was raised by a loss of C during manufacture. The addition of 1 mass-%C shifted 80∶20∶1 to the right of the shaded area and resulted in M3C cementite to appear as a third phase in the as sintered state (Fig. 8), just as predicted by the calculation. However, η was found by EBSD after solution annealing, leading to a four-phase structure of WC, M3C, η and γ in 80∶20∶1 (q). A similar deviation from calculations was observed earlier for WC–Fe19 and WC–Co.20 The low carbon content of WC in 80∶20 is only partially replenished in 80∶20∶1 because of C consumed by M3C (Table 3). The reaction L+WC+η→WC+η at the solidus temperature of 1200°C (Figs. 3 and 4) increases the fraction of WC at the expense of η (Fig. 5). After cooling to the lower limit of the calculation at 600°C, the volume ratio of WC/η has increased to ∼4. However, this equilibrium ratio is not met by furnace cooled 50∶50 (s), showing an experimental ratio of ∼0·6. This result suggests that only partial equilibrium was reached at the solidus temperature. After solution annealing, the experimental ratio was up to ∼3, demonstrating that the heat treatment almost restored equilibrium.
Resistance to abrasion
Abrasion is the prevalent wear mechanism of grooving wear by mineral particles. Their hardness often exceeds that of metals which are scratched considerably. Hard particles like carbides are added to the metal matrix to impede the wear loss. To be effective, the carbides have to be harder than the mineral and larger than the cross-section of the groove, which, at a given normal load, increases with the size of the mineral particles. The initial strength of the matrix increases during wear and is required to support the carbides.
Interaction of carbides and abrasives
Following these general rules,14,15 the major influence of the test conditions on the wear resistance can be interpreted as follows: The hardness of flint (Fig. 1) is between that of the matrix and of the WC and M6C carbides (Table 3), which are not scratched (Fig. 11). Grooves appear in the softer matrix, though. The austenitic matrix may contain small carbides (Fig. 7) or larger ones of cementite (Fig. 8), which are not discernable by LOM. Cementite is softer than flint and more brittle than austenite, which lowers the wear resistance W−1 (Table 6), because microcracking is eased. It is assumed that the scatter of fab in the matrix (Table 5) is related to its actual content of austenite. If it comes to Al2O3 only, η is about as hard, which is an advantage of this otherwise unwanted phase. All the microstructural constituents are cut by SiC because of its superior hardness. The carbides become ineffective, and the difference of W−1 between 50∶50 and reference 90∶10 dwindles. The influence of the mesh size, as explained in Fig. 13, applies to all material states tested. The coarser abrasive grains of 80 mesh entail a lower W−1 compared to the 220 mesh.
Effect of matrix
There are several contributions to the initial strength of the matrix:
the ratio of γ and carbides invisible by LOM
the high carbon content of γ and a ratio of the measured and calculate contents between 2·1 and 3·3, which in part may be due to the EDX method
hard phases below the apparent matrix which may inhibit the indenter penetration and distort the measurement of HV0·05, fab and es.
This is less probable for 50∶50 because of the greater matrix volume. The initial matrix hardness of 50∶50 (s) is 324 HV0·05 (Table 3) and most likely stems from pure γ. This value is raised to a range of 720–940 HV0·05 in the cold worked wear surface after severe deformation by abrading Al2O3 220 mesh particles (Fig. 13b). A thin sample was taken from the wear surface by FIB and investigated by TEM. ϵ-Martensite is revealed in the microstructure of Fig. 14, which is typical of high manganese steel and points to a low stacking fault energy. It depends on the carbon and tungsten content as well (Table 3) and may be locally higher, also giving rise to twinning. The low initial strength of the matrix is raised considerably in the wear surface by ϵ-TRIP and a high density of dislocations. However, in the course of cold work strengthening, the WC carbides are not sufficiently supported by the matrix to prevent their deformation and fracture (see slip lines and cracks in Fig. 11a). This gives rise to a detachment of WC particles from the wear surface and to autogenous wear (Fig. 12).
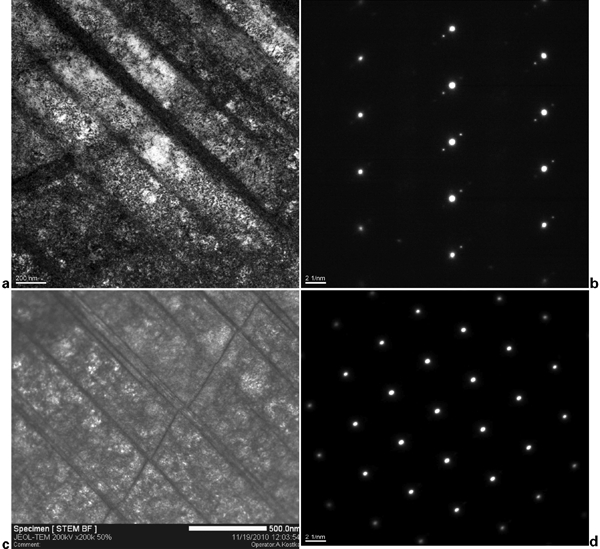
Microstructure of wear surface on 50∶50 (s) revealed by focused ion beam (FIB) TEM
Conclusions
The powder of tungsten carbide was mixed with the binder powder of iron alloyed with 22 mass-% manganese and sintered at 1300°C. The investigation of the constitution, microstructure and abrasive wear resistance of the materials 80∶20, 80∶20∶1 and 50∶50 (WC/binder/graphite in mass-%) led to the following conclusions.
As to the constitution, a good match was found between the Thermo-Calc program (database TCFE6) and SEM with EDX and EBSD. Solution annealing at 1050°C brought the system closer to equilibrium.
The high solubility of the Fe–Mn matrix for carbon lowered the concentration of this element in the WC, which softened and embrittled this phase.
The hot hardness of the materials was too low to think of cutting applications. Therefore, the resistance to abrasion was investigated at room temperature.
Owing to the high hardness and size of η-M6C carbides, a good wear resistance was achieved.
The deformed wear surface was cold workhardened considerably, and the occurrence of ϵ-TRIP in the matrix was confirmed by FIB-TEM.
Footnotes
Acknowledgements
This work was initiated by Professor Dr-Ing A. R. Kaysser-Pyzalla at the Max-Planck-Institute in Düsseldorf. The authors are grateful to Dr J. Garcia for his assistance.