
Abstract
The different crystallisation behaviours of Ti based metallic powders were systematically investigated. Governed by a higher transition temperature (a lower supercooling degree), the composition of the microsized precipitations (Sn and Ti rich) of cooling significantly varies from that of the glassy matrix (Cu and Zr rich). On the other hand, a kinetics limited condition (a lower transition temperature) results in nanocrystals and various compositional regions between small atoms (Ti, Ni and Cu) and large atoms (Sn and Zr) for the post-heating. The different crystallisation mechanisms are considered to be determined by the synergetic effect of thermodynamics (supercooling degree) and kinetics (transition temperature).
Introduction
Bulk metallic glasses (BMGs) are a class of advanced materials with potential structural and functional applications.1–3 For BMGs, understanding the crystallisation behaviours is not only of scientific importance but also of technological necessity. Scientifically, one can unveil the mechanism of crystalline phase nucleation and growth together with the underlying thermodynamics and kinetics. 4 Technologically, the understanding of crystallisation mechanisms enables the synthesis of novel materials with unique mechanical and/or functional properties through microstructural design and control, 5 such as exploring of glassy/nanocrystalline composites with enhanced plasticity. 6
In general, the crystallisation behaviours of supercooling metallic liquids can be investigated in two ways. One is to cool the molten alloy from a temperature above the liquidus temperature into the supercooling liquid region.7,8 The other is to post-heat the solid glassy sample until the crystallisation occurs.9,10 Although tremendous effects have been devoted on the crystallisation, most of them focus on the solid state glassy sample (using the post-heating crystallisation method).11–16 Few studies have been dedicated on the comparison of the different crystallisation characteristics during post-heating to those of cooling. Consequently, more insights into these areas are undoubtedly needed. 4
In this paper, we have investigated the microstructure evolution, the compositional fluctuation and the crystalline phase sizes of Ti based metallic powders during cooling and post-heating processes, which will help to better design and fabricate Ti based BMGs and their composites using the powder metallurgy method.
Experimental
Ti based metallic powders from commercial grade elements with a nominal composition of Ti42·5Cu40Zr7·5Ni5Sn5 (at-%) were fabricated by gas atomisation in an argon atmosphere. The powders were sieved into three size ranges using standard sieves: 0–38, 58–75 and 106–150 μm respectively. Metallic glassy powders with sizes <38 μm were chosen for post-heating treatments with a heating rate of 5°C min−1 (without holding) in a tube furnace under a high vacuum >10−3 Pa, and then the powders were naturally cooled to room temperature.
The structural and chemical characteristics of the powders were comprehensively investigated by X-ray diffraction (XRD; D/Max-RA diffractometer, operated at 40 kV and 60 mA with Cu Kα), scanning electron microscopy [JEOL JSM-6460 equipped with energy dispersive spectroscopy (EDS)] and transmission electron microscopy (TEM; FEI Tecnai F20 equipped with EDS). Owing to the difficulty in preparing thin foils of the high hardness and microsized metallic powders, the focused ion beam (xT Nova NanoLab 200 with a Ga ion beam) method was used to prepare the TEM samples. 17 Before ion beam milling, the metallic powders were mixed with pure Al powders, and then the mixed powders were pressed into a disc shape. Then, the disc was polished until the cross-sections of the powders appeared. Using an ion beam probe size as small as 10 nm, foil samples with thickness <100 nm, which are suitable for TEM analysis, can be milled from the metallic powders (as shown in Fig. 1a), and then the thin foils were lifted out and placed on carbon support films (see Fig. 1b).
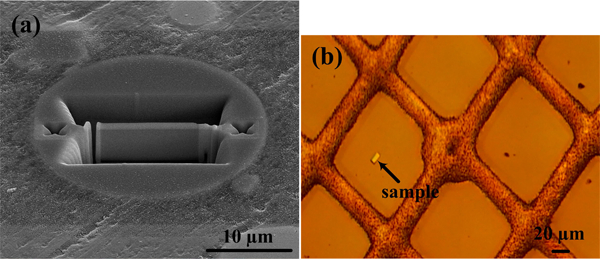
a secondary electron image showing TEM sample of metallic powders (polished cross-section) being milled by ion beam and b optical image of prepared thin foil after lift out (supported by Cu grid with carbon films)
Results and discussion
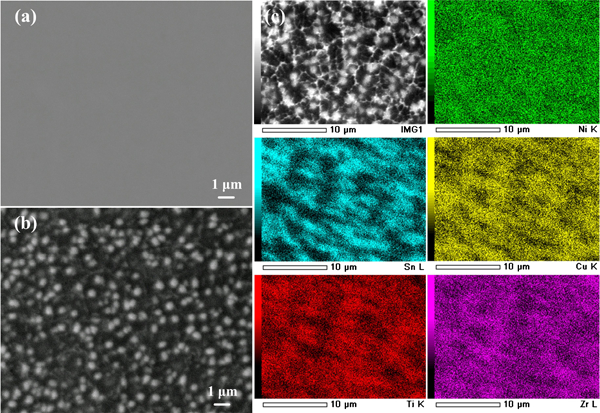
Figure 2a–c shows typical SEM back scattered electron (BSE) images of Ti based metallic powders with different sizes. In the small powders (⩽38 μm; Fig. 2a), no obvious crystalline feature is visible, suggesting a glassy nature. For the medium sized powders (58–75 μm), bright spot-like phases (referred to major phase) and network-like phases (referred to minor phase) distribute homogeneously in the relatively dark matrix (Fig. 2b). A similar contrast can be seen in the large powders (106–150 μm; Fig. 2c), except that the fraction of these bright phases becomes substantial. Based on our early experimental results, 18 the major phase, minor phase and dark matrix can be determined to be a face centred cubic (fcc) structured NiSnZr phase [powder diffraction file (PDF) no. 23-1281], a hexagonal structured Ti3Sn phase (PDF no. 06-0583) and the glassy matrix respectively. In particular, it should be noted that, with the increasing average sizes of powders from medium to large, the size of the minor phase increases moderately, while the size of the major phase increases considerably (from ∼350 to ∼1000 nm).
Images (SEM BSE) of gas atomised powders
To investigate the compositional fluctuations, elemental distribution maps for the large powders were obtained, as shown in Fig. 2c. Clearly, Ni is distributed uniformly across the entire region. Comparison of the BSE image and the elemental maps clearly shows that the major phase is rich in Sn and Ti, while the glassy matrix is rich in Cu and Zr. The EDS analysis of these regions reveals that the major phase has an average composition of Ti42Cu33Zr10Ni4Sn11 (at-%), compared with Ti41Cu44Zr7Ni6Sn2 (at-%), for the glassy matrix. These results indicate that, for a cooling crystallisation process, the composition of the crystals significantly differs from that of the glassy matrix. It is known that a positive mixing heat (a repulsive atomic interaction 19 ) exists between the Sn and Cu atoms. Consequently, a clear compositional variation can be seen between the Sn rich crystals and the Cu rich glassy matrix (Fig. 2c) due to the fast atomic diffusion of cooling crystallisation.
To study the crystallisation behaviour during post-heating, a series of post-heating temperatures (420, 450, 480, 500 and 600°C respectively) are selected. For convenience, we hereafter refer to the ‘powder T’ sample as the sample that was post-heated to a temperature of T (°C).
The XRD patterns of the as atomised and post-heated powders are shown in Fig. 3. For the as atomised powders, although occasionally very few crystal containing powders are encountered, most of the small powders should be purely glassy in this alloy system. For the powder-420 and the powder-450, no considerable differences of the XRD patterns were observed as compared with the as atomised powders, except for the appearance of weak peaks. However, the broad halo of the glassy phase splits into two broad peaks when increasing the post-heating temperature to 480°C. When post-heated to 500 and 600°C, sharp diffraction peaks and several broad overlapping peaks located at about 36–39° in 2θ value can be detected. These sharp diffraction peaks can be exclusively indexed as the fcc structured Ni2SnZr (PDF no. 23-1282) and the monoclinic structured TiNi0·8Cu0·2 (PDF no. 44-0113).
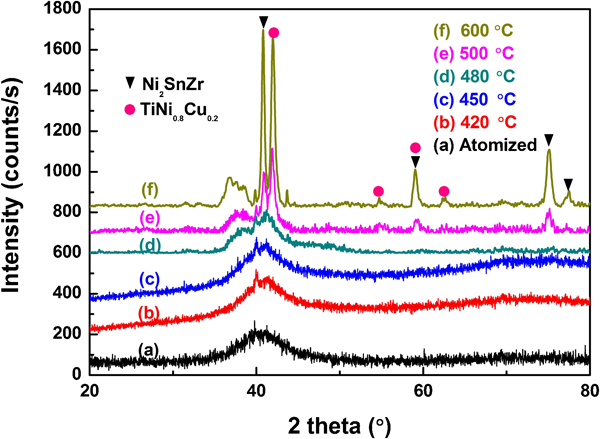
X-ray diffraction patterns of as atomised and post-heated powders
For better understanding the structural evolution, TEM observations were carried out. Figure 4 shows the dark field TEM images and the corresponding selected area electron diffraction (SAED) patterns of the post-heated powders. For powder-450, nanocrystals with an average size of 2–5 nm embedded in the glassy matrix can be seen (Fig. 4a). The bright diffraction spots and the diffuse ring pattern (inset of Fig. 4a) also indicate a coexistence of the glassy phase and the nanocrystals. When the post-heating temperature increases, one can see the precipitation of a large number of nanocrystals with sizes ranging from several nanometres to >10 nm (Fig. 4b). However, no evident diffuse ring in the SAED pattern can be seen, suggesting the disappearance of the glassy phase in powder-480. As evidenced by the XRD (Fig. 3), it is believed that the two broad diffraction peaks of powder-480 should be attributed to these nanocrystals. Interestingly, a semisharp diffraction ring can be seen in the SAED pattern, indicating that the sizes of some nanocrystals are small. In addition to the small dot-like precipitates (several nanometres), the sizes of some nanocrystals increase to ∼50 nm in powder-500 (Fig. 4c), causing the sharp diffraction peaks in the XRD pattern. Furthermore, the small dot-like nanocrystals are believed to generate the broad overlapping peak located at about 36–39° in the 2θ value, as well as the broad diffraction ring (inset of Fig. 4c). Several nanocrystals with a size of ∼100 nm can be found in powder-600 (Fig. 4d), while the size of the dot-like nanocrystals remains constant even after a post-heating treatment at this high temperature. Owing to the small sizes of the dot-like nanocrystals, it is difficult to determine their structures. However, similar phenomena were also observed in an isothermal crystallisation process of Ti45Ni20Cu25Sn5Zr5 glassy alloy. 16 Detailed indexing of the SAED patterns of powder-600 shows that the diffraction rings belong to the fcc Ni2SnZr structure and the monoclinic TiNi0·8Cu0·2 structure, further confirming the XRD results.
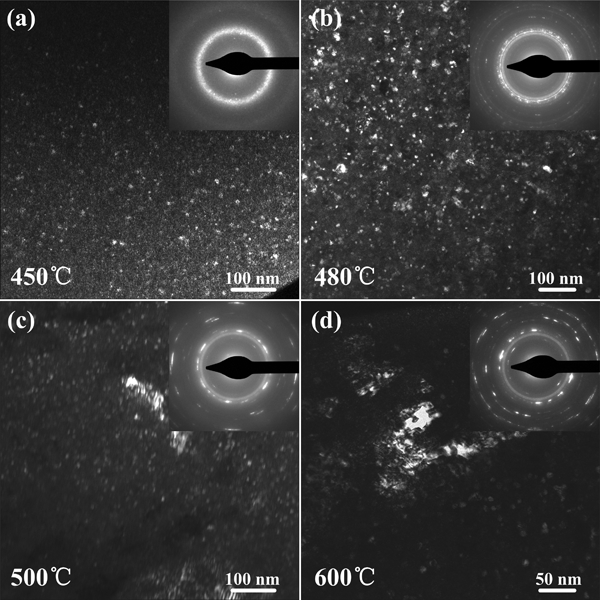
Transmission electron microscopy dark field images and corresponding SAED patterns for powders post-heated to a 450°C, b 480°C, c 500°C and d 600°C
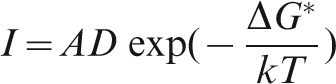
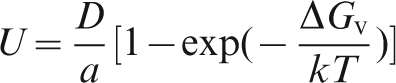
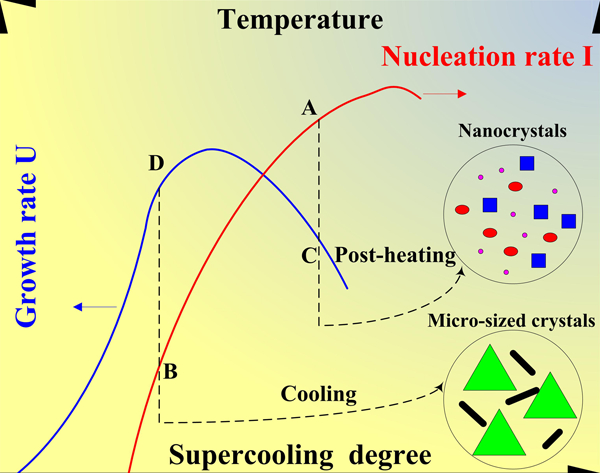
It should be noted that, in the cooling process of the alloy, a clear compositional variation occurs, as reflected in the powders with different sizes (see Fig. 2). In order to clarify the compositional evolution of the post-heating process, scanning TEM was performed. Figure 5a–c shows the high angle annular dark field images of the post-heated powders. The brighter areas on a length scale of several nanometres can be observed in powder-450 (Fig. 5a), suggesting that the compositional fluctuation accompanies the early stage of post-heating crystallisation. For powder-480, the size of the brighter areas further increases to several tens of nanometres (Fig. 5b). At higher temperature (Fig. 5c), these brighter areas with the length scale of several hundreds of nanometres are seen due to improved atomic mobility. Figure 5d presents the EDS results of the relatively brighter area (spot A) and darker area (spot B) in Fig. 5c. Very clearly, the brighter area is rich in Zr and Sn, while the darker area is rich in Ti, Ni and Cu, which also confirms that compositional fluctuation occurs in the post-heating crystallisation.
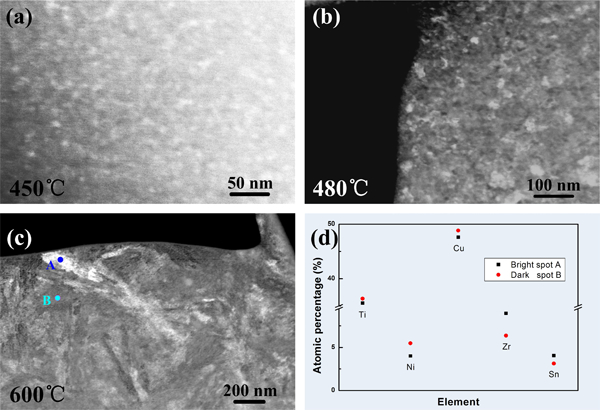
High angle annular dark field images of powders post-heated to a 450°C, b 480°C and c 600°C and d EDS result of powders post-heated to 600°C
It is known that the high angle annular dark field image is sensitive to the atomic number (Z contrast). Accordingly, the enrichment of Zr and Sn atoms with relatively higher atomic numbers would result in brighter contrast. This suggests that the various compositional regions during post-heating are formed between the small atoms (Ti, Ni and Cu) and the large atoms (Sn and Zr) due to their different diffusion abilities. 20 Furthermore, it can be concluded from the above results that during the crystallisation, nucleation, compositional fluctuation and crystal growth occur simultaneously.
Based on the experimental evidences outlined above, the crystallisation behaviours for the cooling and post-heating processes can be summarised as follows


On the other hand, the crystal growth rate U can also be described by
24
To understand the variation of crystalline phase size, a schematic illustration for nucleation rate and grain growth rate for the cooling and post-heating is shown in Fig. 6. From equation (1), it can also be concluded that the nucleation rate will reach a maximum at a temperature (Tmax) below Tm (melting temperature), 27 determined by the synergetic effect of the thermodynamics (ΔT) and the kinetics (T). The Tmax must occur above the Kauzmann temperature, and ΔTmax/Tm is ∼0·56 (ΔTmax = Tm−Tmax), 28 as shown in Fig. 6. Similarly, there should also exist a temperature Tmax at which the maximal grain growth rate can be achieved. 29 Moreover, it is noted that the maximum in the nucleation rate is at lower temperature (namely, higher ΔT) than the maximum in the grain growth rate (see Fig. 6).24,29
Schematic illustration for nucleation rate I and grain growth rate U of cooling and post-heating crystallisation
It is well documented that the crystallisation in cooling solidification typically occurs at a higher temperature (lower ΔT of ∼0·2 Tm). 30 Comparatively, the post-heating crystallisation usually takes place at a lower temperature (higher ΔT of ∼0·5 Tm). 23 These evident differences of thermodynamic and kinetic characteristics result in different nucleation and growth rates of the two crystallisation processes (Fig. 6). Consequently, nanocrystals can be formed in the post-heating process due to a higher nucleation rate and a lower grain growth rate. Comparatively, a relatively lower nucleation rate and a higher grain growth rate are responsible for the microsized crystals formed during the cooling and solidification of the powders.
Conclusions
The composition of the precipitations (Sn and Ti rich) in Ti based metallic powders considerably varies from that of the glassy matrix (Cu and Zr rich) for the cooling process due to atomic interaction and fast atomic diffusion. On the other hand, various compositional regions were observed between the small atoms (Ti, Ni and Cu) and the large atoms (Sn and Zr) during post-heating crystallisation as a result of the different mobilities of atoms.
The nanocrystals caused by post-heating result from a higher nucleation rate and a lower growth rate, which is determined by the higher supercooling degree and lower transition temperature. Comparatively, a lower nucleation rate and a higher growth rate lead to microsized crystals for the cooling induced crystallisation. The synergetic effect of thermodynamics and kinetics determines the different crystallisation characteristics for these two crystallisation processes.
Footnotes
Acknowledgements
This work was financially supported by the National Nature Science Foundation of China under grant nos.50904021, 51025415 and 10732010, and the Fundamental Research Funds for the Central Universities (grant nos. HIT NSRIF 2012005 and 2012001). We also acknowledge the technical, scientific and financial assistance from the Australian Microscopy and Microanalysis Research Facility.