
Abstract
Tungsten nitrides were synthesised from NiO–WO3 and NiWO4 precursors at 973–1273 K in a flow of H2–N2 gas mixture. The reduction–nitridation reactions were carried out isothermally in fluidised bed reactor, and the off-gas from the reactions was continuously analysed by gas chromatography. The effect of reaction temperature and precursor composition on the rate of formation of Ni–W nitrides was studied. The different phases developed during the reduction–nitridation reactions were identified by X-ray diffraction analysis technique. The morphology and the grain structure of the precursors were examined by SEM, and the elemental composition in the structure was analysed by electron dispersive spectrometry. The results showed that the reduction of Ni–W–O precursors proceeded in a stepwise manner (NiWO4→Ni–WO3→Ni–WO2→Ni–W). Tungsten nitrides (WN and WN2) were formed from the reaction of the freshly reduced W metal with N2 gas and WN was the predominant phase detected at higher temperatures. The reaction mechanisms were elucidated from the apparent activation energy values and the application of different formulations derived from the gas–solid reaction model at early and later stages of reactions. It was concluded that the interfacial chemical reaction is the rate determining step at initial stages, while a combined effect of gaseous diffusion and interfacial chemical reaction controlled the reaction at later stages. At final stages, the nitridation reactions contributed to the reaction mechanism leading to produce tungsten nitrides.
Introduction
Nickel–tungsten alloys are suitable materials for manufacturing cutting tools with regard to wear and mechanical durability. These alloys also exhibit enhanced properties, such as corrosion resistance, wear resistance and catalytic activity for H2, and accordingly, they are useful for many practical applications such as magnetic heads, bearings, magnetic relays, electrodes for hydrogen energetic, and electrode material accelerates hydrogen evolution from alkaline solutions.1,2 Small atoms, such as nitrogen, can be interstitially intercalated into the lattices of transition metals to produce a class of compounds with unique physical and chemical properties. The interstitial heteroatom intercalated alloys are called metal nitrides and have optimum electronic and magnetic properties resembling metals. Recently, transition metal nitrides have received increasing attention due their extreme hardness, high temperature stability, chemical inertness and good electrical and thermal conductivity. These properties make them industrially useful as cutting tools, structure materials, catalysts and electric devices.3–5 The most basic way to produce metal bonded (iron, cobalt, nickel, silver, etc.) tungsten nitride is by milling metallic precursors in the presence of nitrogen gas, in which milling is a crucial part of production. 6 Efforts were made to improve the production process shorter to be cost effective and more environmentally friendly.
The application of the fluidisation technique in chemical engineering processes is of great importance because it has many advantages that provide good solid/gas mixing, non-agglomeration of solid particles, high heat and mass transfer and large contact surface area.7–9 The minimum fluidisation velocity is one of the most important fundamental parameters in the analysis and design of fluidised beds, which is determined from the sharp change in the pressure drop over the fixed bed region compared with that of the fluidised region.10,11 A series of studies have been carried out to investigate the hydrogen reduction in a number of transition tungstate in view of the high technology application of tungsten alloyed with transition metal. These include NiWO4, 12 MnWO4, 13 FeWO4, 14 ZnWO4 15 and CoWO4. 16 Some investigators reported that the reaction of NiWO4 with hydrogen proceeds in two steps in which the reduction of NiWO4 into Ni and WO2 takes place first followed by reduction of WO2 to metallic tungsten. 12
The present investigation is focused on applying the fluidised bed technique for the low temperature synthesis of Ni–W nitrides from Ni–W–O precursors. The reduction–nitridation reactions were carried out isothermally at 973–1273 K in a flow of 50%H2+50%N2 gas mixture. The structure of the reaction products was physically and chemically characterised and correlated with the reaction kinetics in order to predict the corresponding mechanism.
Experimental
Materials
Two Ni–W–O precursors having different composition of Ni and W were used for the synthesis of Ni–W nitrides.
WO3–NiO precursor: this precursor was prepared from the mixing of 10·79 wt-%NiO with 89·21 wt-%WO3. Nickel(II) oxide (99% NiO, Sigma-Aldrich Co.) was heated up to 1273 K in argon atmosphere and kept at this temperature for 1 h, and then cooled down to room temperature. Tungsten(VI) oxide (99·9%WO3, Atlantic Equipment Engineers, AEE, Bergenfield, NJ, USA) was heated up to 423 K and kept constant for 24 h before cooling to room temperature. The WO3–NiO precursor was prepared by the thorough mixing of NiO and WO3 powders in a predetermined proportion using a mechanical agate mortar. The oxide mixture was then pressed into compacts (diameter = 10 mm, height = 5 mm) using a hydraulic press at a constant pressure of 30 kPa. The prepared compacts were heated up to 873 K for 24 h in an alumina crucible. The furnace temperature was then raised to 1273 K (10 K min−1) and kept constant for 72 h in a flow of purified Ar gas. The sintered compacts were then cooled down (10 K min−1) to room temperature. Under such conditions, the sintered compacts were easily removed and were then crushed, and the particle size of 0·2±0·1 mm was collected for the subsequent reduction–nitridation reactions in the fluidised bed reactor.
NiWO4 precursor: the powder precursors (≥99% purity) supplied from Johnson Matthey Inc. (London, UK) were pressed into compacts (diameter = 10 mm, height = 5 mm). The dry compacts was sintered at 1273 K for 72 h in a flow of Ar gas and then cooled down to room temperature. The sintered compacts were also crushed, and the particle size of 0·2±0·1 mm was collected.
Figure 1 shows the isothermal phase diagram of Ni–W–O computed at 1273 K by Thermo Calc (Calphad, Chicago, IL, USA) where the prepared NiO–WO3 and NiWO4 precursors are indicated. The different phases developed during sintering of the precursors were identified by X-ray diffraction technique (XRD, Siemens D5000 X-ray diffractometer). The morphology of the sintered precursor powders as well as the reacted samples at different temperatures was examined with a scanning electron microscope (JOEL JSM-840 SEM, Electron Optics Ltd, Tokyo, Japan). Electron dispersive spectrometer (EDS) attached to SEM was used for the analysis of Ni and W in the structures. O2 free argon gas was used as an inert gas during heating and cooling of the precursors. Purified H2 and N2 gases (SR grade, Scientific, OTC-50) were used for the reduction and nitridation reactions of precursors respectively.
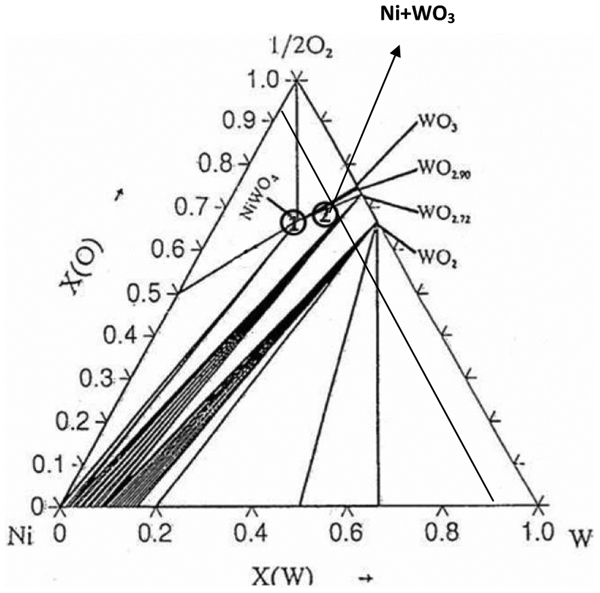
Ni–W–O isothermal phase diagram computed at 1273 K by Thermo Calc Programme (Calphad, Chicago, IL, USA)
Experimental technique and procedure
The schematic diagram showing the gas purification and the fluidised bed reactor (fabricated by Webelco, Spånga, Sweden) is shown in Fig. 2. The reactor (2) consists of a quartz tube (inner diameter = 15 mm, outer diameter = 18 mm and height = 1000 mm) in which a porous quartz disc (3) is fused in the middle of its length. The average pore diameter of the quartz disc is ∼100 μm. The reaction tube was fitted inside a vertical tube furnace (1) with KanthalA-1 heating element, which has a constant temperature zone of ∼100 mm. The reactor was mounted in such a way that the porous disc was positioned at a level of ∼20 mm below the centre of the temperature zone of the furnace. The temperature of the fluidised bed was continuously monitored by a K type thermocouple (6). H2, N2 and Ar gases were purified from moisture and other contaminations using suitable gas purification steps. 1 Precalibrated rotameters were used to measure the flowrates of the gases through the bed. The off-gases from reduction reactions of precursors was flowed through a stainless steel tube (inner diameter = 5 mm), to the gas chromatograph (GC) (model GC 2014 with TCD detector, Shimadzu Corp., Kyoto, Japan) for monitoring the analysis of gases. Hydrogen was employed as a carrier gas (8), while argon was used as injector. The whole off-gas line was wrapped up with heating tape to prevent the condensation of H2O in its path to GC.
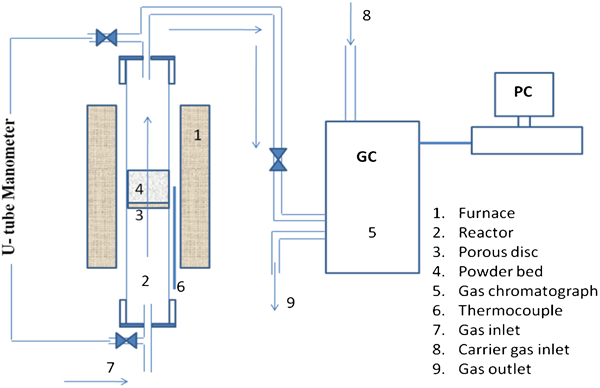
Schematic diagram of fluidised bed reactor connected to GC for off-gas analysis
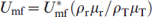
Minimum fluidisation velocity Umf was determined experimentally by measuring the pressure drop through the powder bed. The total pressure drop in the reactor with and without the powder bed sample was measured independently. The gas velocity was adjusted at high flowrate and then decreased incrementally to a rate that was significantly low. At each increment of flowrate the pressure drop across the bed was measured using a U tube manometer. The net pressure drop was taken as a difference between the two pressure drops [Pd(with powder bed)−Pd (reactor)]. A typical graph plotting the pressure drop ΔP across the bed against the gas velocity is shown in Fig. 3. The Umf was determined from the abrupt change in the pressure drop lines. The prediction of Umf at high temperatures was based on fluid dynamic models extrapolated from the experimental values produced at room temperature
 . It is well known that with the increase in temperature, both density and viscosity of the fluidising gas will change. The value of Umf can be calculated at higher temperatures on applying the following equation
17
. It is well known that with the increase in temperature, both density and viscosity of the fluidising gas will change. The value of Umf can be calculated at higher temperatures on applying the following equation
17
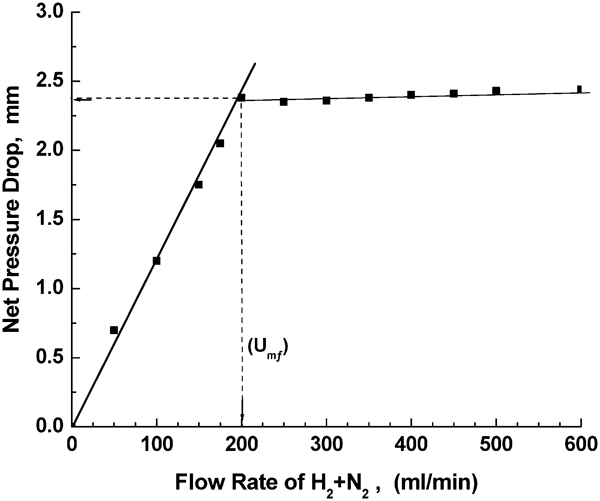
Variation between net pressure drop ΔP and gas flowrate for determination of minimum fluidisation gas velocity Umf
The fluidised bed experiments were conducted isothermally at 973–1273 K. At a given temperature, the powder sample was allowed to rest on the porous disc in the reactor tube, which was positioned in the furnace. The sample was heated up to the desired temperature in a flow of purified Ar gas and kept constant for a while, then Ar gas was replaced by H2–N2 gas mixture. The water vapour in the off-gas resulting from the reduction of precursor was continuously monitored by the GC in the form of peaks. At the end of the experiment, where no more H2O was detected in the off-gas, the H2–N2 gas mixture was replaced by Ar gas, and the sample was left to cool down. The reacted samples were kept away in a desiccator for the subsequent tests.
Results and discussion
Characterisation of materials
The NiO–WO3 and NiWO4 precursors were chemically and physically characterised. The typical XRD chart for the sintered powders of the NiO–WO3 precursor is given in Fig. 4, in which nickel tungstate (NiWO4) and tungsten VI oxide (WO3) were identified. The NiWO4 phase (∼44·29%) in this precursor is produced from the solid state reaction between NiO and WO3 (NiO+WO3 = NiWO4) in a molar ratio of 1∶3·1 respectively. The presence of WO3 peaks is attributed to the excess amount of WO3 (55·71%) added in this precursor. The SEM image showing the grain structure formed in the sintered NiO–WO3 precursor is shown in Fig. 5. The formation of two different structures can be seen; semispherical aggregates (Fig. 5a) that contain of large numbers of micrograins and elongated platelets (Fig. 5b). The EDS point analyses of micrograins in the aggregates show that it is composed of 60·90 at-%W with 18·87 at-%Ni, and the balance is calculated as the O2 contents. The elemental analysis indicated that the composition of micrograins is relevant to NiWO4. The analysis of the elongated platelets showed that it contains 78·31 at-%W, and the balance is the O2 content, which corresponds to WO3. The SEM image showing the grain structure developed in NiWO4 precursor is depicted in Fig. 6. It shows clearly the formation of porous structure in which large numbers of macropores are observed between aggregates and micropores inside aggregates. The EDS analysis of Ni and W (at-%) indicates that this structure is in agreement with the chemical composition of NiWO4.
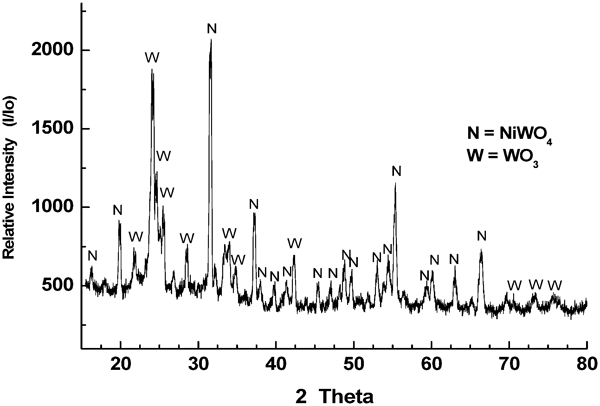
Typical XRD patterns of prepared NiO–WO3 precursor
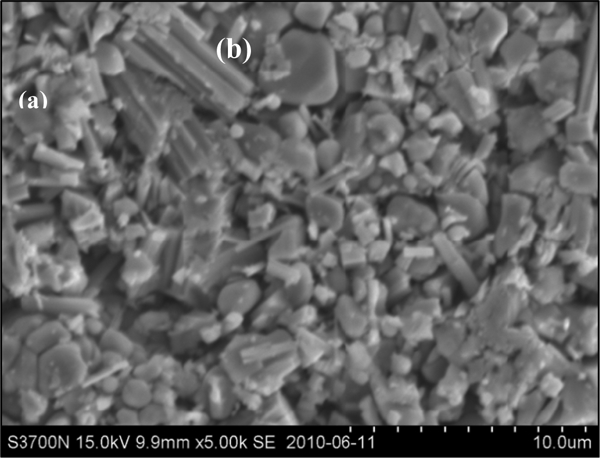
Image (SEM) of (NiO–WO3) precursor and EDS elemental analysis in grains in structures (at-%)
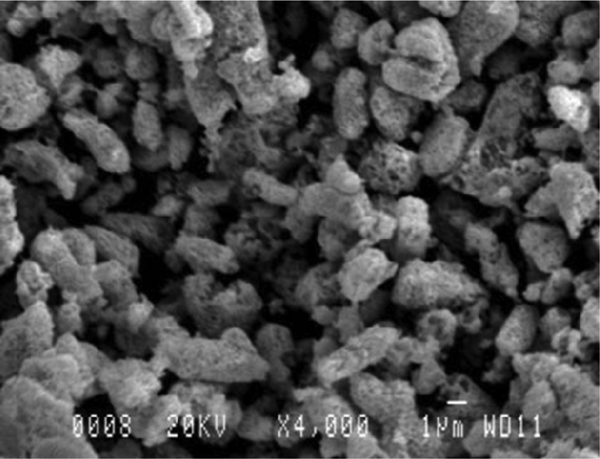
Image (SEM) of NiWO4precursor and elemental analysis of grains in structure (at-%) (60·32%W+18·73%Ni)
Reduction–nitridation reactions
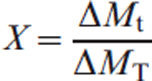
The reduction–nitridation reactions of NiO–WO3 and NiWO4 powders (0·2±0·1 mm) were carried out isothermally at 973–1273 K in a flow of 50%H2+50%N2 gas mixture using a fluidised bed reactor. In these experiments, H2 gas was the reducing agent, while N2 in the gas mixture was applied for the nitridation reactions. The dimensionless mass change at a given time t can be calculated from the ratio of the mass loss ΔMt measured at a given time ‘t’ to the theoretical value of the total mass loss ΔMT
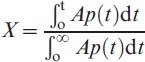
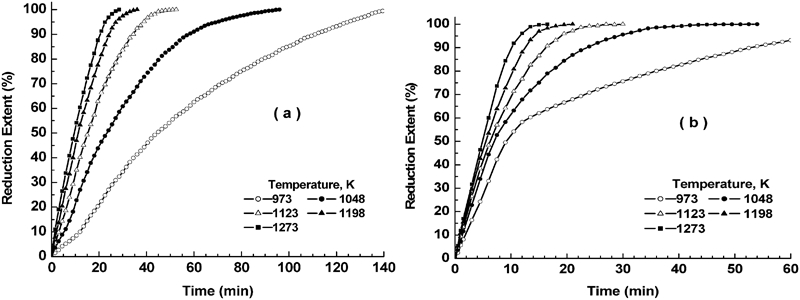
The variation between the degree of reduction X and the corresponding reduction time t at 973–1273 K for NiO–WO3 and NiWO4 precursors is represented in Fig. 7a and b respectively. The isothermal reduction curves obtained shows that for a given precursor composition, the rate of reduction increases with increase in temperature. For NiO–WO3 precursor, the time required to achieve ∼80% reduction extent was 87 min at 973 K compared to 17·5 min at 1273 K. On the other hand, for NiWO4 precursor (Fig. 7b), the time required for achieving the same extent of reduction was 37 and 8·5 min at 973 and 1273 K respectively. This indicates that the reduction rate of NiO–WO3 is much lower than that for NiWO4 precursors, which is attributed to the presence of excess amount hardly reducible WO2 (resulted from the step reduction of WO3) in the former precursor. Unlike in the reduction of NiO–WO3 precursor, the reduction of NiWO4 precursor at 973 K shows the presence of a break point at ∼60% extent, beyond which the reduction rate decreased until the end of reduction process. The difference in the rate of reduction before and after the break point decreased with rise in temperature showing no measurable change at >1123 K. For NiO–WO3 precursor (Fig. 7a), the break point is detected at the early reduction stages (about 10–15% extent), which is more pronounced at lower temperatures. In order to clarify the effect of temperature on the reduction rate of these precursors more clearly, the variation between the extent of reduction (%) and the corresponding reduction time t (min) at 973 and 1273 K is depicted in Fig. 8a and b respectively. The results indicate that the rate of reduction of NiO–WO3 precursor is much lower than that for NiWO4 precursor, and the difference between the rates decreases with rise of temperature due to the presence of hardly reducible WO2 (55·71 mol.-%WO3).
Influence of temperature on isothermal reaction behaviour of Ni–W–O precursors in 50%H2–N2 gas mixture
Influence of precursor composition on isothermal reaction behaviour in 50%H2–N2 gas mixture at a 973 K and b 1273 K
In previous studies,18,19 sintered compacts made from of NiO–WO3 and NiWO4 precursors having similar composition, as used in the present study, were isothermally reduced and carburised in H2–CH4 gas mixtures at 973–1273 K for the synthesis of N–W carbides. The authors explained that reactions took place in two consecutive steps:
the first step is concerning with the reduction of NiO–WO3 in H2 gas stepwisely to produce N–W intermetallics (NiWO4→NiWO3→NiWO2→N–W)
the second step deals with the carburisation of Ni–W in CH4 to produce Ni–W carbides.
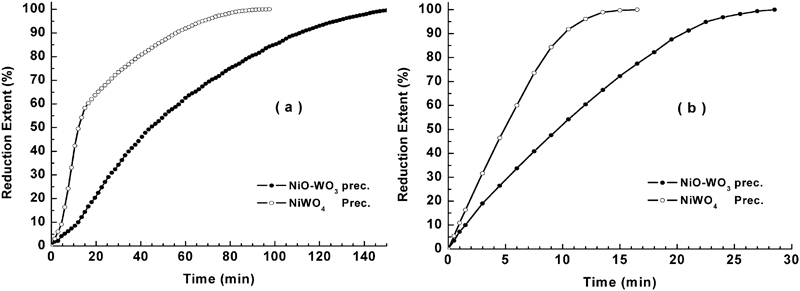
In the present investigation, NiO–WO3 and NiWO4 precursors having the same composition were isothermally reacted in H2–N2 gas mixture at 973–1273 K, and the XRD phase analysis indicates the formation of Ni–W nitrides at all temperatures applied. Similarly, it can expected that these precursors were first reduced in H2 gas to produce Ni–W intermetallics followed by the nitridation reaction of the reduced product. Table 1 shows the different phases identified at 973–1273 K, while Figs. 9 and 10 shows the XRD typical charts of reacted NiO–WO3 and NiWO4 precursors at low and high temperatures (973 and 1237 K) respectively. Figure 9a shows the presence of WO2 phase in NiO–WO3 precursor as a main phase formed at ≥1048 K together with W, Ni, WN2 and WN. This phase resulted from the stepwise reduction of WO3, which account to 55·7 mol.-% in NiO–WO3 precursor. With further rise in temperature, the WO2 phase is subsequently reduced to W metal, which is then reacted with N2 gas to produce tungsten nitrides (WN and WN2) as indicated in Fig. 9b. The reduction and nitridation reactions of precursors can be explained as follows:
Typical XRD patterns for (NiO+WO3) precursor reacted in 50%H2–N2 gas mixture at a 973 K and b 1273 K
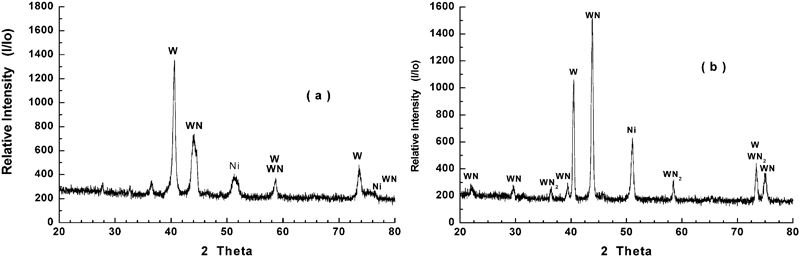
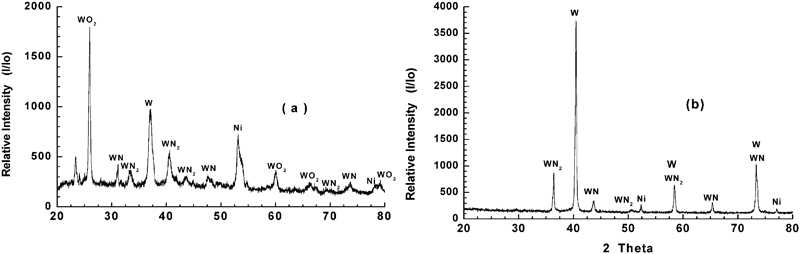
Typical XRD patterns for NiWO4 precursor reacted in 50%H2–N2 gas mixture at a 973 K and b 1273 K
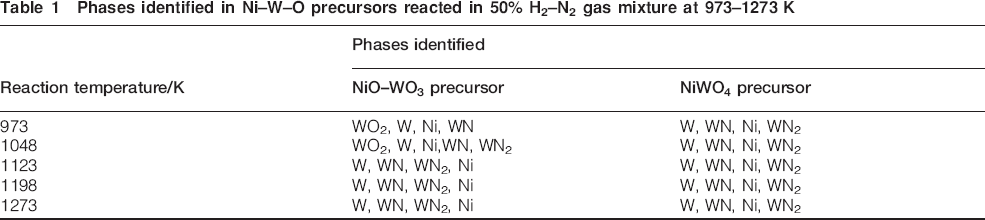
Phases identified in Ni–W–O precursors reacted in 50% H2–N2 gas mixture at 973–1273 K
reduction reactions of Ni–W–O mixed oxides to intermetallics
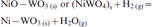


nitridation reaction of the freshly reduced Ni–W intermetallics to nitrides

Table 1 shows the different phases identified in the reacted precursors at 973–1273 K. The presence of W metal in the reaction products resulted from the incomplete time of nitridation reaction. The reduction–nitridation reactions of NiWO4 precursor proceed faster than that of NiO–WO3 as previously discussed, and tungsten nitrides are formed even at relatively lower temperatures as shown in Fig. 10a. The extent of formation of WN, as the main reaction product at ≥1198 K, increases with rise in temperature. The higher the reaction temperature, the higher is the rate of formation of WN in the reaction products. Further, a higher degree of crystallinity was developed as indicated from the sharpening of WN peak at high temperatures. It is worth mentioning that, with an increase in the reaction time, the amount of WN formed increases and it becomes the predominant phase in NiWO4 precursor.
To investigate the effect of temperature on the particle size and crystal structure of the products, the morphology of samples were examined with SEM, and the constituents were analysed by EDS. The SEM images given in Fig. 11 show the presence of light and dark phases (distinguished by difference in colour intensity). The EDS analysis shows that the light phase is rich in tungsten, while the dark phase is rich in nickel. The reaction products of NiWO4 precursor at 973–1273 K showed that the presence of agglomerates of small particles almost has spherical shape. The size of the smallest particles of NiWO4 precursor formed at 1273 K is ∼0·5 μm, whereas the agglomerate size of the same sample is ∼4·0 μm in diameter. Furthermore, the images show that the average particle size increases with an increase in reaction temperature due to the sintering effect. The same behaviour was also observed in the reaction products of NiO–WO3 precursor, which have higher content of tungsten metal.
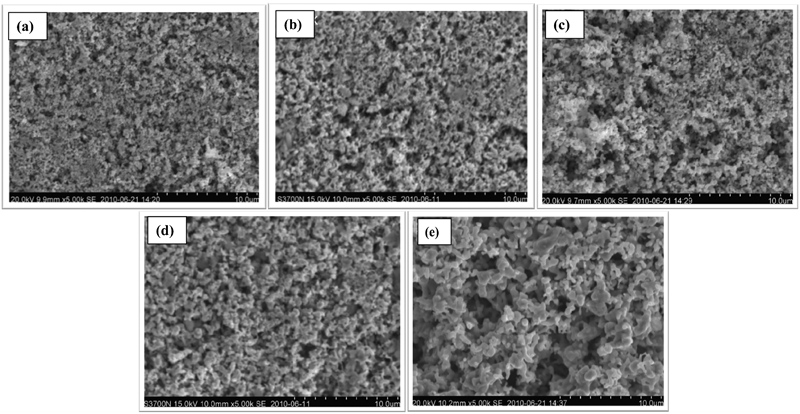
Images (SEM) for NiO–WO3 precursor reacted in 50%H2–N2 gas mixture at 973–1273 K
Kinetics and mechanism of reactions
The isothermal reduction curves given in Fig. 7 showed a discontinuity in the behaviour and the presence of break point at different fractional reduction extents depending on the precursor composition. The measured rate of reduction before and beyond the break point indicates a change in the reaction mechanism. This point is more pronounced at lower reaction temperatures for NiWO4, which would correspond to the reduction of NiWO4 to Ni and WO3 then to WO2. Beyond the break point, WO2 is further reduced to W metal. In NiO–WO3 precursor, W is main reaction product due to its abundance in this precursor (55·71 mol.-%WO3). The reduction of NiO to Ni and WO3 to WO2 occurred simultaneously in the reduction of NiWO4. It can be concluded that the reduction begins with the breakdown of the Ni–O bond as the first stage and formation of Ni metal. This stage is followed by the reduction of WO3 to WO2 then to W metal. The nitridation reactions started up as soon as the reduction completed, and tungsten nitrides were produced. The rate of formation of nitrides increases with the increase in time and temperature.
In order to predict the rate controlling mechanism in the reduction of Ni–W–O precursors, the values of apparent activation energy Ea are calculated from the application Arrhenius equation. 16 Based on reduction curves shown in Fig. 7, the variation between the rate of reduction (log dr/dt) at early stages (3–6% extents) and at later stages (83–86% extents) of reduction and the corresponding reciprocal of absolute temperature (1/T K) are given in Fig. 12a and b for NiO–WO3 and NiWO4 precursors respectively. The computed values of Ea are given in Table 2. The Ea values obtained indicated that the reduction of precursors at the initial stages is most likely controlled by a combined effect of interfacial chemical reaction and gaseous diffusion mechanism. At later stages, the interfacial chemical reaction seems to be the rate determining step. The higher values of Ea at both initial and later stages for NiO–WO3 than NiWO4 precursor could have resulted from the presence of an excess amount of hardly reducible WO3 in the former precursor. The calculated values of Ea were found to be different than those obtained earlier under similar reduction conditions for the same precursor composition.15,16 The discrepancy in Ea values indicates that N2 in the applied gas mixture (50%H2+N2) has a measurable effect in the reaction mechanism.
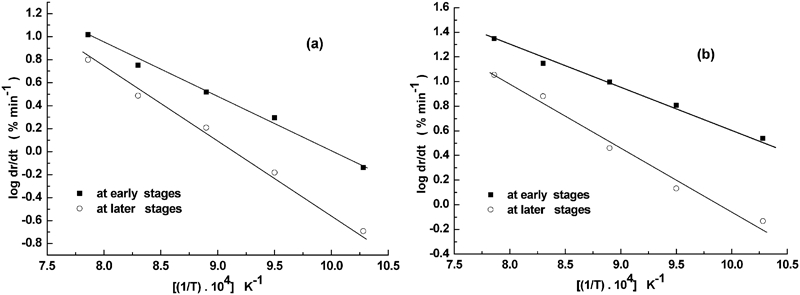
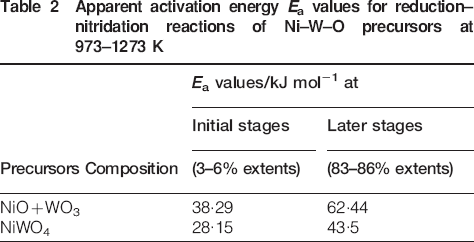
Arrhenius plots for Ni–W–O precursors reacted in 50%H2–N2 gas mixture at early (3–8% extents) and later reaction stages (82–88% extents)
Apparent activation energy Ea values for reduction–nitridation reactions of Ni–W–O precursors at 973–1273 K
On the other hand, the mathematical models that are usually adopted to predict the rate controlling step in heterogeneous gas–solid reactions are applied to elucidate the reduction mechanism. It was found that under similar reaction conditions, the grain model developed by Szekely et al. 20 is the most reliable and applicable model. The mathematical formulations for gaseous diffusion, interfacial chemical reaction and mixed control reactions were derived elsewhere21,22 as follows:
for gaseous diffusion

for chemical reaction
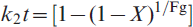
for mixed control reaction

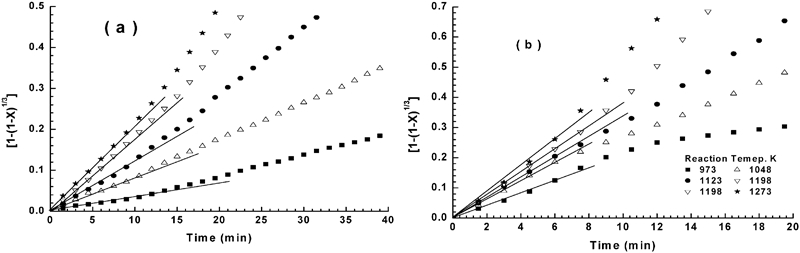
Testing of interfacial chemical reaction equation on reduction–nitridation reactions at 973–1273 K for a NiO–WO3 precursor and b NiWO4 precursor
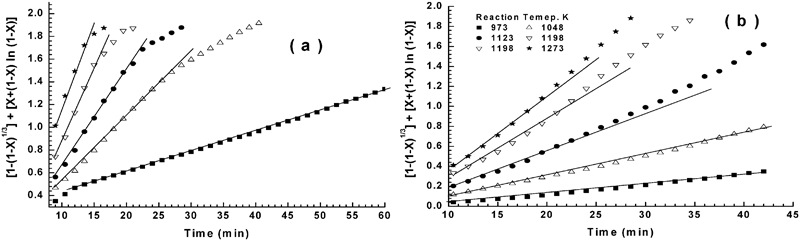
Testing of mixed control reaction equation on reduction–nitridation reactions at 973–1273 K for a NiO–WO3 precursor and b NiWO4 precursor
In the present study, at the early stages of reduction all particles in the powder bed had equal access to hydrogen gas, leading to eliminating the gas boundary layer effect and consequently minimising the contribution of gas diffusion effect. Accordingly, it is logical to assume that the reduction reaction at their early stages is most likely controlled by the interfacial chemical reaction mechanism. This is in agreement with that concluded from the application of gas–solid reaction model. While, on the other hand, the mixed control reaction mechanism, which was predicted from the values of Ea, is not reasonable at this reduction stage. With progress in reduction process, the WO3 is reduced to WO2, then further reduced to W metal (equations (4) and (5)) and NiWO4 is also reduced to Ni and W. Thus, the reduction mechanism at later stages could be controlled by a combined effect of gaseous diffusion and interfacial chemical reaction mechanism, which is also in agreement with that estimated from the application of the grain model. At this reaction stages and unlike that predicted from grain model, the values of Ea indicated that the reduction reaction is controlled only by the interfacial chemical reaction mechanism.
Accordingly, it can be concluded that the prediction of reaction mechanism based merely on the magnitude of the apparent activation energy values Ea cannot be considered conclusive but rather indicative. Thus, it is reasonable to predict the reduction mechanism from the correlation between the reduction kinetics and the microscopic structure of the reaction products at the different reaction stages.21,22
Conclusions
NiO–WO3 and NiWO4 were isothermally reacted in 50%H2/N2 gas mixture at 973–1273 K in fluidised bed reactor. The course of reduction at a given time was calculated from the analysis of the H2O in off-gases. For each particular precursor, the reduction rate increased with rise in temperature. The reduction behaviour of NiWO4 precursor showed the presence of break point at <60% extents as a result of the stepwise reduction of Ni–W–O to Ni–WO3, then to Ni–WO2 and finally to Ni–W intermetallics. Tungsten nitrides (WN and WN2) were formed from the reaction of Ni–W with N2 gas. The SEM images proved that higher reaction temperature resulted in the formation of bigger grain size. The computed Ea values for NiO–WO3 and NiWO4 precursors were 38·29 and 28·15 kJ mol−1 at early stages, while at later stages, the Ea values were 62·44 and 43·5 kJ mol−1 respectively. The lower Ea values for NiWO4 than NiO–WO3 were attributed to the presence the hardly reducible WO3 in the latter precursor. The mechanisms of reduction–nitridation reactions were predicted from the calculation of Ea values and the application of different formulations derived from the grain model. It was concluded that the reduction of precursors is controlled by the interfacial chemical reaction mechanism at early stages, whereas the gaseous diffusion is contributed with interfacial chemical reaction at the later stages. At final stages, the nitridation reactions had a considerable influence on the reaction mechanism.