
Abstract
This paper aims to give an insight into the reliability of fatigue life assessment results for powder metallurgy (PM) components subjected to variable amplitude loading. In this study, notched specimens of two PM steel and two PM aluminium alloys are examined. As the experimental basis, constant amplitude tests with different stress amplitudes and stress ratios (to determine the S–N curves and mean stress sensitivities) as well as service load tests (variable amplitude loading) were carried out. The fatigue life was calculated, applying different modifications of the linear damage accumulation. The results of the experiments and calculations were compared and statistically evaluated. Regarding the resulting scatter, the fatigue life assessment with the modified damage accumulation by Zenner and Liu is recommended. Furthermore, mean relative damage sums are derived, which can be used to correct the fatigue life calculation. For PM steel, these values are very similar to compact steels, whereas they are higher for PM aluminium.
Keywords
List of symbols
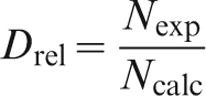
damage
relative damage sum

mean relative damage sum
load amplitude
irregularity factor of a load sequence
exponent of the S–N curve
modified exponent of S–N curve for damage accumulation
stress concentration factor
parameter for the modified Miner's rule
mean stress sensitivity
number of equal amplitude in amplitude sequence
number of load cycles until failure
calculated fatigue life
corrected calculated fatigue life (relative Miner's rule)
corresponding load cycle number at endurance limit
fatigue life from experiment
probability of occurrence/confidence
stress ratio
scatter range of relative damage sums
stress amplitude
material's endurance limit (alternating stress amplitude)
component endurance limit (alternating stress amplitude)
mean stress of a load cycle
relative stress gradient
Introduction
Many components in mechanical engineering are subjected to loads with variable stress levels. Typical Gaussian distributed service load sequences include many small load changes and comparatively few large ones. Thus, when designing components for infinite life, the largest resulting stress amplitude has to yield the endurance limit. (In this paper, the term endurance limit is used to describe the knee point of the S–N curve marking the transition from high cycle fatigue to very high cycle fatigue/endurance limit, regardless of a possible further decrease of the fatigue strength.) This inevitably leads to overdimensioned components and runs counter to the ever increasing demand for lightweight design. Using a damage accumulation hypothesis, the finite lifetime of a component subjected to variable loads can be estimated. Thus, components can be designed for a required lifetime (based on a specific load spectrum) rather than for infinite life. A maximum load, which rarely occurs, could than exceed the endurance limit considerably.
The process of damage from the first load to crack initiation until final rupture is still not fully understood and varies for different materials. Damage accumulation theories simplify that process and are subject to errors. For reliable fatigue design, the knowledge of the magnitude of these errors as well of the resulting scatter is essential.
Some aspects of fatigue strength assessment of sintered steels
The fatigue strength of powder metallurgy (PM) steels is to a great extent dependent on the chemical composition, density and pore morphology. 1 For instance, an increase in density of ∼15% from 6·5 to 7·5 g cm−3 can double the material's endurance limit 2 and, thus, also shift the S–N curve to higher stress levels. Additionally, PM steels show a lower sensitivity to notches than comparable compact steels. 3
The course of the S–N curves beyond the knee point, which indicates the conventional endurance limit, has not been fully studied yet. Based on experiments with unnotched specimens of the PM steel Fe–4.ONi–1·5Cu.0·5Mo+0·5C, Sonsino suggests a modified exponent of k = 50 for the S–N curve after the knee point. 4 This leads to a further decrease in the fatigue strength by ∼5% per load cycle decade beyond the knee point. On the other hand, recent research projects 5 indicate that for low strength steels and parts with sharp notches, a distinct endurance limit exists. Although these results do not include PM materials, it seems likely that this is also the case for notched PM parts.
To assess multiaxial stress states, which are typical in notches, a suitable equivalent stress hypothesis must be applied. Sonsino investigated the behaviour of sintered steels under multiaxial loading. A fractographical study of the different damage stages of crack initiation, crack propagation and final rupture was carried out. According to Sonsino, 6 the principal stress hypothesis can be used for the fatigue life assessment, as is typical for brittle materials. The study was carried out with material densities of 7·1 and 7·4 g cm−3, and the results may be adopted for lower densities as well. For sintered steels that exhibit a higher ductility due to a higher density or a certain manufacturing process, the von Mises equivalent stress should be used.
Besides the stress based (linear elastic) approach for the fatigue life assessment under variable amplitude loading, there is also the strain based approach (local strain approach). It is based on the elastic–plastic strain course in the notch root. 7 The component's S–N curve (which is in fact a P–N curve, with P being a damage parameter) is calculated from the material's fatigue behaviour (ϵ–N curve) and the material's cyclic deformation behaviour (σ–ϵ curve). These are taken from experiments with plain specimens. One fundamental hypothesis is the homogeneity of the material. This is not the case for porous PM materials. Owing to the pores, PM metals exhibit macroscopically brittle deformation behaviour, even though the basis alloy may be more ductile. The cyclic material parameters from plain specimens thus cannot represent this behaviour, as a plain PM specimen is in principle a component with inner notches. Thus, for PM parts, only the stress based approach is typically used. 8
The state-of-the-art for the assessment of the fatigue strength of sintered steels is summarised in Refs. 2 and 8 and the German standard DIN 30912. 9
Stress based fatigue life assessment
The stress based fatigue life assessment generally includes the following steps:
provision of the S–N curve of the component to be dimensioned
application of a cycle counting method to transform a load–time history into a cumulative frequency distribution of amplitudes (amplitude spectrum)
transformation of the amplitudes with different mean stresses into damage equivalent amplitudes with the same stress ratio as the component's S–N curve (e.g. alternating stress)
damage accumulation
correction of the calculated fatigue life based on experience gained with similar components.
Some details on the different steps will be outlined below. The fatigue strength of a component subjected to constant amplitude loading is characterised by its S–N curve. It is determined by a set of constant amplitude fatigue tests at different stress levels and linear regression of the logarithmic values (S,N). Using an S–N curve obtained from experiments for the fatigue life assessment is usually referred to as the nominal stress concept even though it is not limited to components where a nominal stress can be defined. If no experimental data are available, the S–N curve can be estimated according to fatigue design codes such as in Refs. 10–12. The S–N curve can be expressed conveniently in the following form
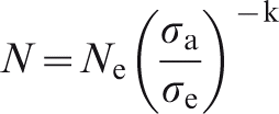
Thus, it includes the information on the magnitude of the endurance limit and the corresponding load cycle number.
The purpose of a cycle counting method is to determine what constitutes a cycle and the corresponding amplitude. Common examples are level crossing counting, range pair counting and rainflow counting. 13 The counting method itself can have a significant influence on the calculated fatigue life. This comes into effect especially if the load–time history includes many small intermediate ranges or a distinct fluctuation of the mean value. 14 By comparing many fatigue lives obtained each from experiment and from calculation in Eulitz and Kotte, 15 it was concluded that, for best results, rainflow counting should be preferred. For all fatigue life calculations in this paper, the rainflow counting algorithm according to Clormann and Seger 16 is used.
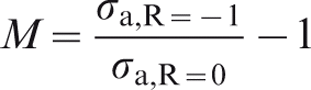
Several empirical models have been proposed to consider the damaging effect of mean stresses overlaying the stress amplitudes. Schütz defined the mean stress sensitivity M,
17
which is the negative value of the slope of the line in the Haigh diagram
With this parameter, the damage equivalent stress amplitude with zero mean stress (R = −1) can be calculated as follows

A frequency distribution of amplitudes transformed in this way can be used for the actual damage calculation using a specific S–N curve. Therefore, many different approaches exist. 18 However, the oldest approach, the linear damage accumulation proposed by Palmgren 19 and Miner, 20 is still most commonly used. Besides its simple applicability, it does not require any further parameters to be determined in experiments. Furthermore, none of the other models has proven to be generally superior. 18
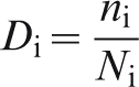
The damage of a stress amplitude in the load spectrum is defined as the ratio of its number of occurrences in the amplitude spectrum and the load cycle number until failure as defined in the S–N curve
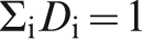
The component theoretically fails when
As the relative damage sums are usually <1, the calculated fatigue life is on the non-conservative side. Additionally, a large scatter can be observed for the relative damage sums. This can be explained with the shortcomings of linear damage accumulation. It describes the complex damage process from crack initiation to fatigue crack growth and final rupture insufficiently. The sequence effect between small and large stress ranges is disregarded entirely, as the sequence information is lost after cycle counting. Furthermore, there is the problem of transferability of fatigue behaviour from constant amplitudes to variable amplitudes.
Another source of error arises from the consideration of load cycles with stress amplitudes below the initial endurance limit. As the damage progresses, the endurance limit decreases until it theoretically approaches zero just before the final rupture occurs. To account for the damaging effect of stress amplitudes below the initial endurance limit, several modifications for the damage accumulation exist. 21 Therefore, the S–N curve is modified for damage accumulation.
The original linear damage accumulation proposed by Miner explicitly excluded stress amplitudes below the endurance limit. Neglecting the load ranges below the endurance limit in a fatigue life calculation is in the following referred to as Miner original (MO).
The simplest modification is to extend the S–N curve to N→∞ keeping the exponent constant. This is referred to as Miner elementary (ME). It is evident that those two modifications are the two limiting cases for a conservative (ME) and non-conservative (MO) treatment of stress amplitudes below the endurance limit. Based on the assumption that the endurance limit decreases linearly with increasing damage D, Haibach proposed the modified form of the Miner's rule (MM). 22 Here, the S–N curve proceeds with a modified slope of k* = 2k−m for N>Ne. For sintered and cast materials, m = 2 applies, while for all other steel and aluminium materials, m = 1. 8
A different approach is suggested by Liu and Zenner. 23 Here, for the damage accumulation, the S–N curve is also modified above the endurance limit. The S–N curve is rotated about the point defined by the maximum stress amplitude in the load spectrum and its corresponding cycle number N in such a way that the slope of the S–N curve becomes k* = (k+3·6)/2. The endurance limit is lowered to 50% of its original value, based on results from omission tests. 24 As the rotation point is dependent on the maximum stress amplitude of the load spectra, a new S–N curve is used for each new overall stress level. The modification from Zenner and Liu is referred to as ZL.
Figure 1 shows the course of the S–N curves used for the damage accumulation for the different modifications of the Miner's rule and the load spectrum resulting from the load sequence used in this work. The resulting calculated fatigue life curves for the different modifications are plotted in Fig. 2.
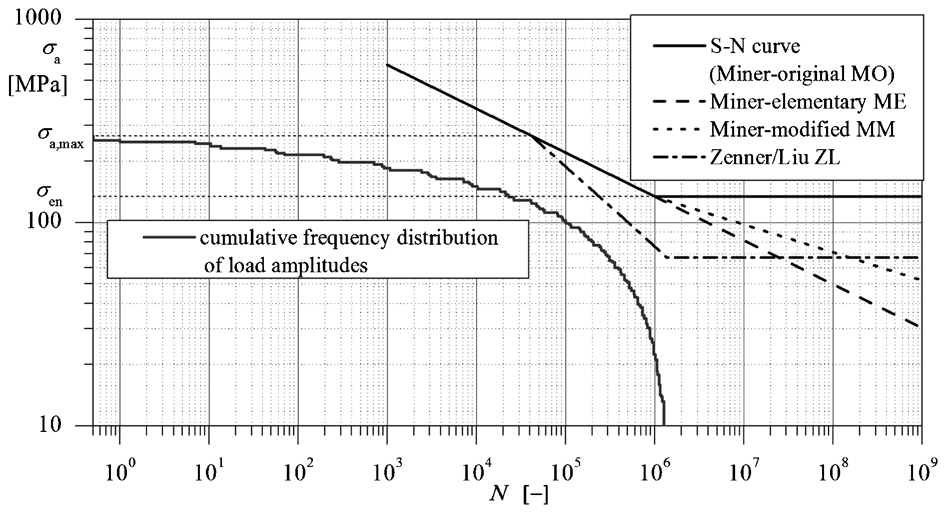
Modified S–N curves used for damage accumulation
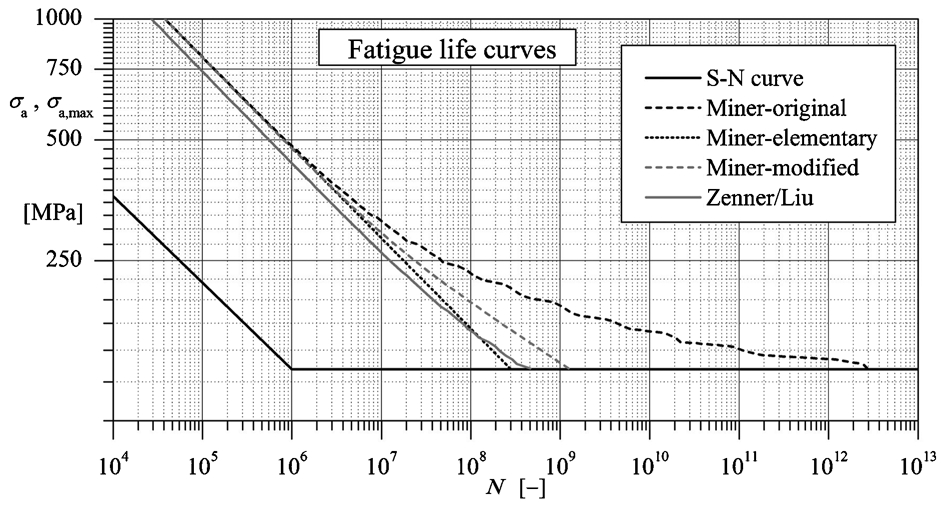
Calculated fatigue life curves for different modifications of damage accumulation
With the knowledge of the typical mean value of the relative damage sums for a material or material group, its value can be used to correct the calculated fatigue life

This procedure for correcting the damage sum is known as relative Miner's rule.25,26
Description of experiments
Materials
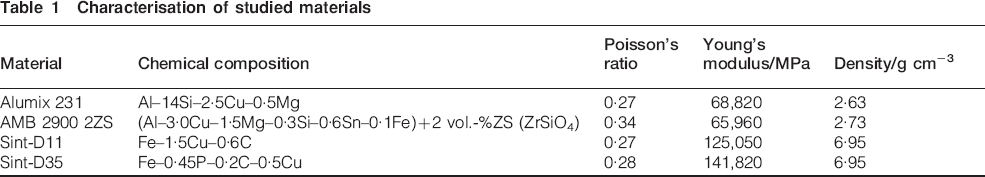
For this study, two PM steels (Sint-D11 and Sint-D35) and two PM aluminium alloys (Alumix 231 and AMB 2900 2ZS) were used. The chemical compositions, the elastic material parameters and the density are given in Table 1. The density was measured in the notches as critical regions for fatigue failure. The same density was assured for the unnotched and the notched specimens. This is necessary to obtain comparable results, as the density has a significant influence on the fatigue strength.
Characterisation of studied materials
The pressing conditions are as described in Table 2. Both the PM steels were sintered at 1120°C for 20 min in endogas (carbon neutral). There was no further treatment for the studied PM steels.
Pressing condition of fatigue specimens
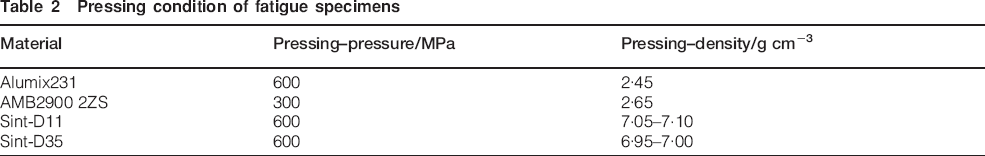
In contrast, for delubricating and sintering of the PM aluminium specimens, a continuous belt furnace, with 100% nitrogen (dew point less than −45°C) and sinter temperatures between 560 and 625°C (45–60 min), depending on the composition and geometry of the specimens, was used. The sintered parts were solution annealed (510°C for 45 min), water quenched and artificially (T6) aged. 27
Figure 3 shows the microstructure of the investigated PM aluminium alloys.
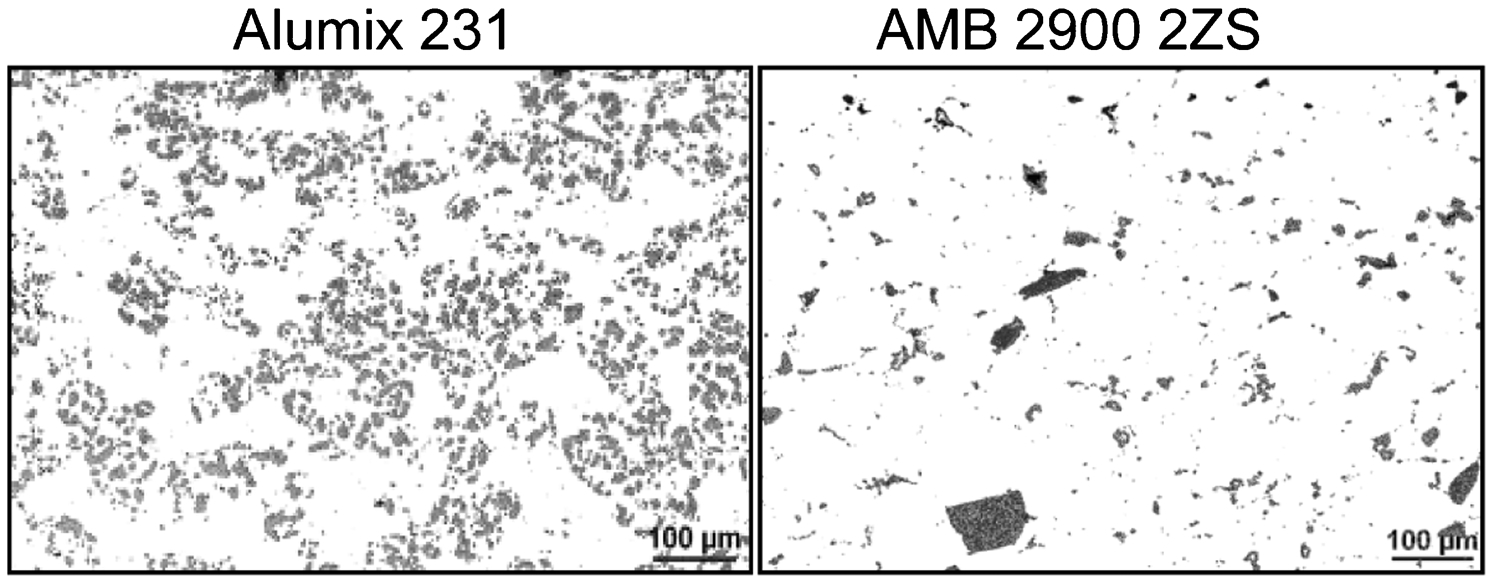
Microstructure of PM aluminium alloys 27
Experimental procedure
S–N curves including the endurance limit are needed as the basis for the fatigue life calculation. Accordingly, constant amplitude tests (fully reversed stress amplitudes) were carried out. In the finite life region, 12–15 specimens with different stress amplitudes were tested. The S–N curve was calculated by linear regression of the logarithmic values (S,N). The endurance limit was determined using the staircase method, as described, for example in Ref. 14, with the statistical evaluation according to Hück. 28 The S–N curves and endurance limits were determined at two stress ratios, alternate loading (R = −1) and pulsating loading (R = 0), to evaluate the mean stress sensitivity. In one case, the endurance limit was estimated using the endurable stress amplitude at N = 106 from the S–N curve.
Service load tests (variable amplitude tests) have been carried out using a standard Gaussian load sequence, which includes mean load variations and has an irregularity factor I = 0·7 (as defined, e.g. in Ref. 14). The load collective is displayed in Fig. 1 along with the different S–N curve variations used for the damage accumulation. All fatigue tests were carried out with a testing frequency of 20 Hz in the finite life region and 30 Hz near the infinite life region (N>106).
Experimental apparatus
All fatigue tests were carried out with servohydraulic testing machines. The control system IST8800 from Instron Structural Testing Systems (IST) was used. The software LabSite from IST was used for programming the testing procedure and data logging. The fatigue specimens (notched and unnotched) were fixed with a mechanical clamping device and, in some cases, servohydraulically. Figure 4 shows exemplarily a notched fatigue specimen fixed with a servohydraulic clamping device.
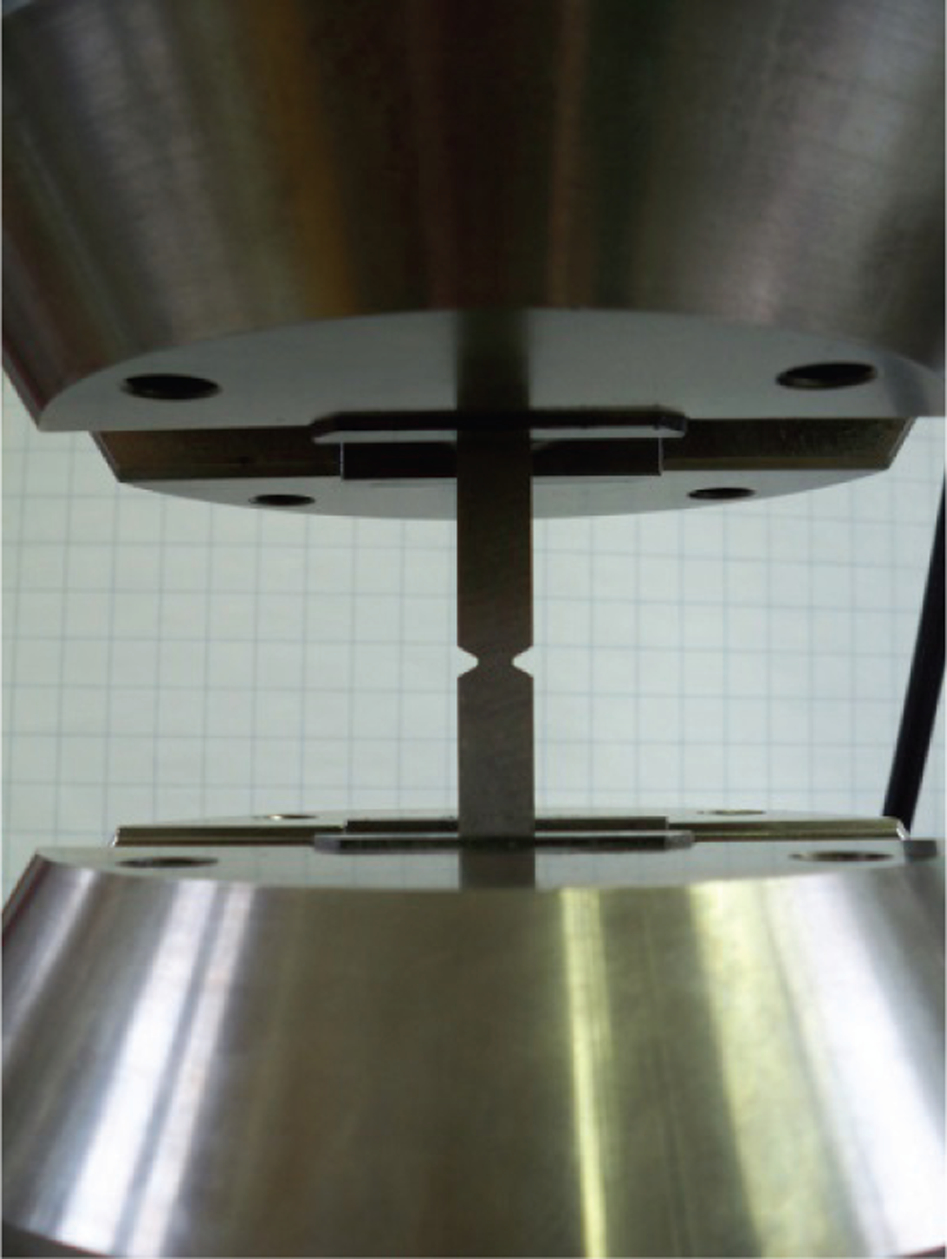
Notched specimen in testing machine, servohydraulic clamping device
Specimens
The material's fatigue limit was determined with unnotched specimens defined in the German standard DIN EN ISO 3928. 29 The notched specimens used in this work are also specified there. Both are shown in Fig. 5. Finite element analysis was used to calculate the stress concentration factor Kt = 2·5 and the relative stress gradient (first principal stress) in the notch root of χ′ = 1·97.
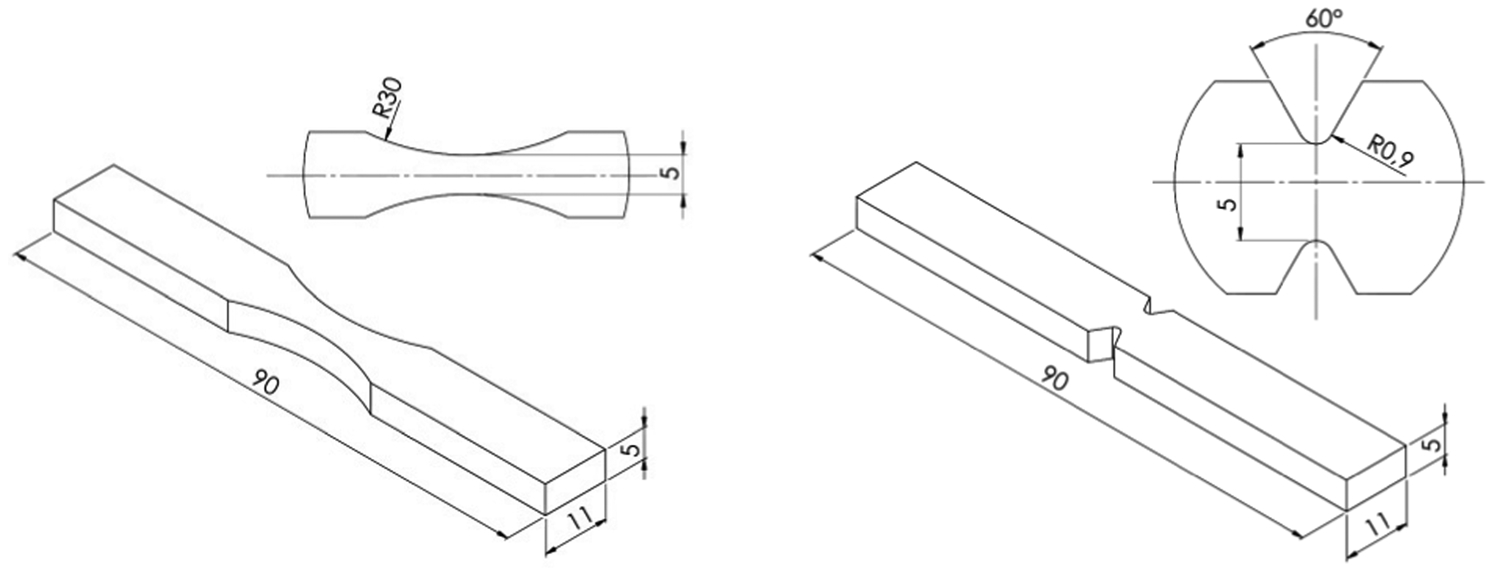
Fatigue test specimens (unnotched and notched), according to the DIN EN ISO 3928 standard
Results and discussion
Results of constant amplitude tests
A detailed listing of the experimental results can be found in a final report, 30 which is accessible online. This section summarises the important results, which are needed for the fatigue life assessment. The parameters of the S–N curves of the notched specimen at the studied stress ratios are given in Table 3. The single test results are plotted with the corresponding S–N curves in Figs. 6–9.
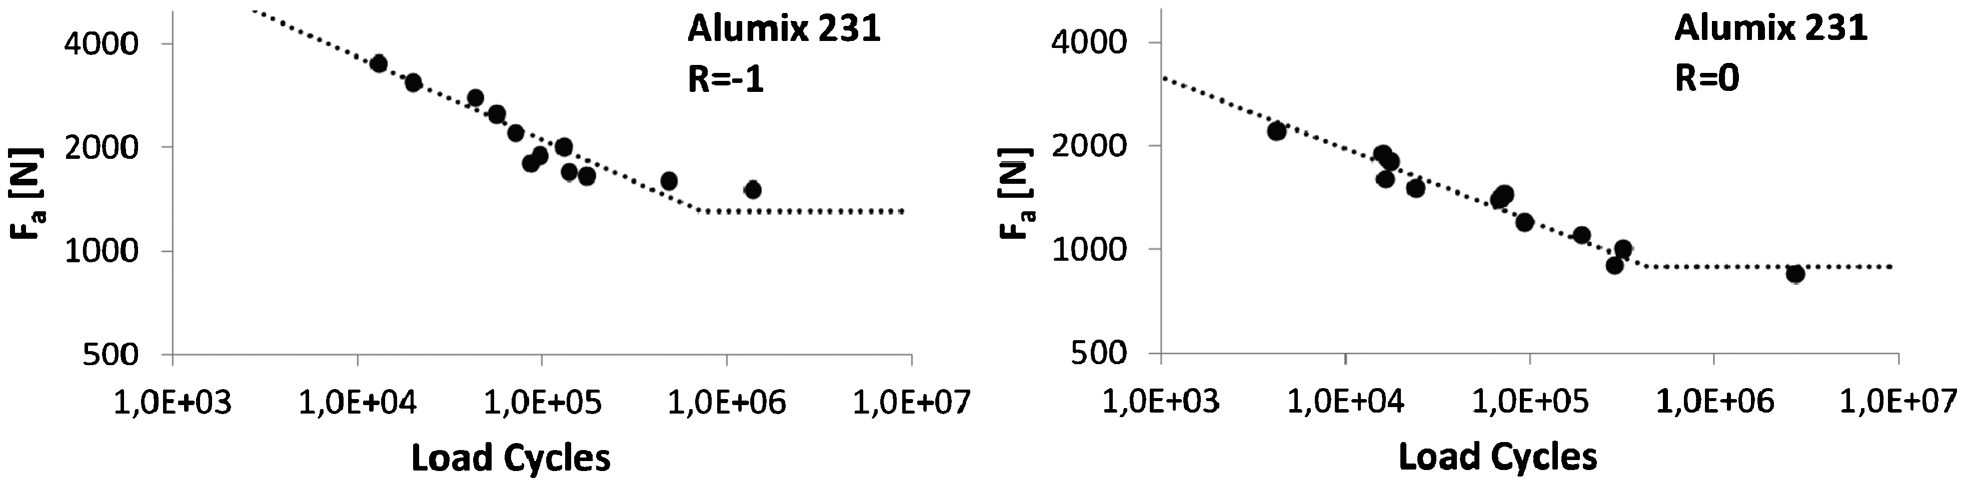
S–N curves of notched specimens, Alumix 231
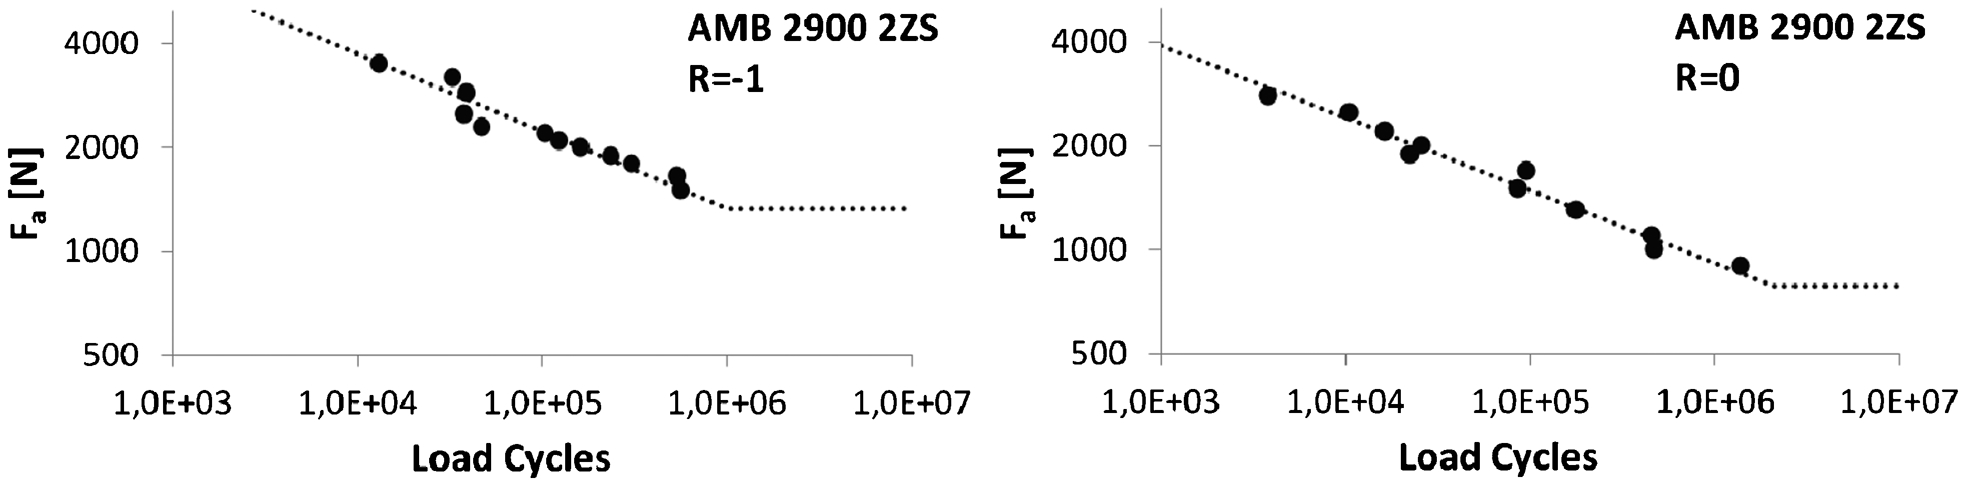
S–N curves of notched specimens, AMB 2900 2ZS
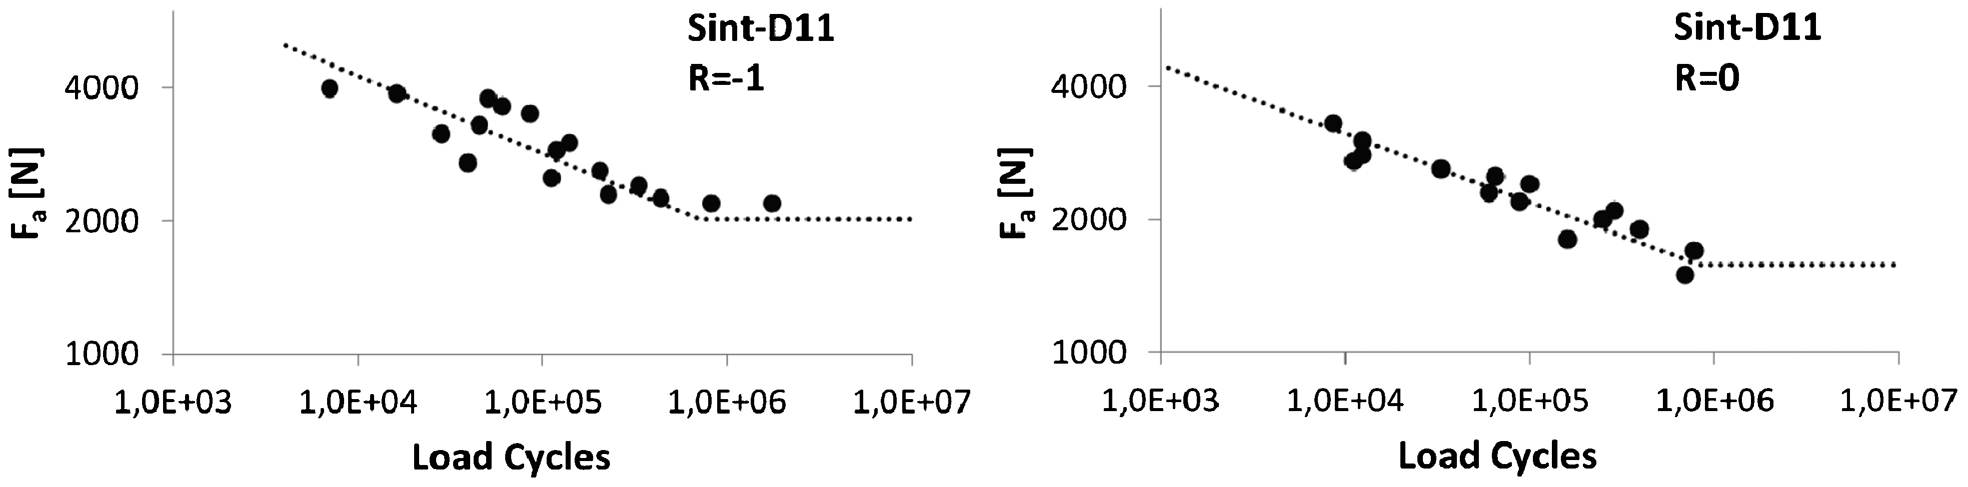
S–N curves of notched specimens, Sint-D11
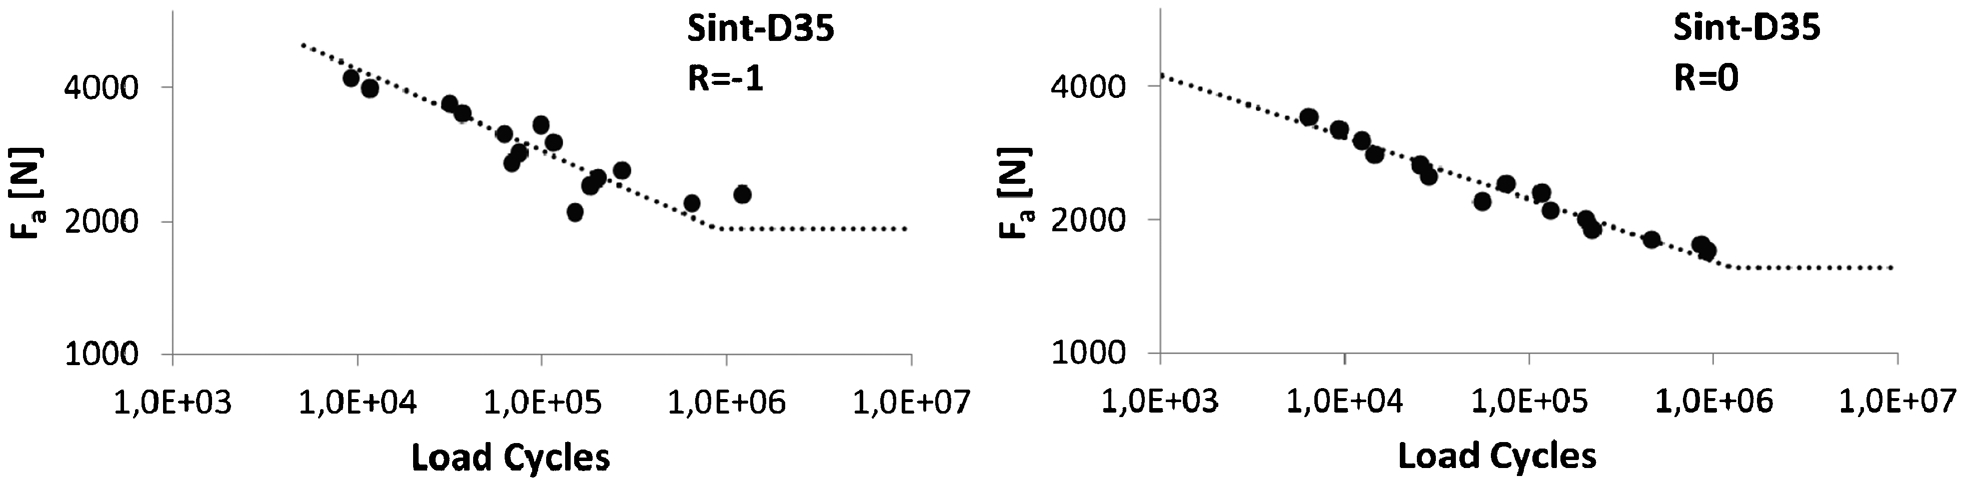
S–N curves of notched specimens, Sint-D35
Parameters of S–N curves of notched specimens
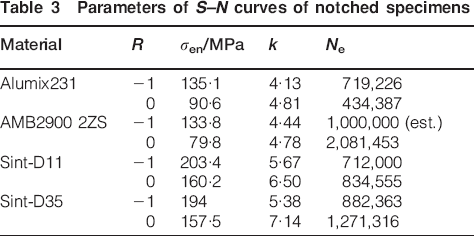
Generally, it can be observed that the exponent k for specimens of PM aluminium is lower than for the PM steels studied. This means that the slope of the curves in the finite life region is steeper for PM aluminium. In addition, for all materials studied, the slope is steeper for R = −1 than for R = 0. The values for the exponent k are within the typical range for notched components made of compact steel and aluminium. In general, typical values for k are between k = 3 for sharp notched components or welded joints, where crack propagation dominates the fatigue behaviour and k = 7 for smooth and blunt notched components.
The values for the material endurance limit are summarised in Table 4.
Material endurance limits
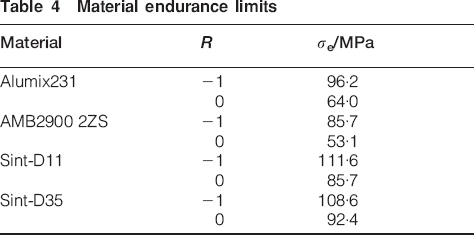
The difference between the material's endurance limit and the endurance limit of notched specimens and components is caused by the fatigue notch effect. Whereas in unnotched specimens, the stress distribution is homogeneous and thus constant throughout the entire cross-section, in notches, the stress distribution is inhomogeneous and the maximum stress is limited to a small region in the notch root. As a consequence, the endurable peak stress amplitude in notches σen may be considerably higher than the material parameter σe, which is the endurable stress amplitude of an unnotched specimen. Knowing the notch sensitivity, the endurance limit of notched components can be calculated from the material endurance limit. This has been studied in Refs. 3 and 31 and will not be further discussed here.
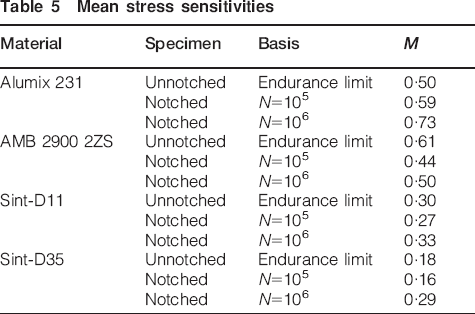
Besides the S–N curve, the mean stress sensitivity M is a prerequisite for fatigue life calculation with variable amplitude loading. Studies in Refs. 32 and 33 showed that, for sintered steels, this parameter seems to be almost constant over a large range of stress ratios. Therefore, it can be determined by evaluating the fatigue strength at only two different stress levels. The value for M is often also considered constant for a material and thus not dependent on the component's geometry. In Table 5, the values for M are once calculated from the material's endurance limit and calculated additionally from the S–N curve of the notched specimens at the cycle numbers N = 105 and N = 106. For the PM steels studied, there is a reasonable accordance between the results from notched and unnotched specimens. For PM aluminium, the differences are greater. No general tendency of how M changes can be observed, as there is a decrease for AMB 2900 2ZS and an increase for Alumix 231 from unnotched to notched specimens. The difference of the mean stress sensitivity at N = 105 and N = 106 is caused by the flatter slope of S–N curves at R = 0. For the fatigue life calculation carried out in this study, M was taken from the notched specimens at N = 105. This is a common assumption 34 for the fatigue life assessment of variable amplitude load spectra.
Mean stress sensitivities
Failure criterion
Figure 10 shows the typical course of the stiffness plotted over the load cycle number for a strain controlled test with an unnotched specimen of Sint-D35. The curve is exemplary for all other materials studied in this paper.
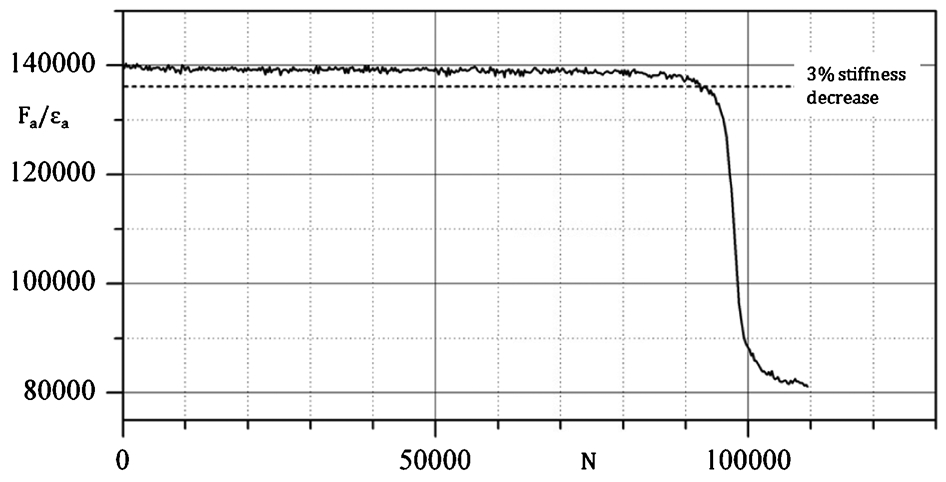
Course of stiffness of strain controlled constant amplitude test, Sint-D35
Until technical crack initiation (assumed at 3% stiffness decrease), the stiffness remains almost constant. The subsequent phase until final rupture involves only few load cycles, compared to the total number of load cycles. Fatigue tests with notched specimens can only be carried out load controlled, as strain measurement in notches is impossible with strain gauges. The course of the stiffness calculated from applied load and measured path of the servohydraulic cylinder oscillates stronger than in Fig. 10, as the strain can be measured at a much higher resolution. For the load controlled fatigue tests with notched specimens also, almost no difference could be detected between crack initiation and final rupture, which is typical for brittle materials. For all fatigue tests in this study, the load cycle number at failure corresponds to final rupture.
Service load tests
For each material, service load tests at five or six different load levels were carried out. The different stress levels were achieved by linearly scaling the load sequence. This makes a total of 22 service load tests. The individual service load test results of the notched specimens can be found in Table 6.
Test results of service load tests with notched specimen
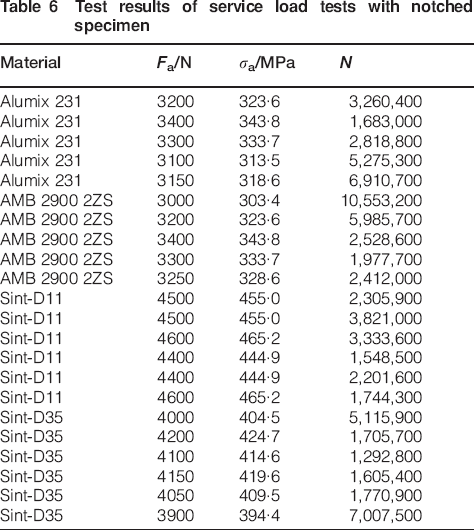
Subsequently, the fatigue life for every test was estimated using the different modifications of the Miner's rule defined above: MO, ME, MM and ZL. The fatigue life calculated is expressed in relation to the fatigue life determined in experiments as relative damage sums Drel according to equation (6).
In order to provide a broader database and thus achieve a better grounded result regarding the statistical evaluation, test results carried out with real components were also included in the evaluation. These additional tests will not be explained here. They are documented in Ref. 30. The components tested include a chain wheel made of the two investigated PM steels with a blunt notch in the region of failure. The notch can be characterised with a relative stress gradient of χ′ = 0·36 mm−1. The results of a sharply notched component (relative stress gradient χ′ = 6·9 mm−1) made of Alumix 231 were also included. Accordingly, the database contains 22 service load tests with the specimens and materials presented in this paper and another 23 service load tests with real components.
Statistical evaluation
The relative damage sums of all tests were evaluated statistically assuming a logarithmic normal distribution for Drel. A probability of occurrence P(i) must therefore be assigned to each test result. In material fatigue, P can best be estimated as proposed by Rossow
 (at 50% confidence probability) and the scatter are obtained. The slope in the probability grid depends on the scatter. The scatter range is determined as the ratio of the relative damage sums at 10 and 90% confidence probability
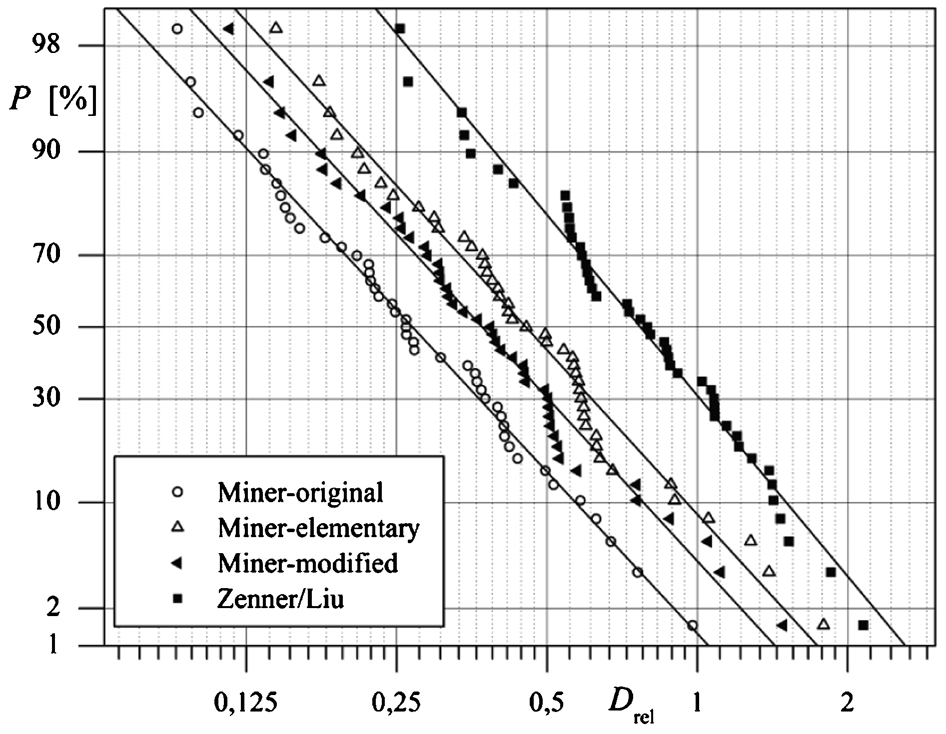
Statistical evaluation (PM steel and aluminium) in probability grid
The scatter expresses the uncertainty of such a calculation and can furthermore be used to convert the calculated value from 50% to another confidence probability. The limitations of the linear damage accumulation are not the only reasons for the typically large scatter observed in fatigue life calculations. A considerable portion is caused by the variance of the tests itself. Even for an ideal damage accumulation rule that leads to a relative damage sum of Drel = 1, the scatter of the experimental input data would cause a scatter of
 in fatigue life calculation.
15
in fatigue life calculation.
15
Results of fatigue life assessment
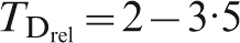
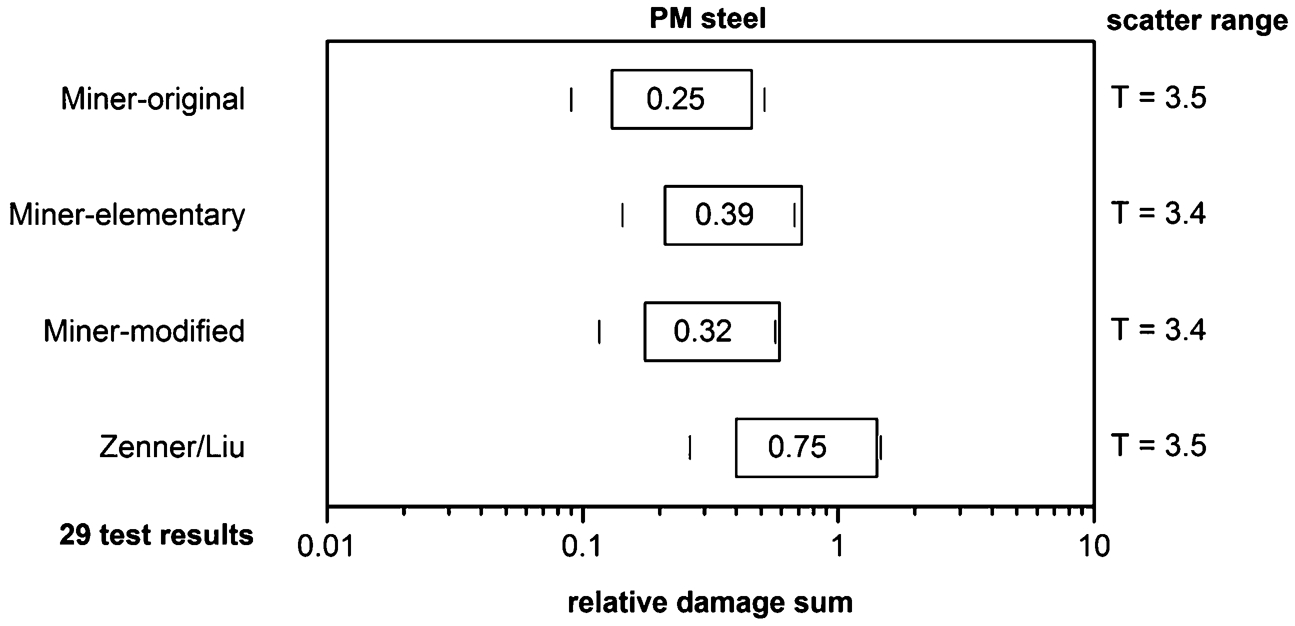
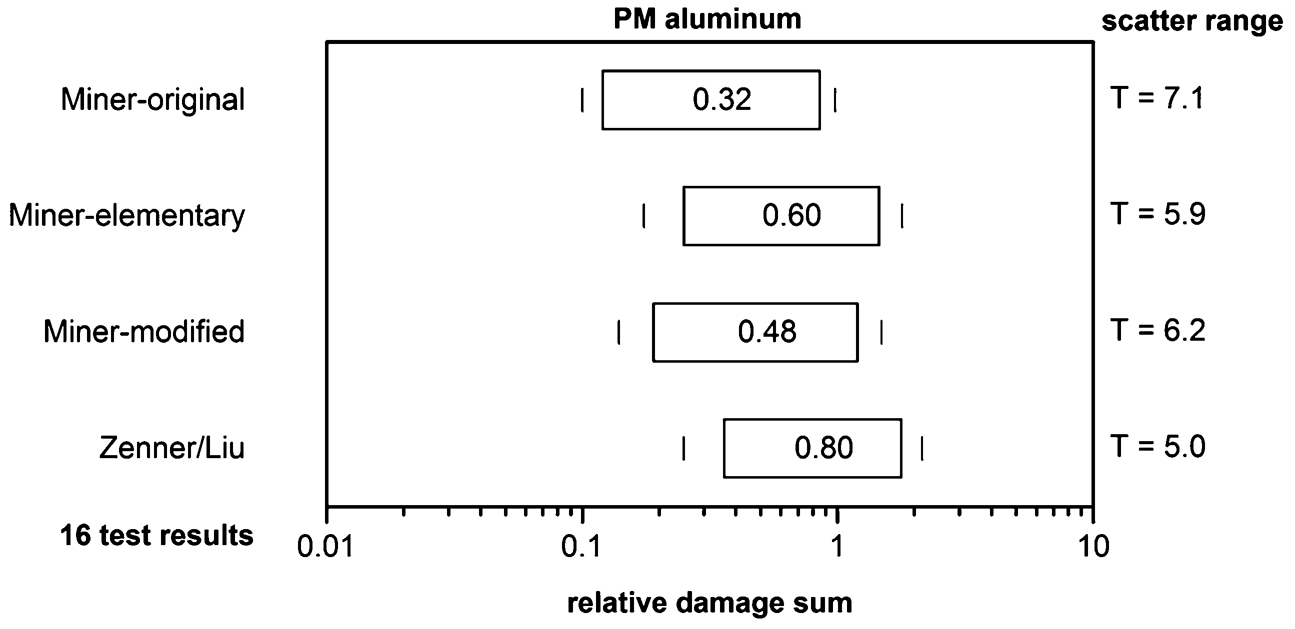
The results of the fatigue life assessment were evaluated statistically, once for PM steel and aluminium separately and once together. They are shown in Figs. 12–14, which show the mean relative damage sum
 and the scatter
 for each modification of the damage accumulation. These results are evaluated and compared below.
Mean damage sums and scatter for PM steels Sint-D11 and Sint-D35
Mean damage sums and scatter for Alumix 231 and AMB 2900 2ZS
Mean damage sums and scatter for all studied PM steel and aluminium alloys
On average, the fatigue life assessment is on the non-conservative side for all studied materials. This is indicated by mean relative damage sums <1. As can be expected from the course of the modified S–N curves shown in Fig. 1,
 (MO)<
(MO)<
 (MM)<
(MM)<
 (ME)<
(ME)<
 (ZL).
(ZL).
For PM steel, the scatter is almost the same for all modifications of damage accumulation. The values of the mean relative damage sums are noteworthy. They match the expected values for compact materials quite well. In Ref. 35, 964 different relative damage sums were evaluated statistically. The material categories involved there are mainly steel (60%) but also aluminium alloys, cast iron, titanium alloys and cast aluminium. The mean damage sum calculated using the modification ME is
 = 0·39 (compared to
 = 0·39 for PM steels in this study), and using MM,
 = 0·32 (
 = 0·29 for PM steels). It seems from these results that, when using
 as a correction factor for the calculated fatigue life (relative Miner's rule), PM steels can be treated like compact steels. No recommendation can be made for any of the modified damage accumulation models due to the similar scatter. Generally, the modified Miner's rule (MM) can be regarded as state-of-the-art in stress based fatigue life calculations. Additionally, the modification ZL has the advantage of mean damage sums close to one. In Ref. 21, the lowest scatter of relative damage sums is achieved with the ZL modification.
On the other hand, the differences in the results for PM aluminium are more obvious. The scatter is greatest for the fatigue life calculation with MO (
 = 7·0) and smallest with ZL (
 = 5·2). Overall, the scatter in the fatigue life calculation is greater for PM aluminium than for PM steel. The considerably greater scatter for PM aluminium cannot be explained with a greater scatter of the experimental input data (S–N curves), which is of the same magnitude for both material groups. The mean relative damage sums are greater than for PM steel, but are still on the non-conservative side. Owing to the difference in scatter, the ZL modification can be recommended for the fatigue life assessment of parts of PM aluminium, based on the present results.
In Fig. 14, all 45 tests with PM steel and PM aluminium are evaluated together. This confirms the good results with the ZL modification. However, when applying the relative Miner's rule with the ZL modification, the correction factor should be applied according to the separate evaluation: 0·75 for PM steel and 0·80 for PM aluminium.
It must be pointed out that the database for this statistical evaluation is not satisfactory in extent. Therefore, the values for the scatter in particular are only rough estimates. The values should only be used for a qualitative comparison between the different modifications of the damage accumulation and not to derive safety factors for the actual design of safety relevant components. The mean relative damage sums on the other hand can be considered more significant and can already give a good estimate for use with the relative Miner's rule.
Conclusions
This study examined the reliability of stress based fatigue life assessment for notched PM specimens. For that purpose, two PM steel and two PM aluminium alloys were used exemplarily. All necessary component related input data for the calculation, S–N curves and mean stress sensitivities, were determined in experiments. For experimental validation of the fatigue life calculation, service load tests (variable amplitude loading) were carried out with a standard Gaussian load sequence. The relative damage sums, expressing the ratio of experimentally obtained and calculated fatigue life, were statistically evaluated. The results can be summarised as follows.
The results of the fatigue life assessment for the PM materials studied are non-conservative in the average.
The values of the mean relative damage sums for PM steel are almost equal to those for compact steels.
The mean relative damage sums for PM aluminium are greater than for PM steel.
The scatter of the relative damage sums is smaller for PM steel than for PM aluminium.
While there is no difference in scatter for PM steels, the ZL modification results in the least scatter for PM aluminium compared to the other modifications of the damage accumulation studied.
Based on the combined evaluation of PM steel and PM aluminium, damage accumulation modified according to Zenner and Liu is recommended.
The identified mean relative damage sums can be used as a correction factor (relative Miner's rule) for calculated fatigue life.
A broader database is necessary for general conclusions and reliable values for the scatter of the fatigue life assessment.
Footnotes
Acknowledgements
The project was funded by the German Federal Ministry of Education and Research within the framework of the ‘Wachstumskern Thale PM’. This support is gratefully acknowledged. Furthermore, the authors would like to thank Schunk Sintermetalltechnik from Thale, Germany, particularly Mrs S. Müller, for the support and the provision of the fatigue test specimens.