
Abstract
The effective use of alloying elements in powder metallurgical steels requires a deep understanding of their redistribution kinetics during sintering. In this work, interrupted sintering trials of Fe–2Cu and Fe–2Cu–0·5C compacts were performed. Moreover, diffusion simulations of Cu in γ-Fe using Dictra were performed. It is found that transient liquid phase penetrates the Fe interparticle and grain boundaries in less than 3 min of holding time. However, C addition limits the penetration of liquid Cu, particularly into grain boundaries of large Fe particles. The results also show that the mean diffusion distance of Cu in γ-Fe in the C added system is slightly lower than that in the C-free system at 3 min of holding time; however, after 33 min, the mean diffusion distance is similar in both systems. The diffusion distances of Cu in γ-Fe, predicted by Dictra, are in good agreement with the measured values.
Keywords
Introduction
The field of powder metallurgy is growing rapidly over the past three decades as this technology is showing promise as an alternate low cost process to metal working technologies, e.g. forging and stamping. Liquid phase sintering (LPS) is widely applied in powder metallurgical (PM) steels, and it can be categorised into three basic processes:1–11 first, particle rearrangement and fluid flow; second, solution and reprecipitation; and three, skeleton formation or coalescence and grain growth. The development of LPS in PM steels has focused on systems with considerable mutual solubility among the components, i.e. Fe–Cu and Fe–Cu–C.
The addition of alloying elements, i.e. Cu and C, to Fe is necessary to achieve the desired properties of the sintered products. However, alloying results in dimensional changes13–28 of the compacts during sintering, which could have a detrimental effect on the dimensional tolerances of the final product. Copper is added as an alloying element to increase the strength of sintered steels, whereas graphite (C) is added not only to enhance the compact strength but also to reduce the swelling caused by Cu addition.
Copper melts at 1083°C, which is below normal sintering temperatures of 1100–1250°C, and the transient liquid phase penetrates the iron matrix rapidly. The initial rapid redistribution of Cu into Fe interparticle boundaries and grain boundaries within the Fe particles is mainly achieved by the presence of transient liquid phase.29–31 After this initial phase, the redistribution of Cu via solid state diffusion becomes significant. 32 However, C redistribution starts well below the melting point of Cu and it is achieved by solid state diffusion.
The proper wetting of solid skeleton by transient liquid phase is important for the better distribution of alloying elements. Wetting is usually enhanced in metallic systems with mutual solubility,33,34 i.e. Ag–Cu, Si–Cu, compared to systems without solubility, 35 i.e. Ag–W. Moreover, the kinetics of spreading is fast 36 in non-reactive systems as compared to reactive systems.37,33,34 In metallic systems with low solubility of solid in liquid phase (as for Fe–Cu, the maximum solubility of Fe in liquid Cu is ∼3%Fe at 1100°C), the wetting behaviour is expected to be similar to non-dissolutive systems and it is shown 38 that for the wetting of liquid Cu on the sintered Fe substrate the dissolution of the substrate is not significant.
The kinetics of Cu redistribution, either by liquid penetration or solid state diffusion, is important in determining the effect of Cu addition on compact properties, e.g. volume expansion. The understanding of Cu redistribution could be helpful in the optimisation of sintering time as well as for the selection of a suitable powder particle size. The redistribution of Cu, particularly by liquid penetration, and the effect of C addition on redistribution has been investigated by the authors 13 and other researchers18,28,38–41,45,46 earlier. However, to the best of our knowledge, a quantitative analysis of the Cu redistribution kinetics, particularly by solid state diffusion, and how it is affected by the C addition has not been reported.
The aim of this work is to quantitatively analyse the kinetics of Cu redistribution by liquid penetration and solid state diffusion. The effect of C addition on the kinetics of Cu redistribution processes is also analysed. Interrupted sintering trials of Fe–2Cu and Fe–2Cu–0·5C for various isothermal holding times were performed. Dilatometry results were used to examine the dimensional variations of compacts during sintering. Further, Cu redistribution by liquid penetration was investigated by light optical microscopy (LOM); moreover, the diffusion of Cu in Fe at interparticle boundaries was quantitatively analysed by energy dispersive X-ray spectroscopy (SEM/EDXS). 1D Dictra 42 simulations of Cu diffusion in Fe and Fe–0·5C were performed, and the obtained results were compared with EDXS measurements.
Experiments and simulations
The powder mixtures made for interrupted sintering trials were Fe–2Cu and Fe–2Cu–0·5C. The powders used in these mixtures were:
Höganäs Fe powder, grade ASC100·29
Cu powder (electrolytic), −325 mesh
Graphite powder, Kropfmühl UF 4.
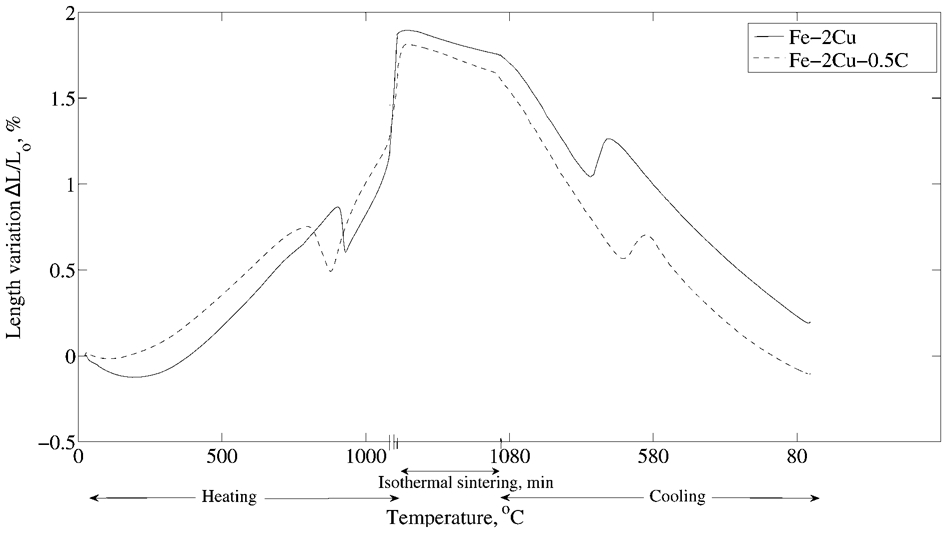
The powder mixtures were compacted, using a small laboratory press, into cylindrical shaped specimens (diameter is 6 mm, height is 12 mm) at a pressure of 600 MPa. The lubricant used was 0·6% Kenolube and dewaxing was done in a laboratory batch furnace at 600°C for 30 min in an atmosphere of 75 vol.-%H2–25 vol.-%N2. The sintering trials were performed in a Theta Industries dilatometer and in a reducing atmosphere of 90 vol.-%N2–10 vol.-%H2. The planned temperature cycle that was employed in the sintering trials consisted of four different phases: an initial heating phase with a heating rate of 1°C s−1 from RT to 800°C; a second heating phase with a lower heating rate of 0·4°C s−1 from 800 to 1120°C; isothermal holding for various times; and the final cooling phase using a cooling rate of 5°C s−1 from 1120°C to RT. The temperature cycle was interrupted at five different times as shown in Fig. 1. By interrupting the temperature cycle at five different points, a total of six sintering trials were performed for each powder mixture.
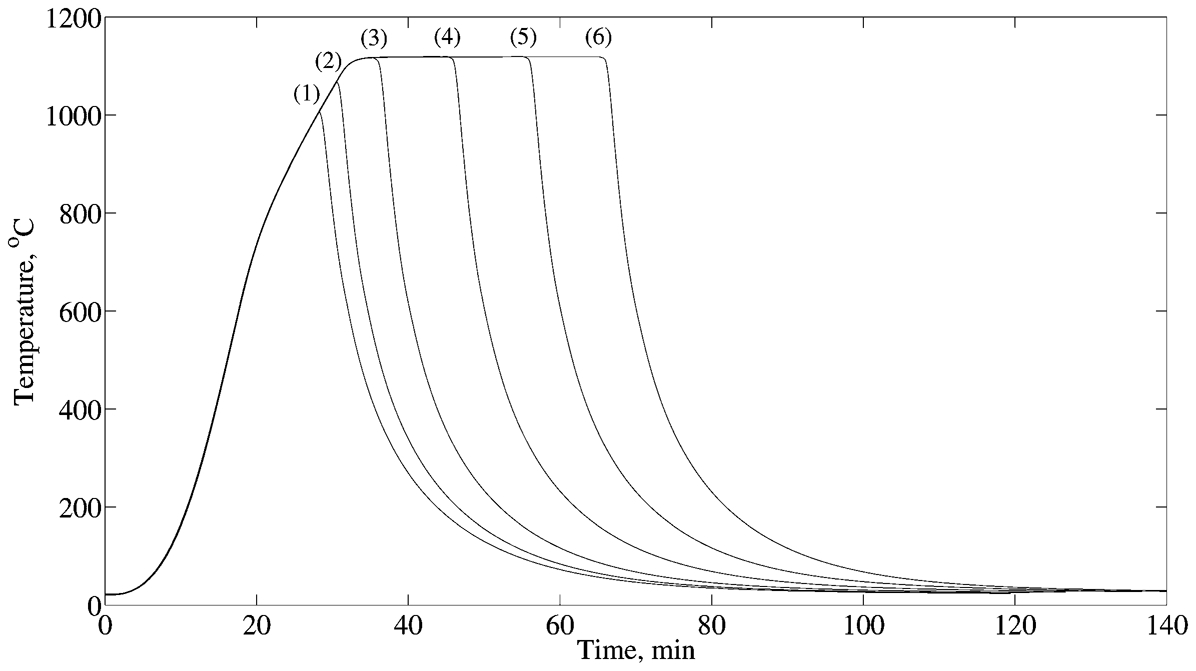
1, 1000°C; 2, 1060°C; 3, 1120°C, 3 min; 4, 1120°C, 13 min; 5, 1120°C, 23 min; 6, 1120°C, 33 min
The LOM images were obtained after polishing specimen sections and etching them with pikral. The Cu diffusion distances in γ-Fe at Fe interparticle boundaries during sintering were measured by SEM/EDXS analysis performed using a Hitachi 3700N equipped with the Quantax system. The samples were etched with 1% nital to be able to identify Cu rich Fe interparticle boundaries, before performing line scans.
Dictra 42 simulations for the diffusion of Cu in Fe and Fe–0·5C at different times were performed using the Thermo-Calc Software TCFE6 Steels/Fe-alloys database 43 and Dictra mobility database mob2. The initial condition of the 1D Dictra model is shown in Fig. 2a, and the initial thickness of the liquid Cu film was set to 0·5 μm. In order to investigate the effect of C on Cu diffusion in γ-Fe, the initial composition of the FCC phase was set to Fe–0·5C. The temperature cycle employed in the simulations is shown in Fig. 2b.
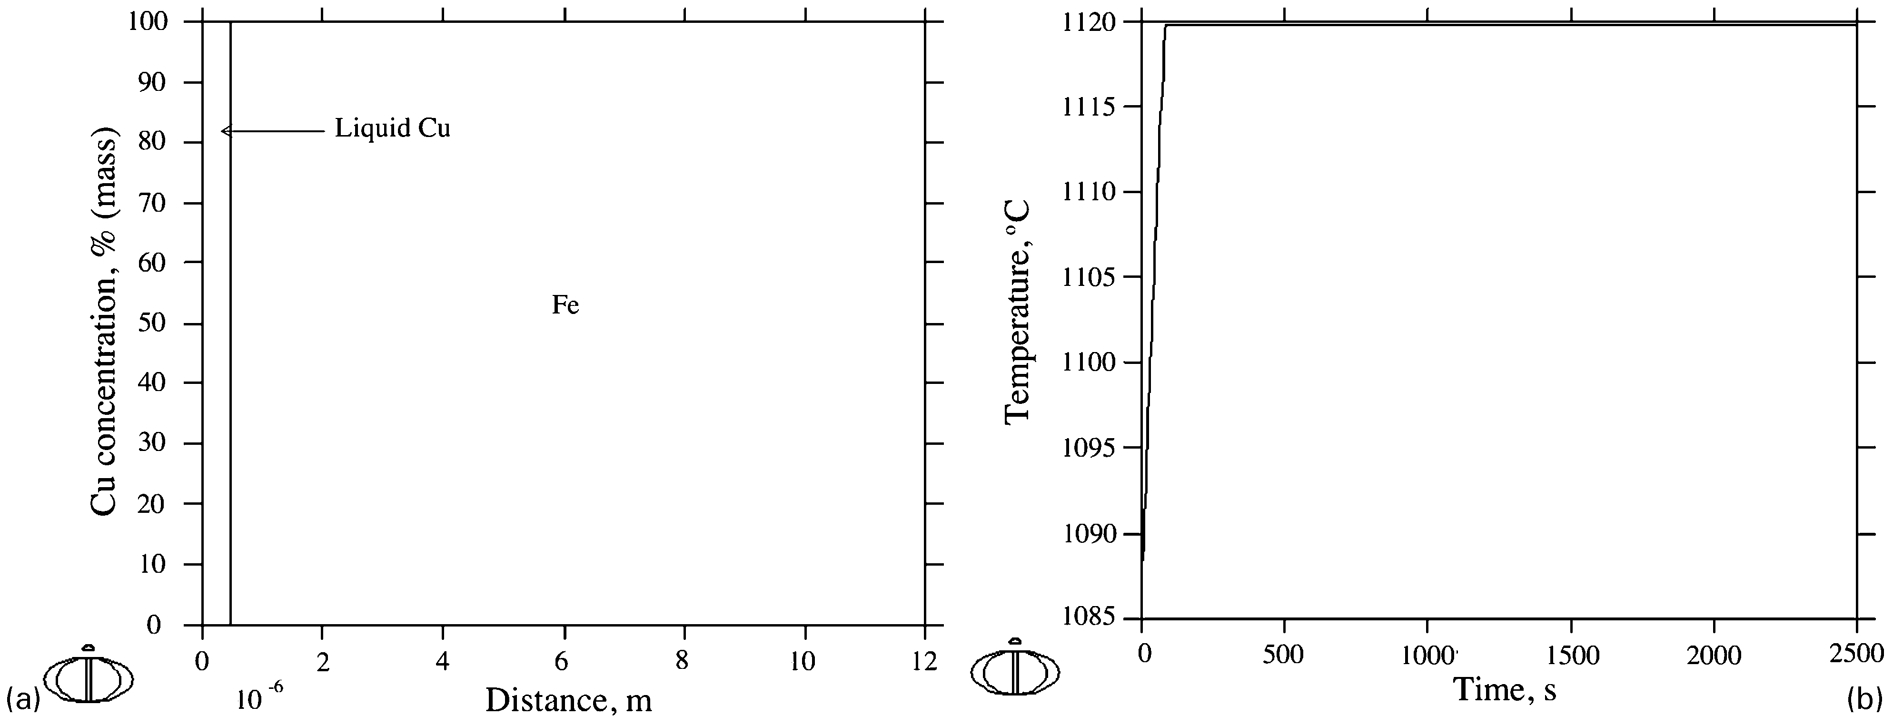
a initial Cu concentration in liquid Cu phase and γ-Fe phase; b heating cycle for Dictra simulations
Results
Sintered microstructure
The microstructure of the samples sintered below the melting point of Cu (trial 2) is shown in Fig. 3. The unmelted Cu particles and Fe particle/grain boundaries can be seen in both types of samples. The formation of lamellar pearlite in the C added sample indicates the diffusion of C. The brownish seams along the Fe particle/grain boundaries show the penetration of Cu at the Fe particle/grain boundaries.
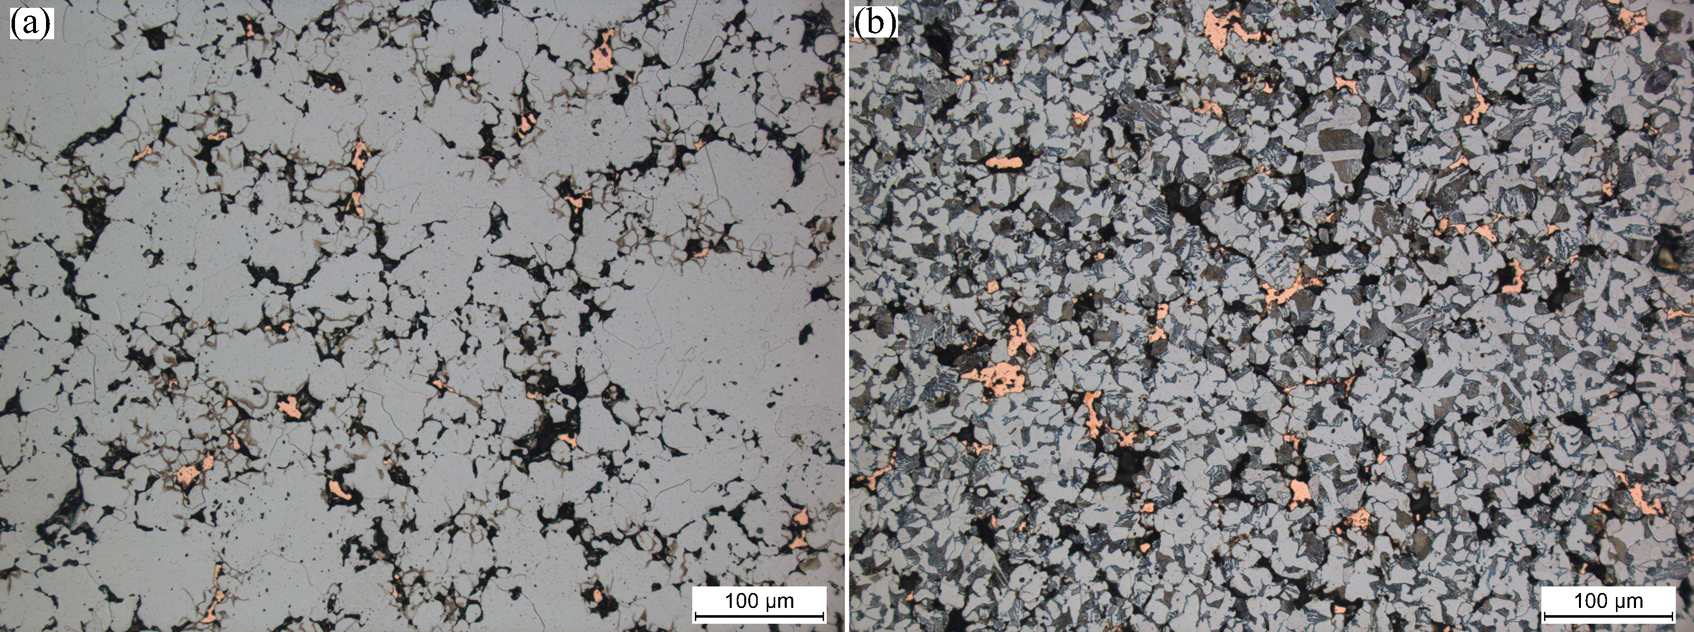
a Fe–2Cu; b Fe–2Cu–0·5C, pikral etched
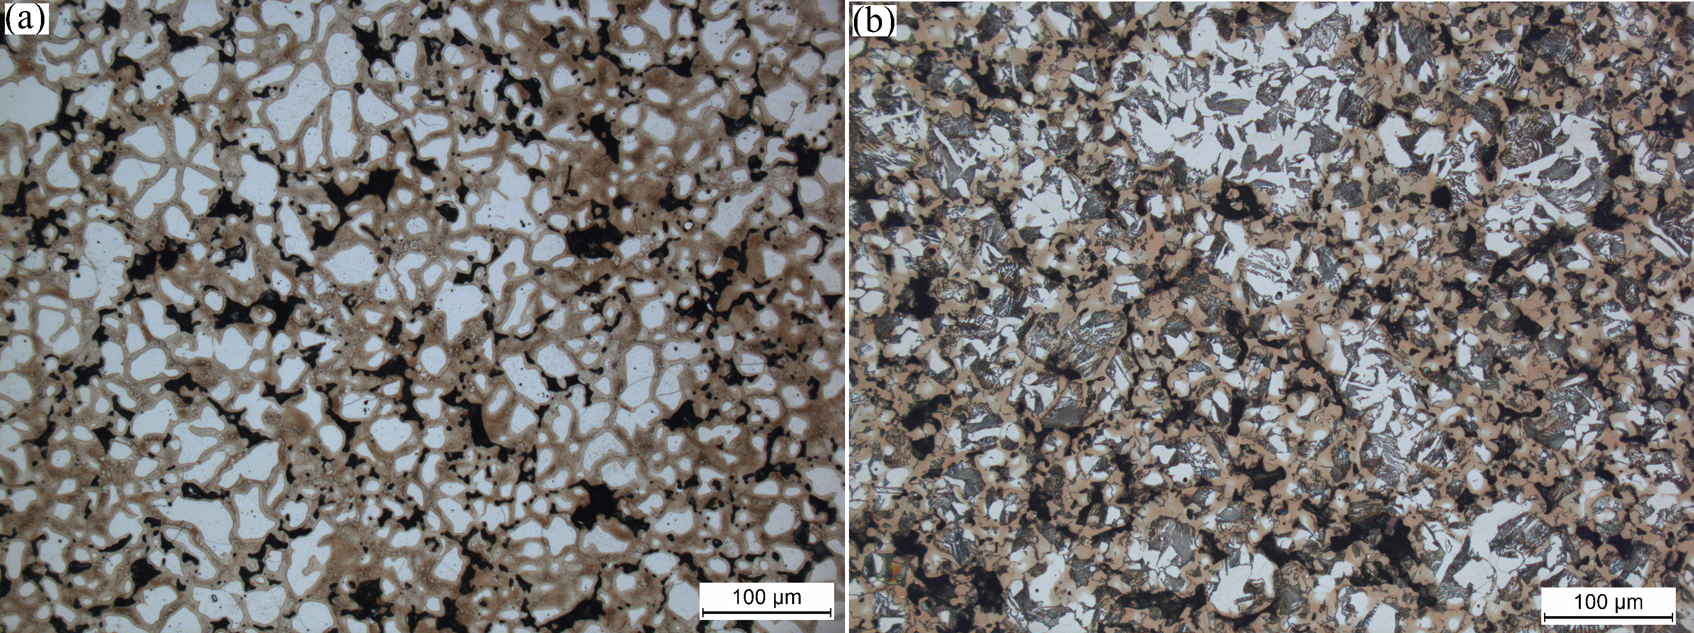
Figure 4 shows the microstructure of the samples sintered for 3 min at 1120°C (trial 3). Melted Cu has penetrated and diffused along the former particle boundaries as well as grain boundaries. The brown staining along the grain boundaries and on former particle boundaries indicates areas with high Cu concentration. Figure 5 shows the microstructure of the samples sintered for 33 min at 1120°C (trial 6). The alloying elements are more evenly distributed after the holding time of 33 min as compared to trial 3.
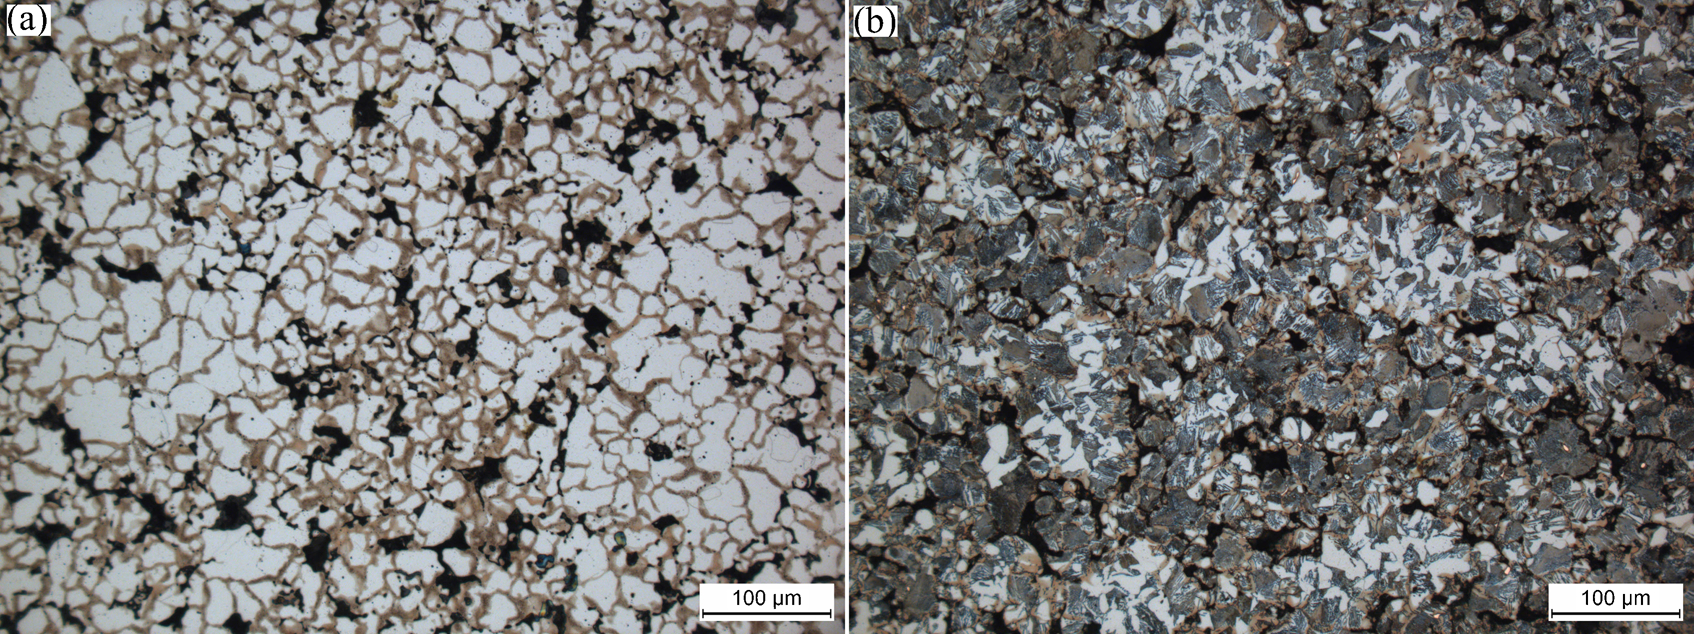
a Fe–2Cu; b Fe–2Cu–0·5C, pikral etched
a Fe–2Cu; b Fe–2Cu–0·5C, pikral etched
LOM images for trial 3 are of particular interest as they show the redistribution of molten Cu in the Fe matrix as it penetrates the Fe interparticle boundaries and also the effect of C addition. Figure 6 shows that no free Cu is present in the C-free system, while in the C added system, small areas of free Cu can be seen along the former particle boundaries. This suggests that in C-free system, the molten Cu is quickly transported through the Fe interparticle boundaries, and then Cu has enough time (before the cooling phase starts) to completely dissolve in Fe. However, in the case of the C added system, the presence of free Cu indicates that the penetration of molten Cu is delayed and subsequently the diffusion of Cu is delayed as well. In C added system, Cu-free grain boundaries can be seen especially in large Fe particles.
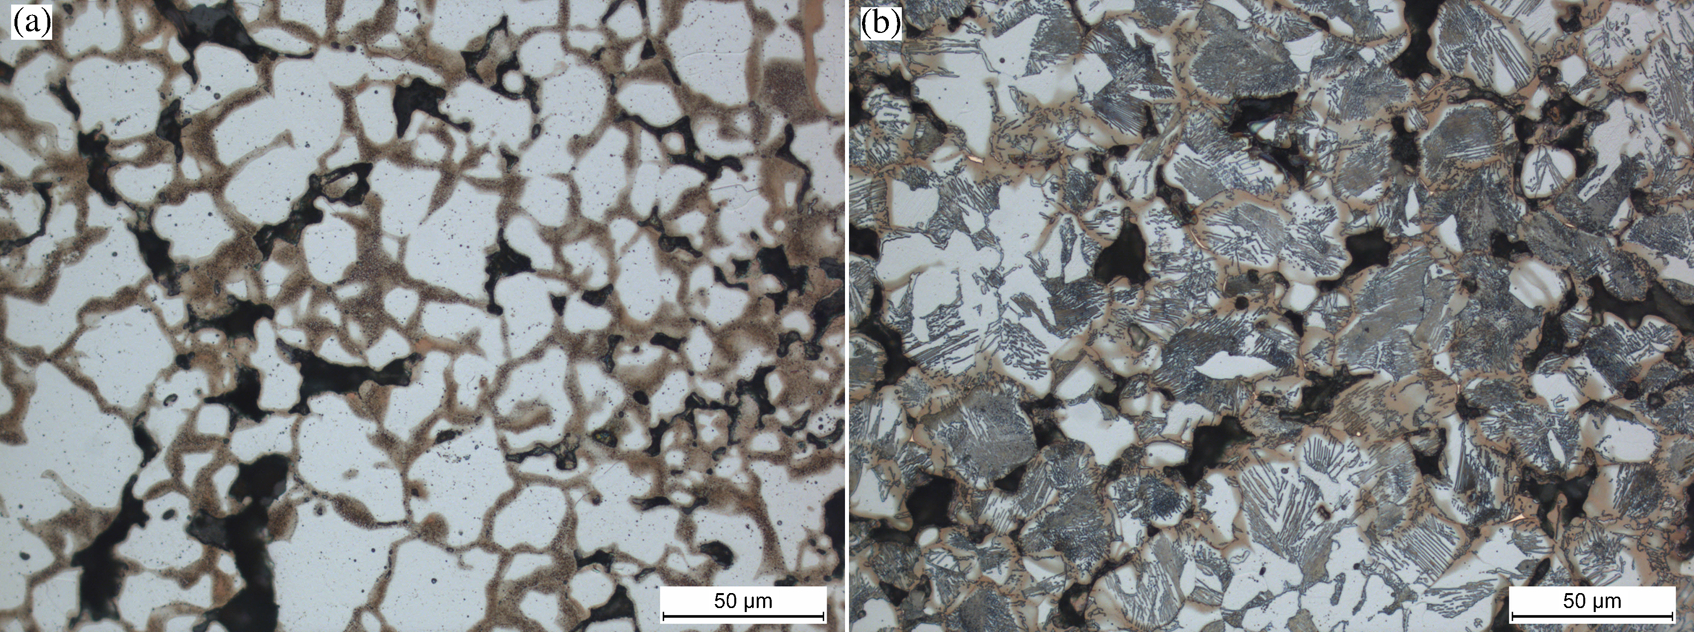
a Fe–2Cu; b Fe–2Cu–0·5C, pikral etched
Dilatometry
The effect of Cu and C additions on the dimensional variations of sintered compacts during sintering is shown in Figs. 7–9. The dilatometry results for trial 2 show variations in length below the melting point of Cu (Fig. 7). The curves show the elongation of the samples during the heating time; this elongation is accompanied by the α/γ-transformation. In the C added sample, the α/γ-transformation is initiated earlier than in the C-free sample because of C dissolution in Fe. C diffusion also results in relatively more expansion in the C added sample than in the C-free sample, once the phase transformation is completed.
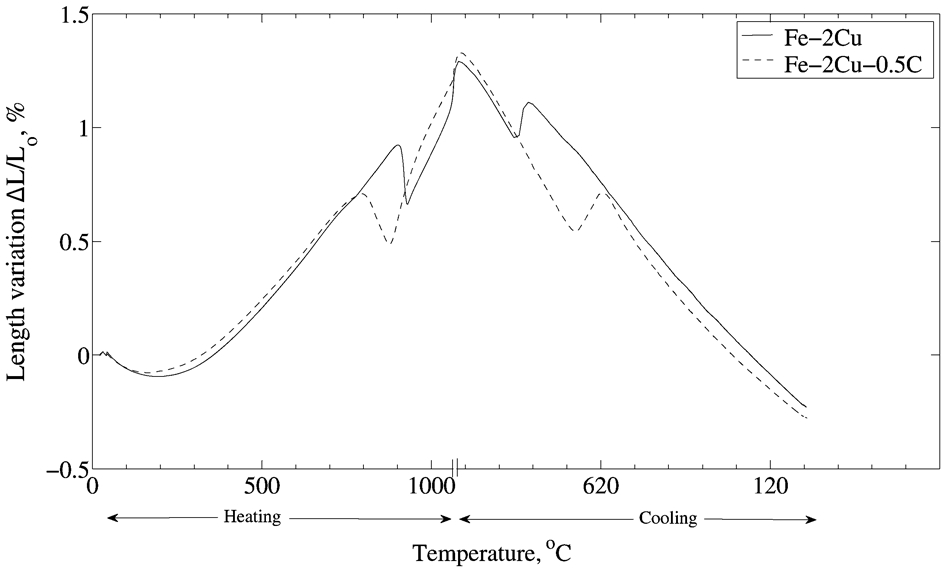
Dilatometry curves for Fe–2Cu (solid line) and Fe–2Cu–0·5C (dashed line) samples for trial 2
Dilatometry curves for Fe–2Cu and Fe–2Cu–0·5C samples for trial 3
Dilatometer curves for Fe–2Cu and Fe–2Cu–0·5C samples for trial 6
The dilatometry results for trial 3 are shown in Fig. 8. In trial 3, in which the sample was heated to 1120°C and then cooled down after holding for a short time (3 min), the effect of liquid Cu penetration on the sudden expansion of the samples can be isolated. The curves show that the C-free sample experienced lesser expansion than the C added sample before the melting point of Cu was reached but as soon as Cu melted, the volume expansion of C-free sample increased rapidly and crossed the expansion curve for the C added sample. The curves for trial 3 also show a time delay in the expansion peak of the C-added sample as compared to that for the C-free sample.
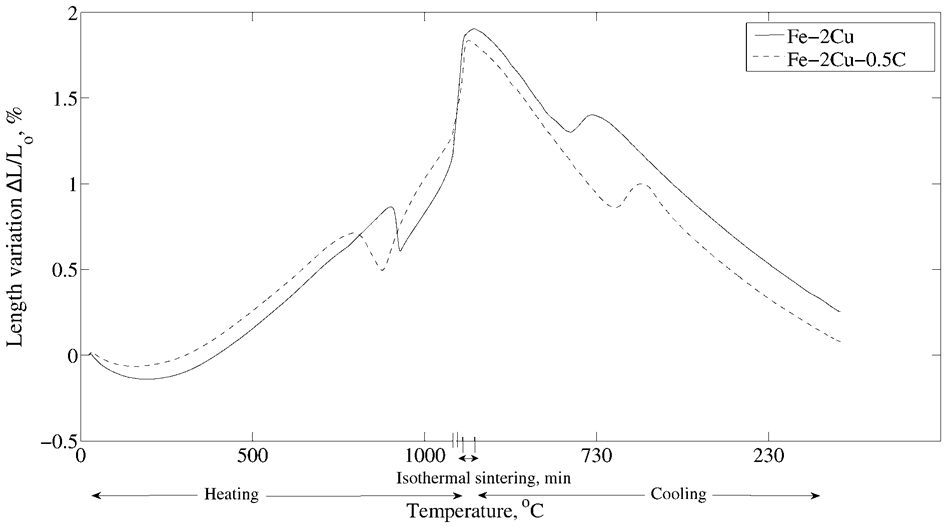
In trial 6, with a holding time of 33 min, expansion curves indicate that the sudden expansion after the melting point of Cu is followed by sintering shrinkage during the holding time (Fig. 9). The magnitude of the volume expansion peak, after the melting point of Cu, in the C-free sample is higher than in a C added sample. However, the sintering shrinkage rate, during the holding time, is slightly higher in C added sample compared to the C-free sample.
EDXS analysis
EDXS analysis is performed to investigate the Cu diffusion in γ-Fe, at Fe interparticle boundaries during sintering. Figure 10 shows a SEM image of the Fe–Cu system that is etched with 1% nital, and sintered for the holding time of 23 min. The dark grey areas indicate the ferrite region, while the bright areas show the Cu rich ferrite phase. The image shows a line marker (white line with arrow head) that is plotted across the Cu rich Fe interparticle boundary to measure the Cu diffusion distance. Multiple line scans are performed on each sample to measure the Cu diffusion distance in γ-Fe.
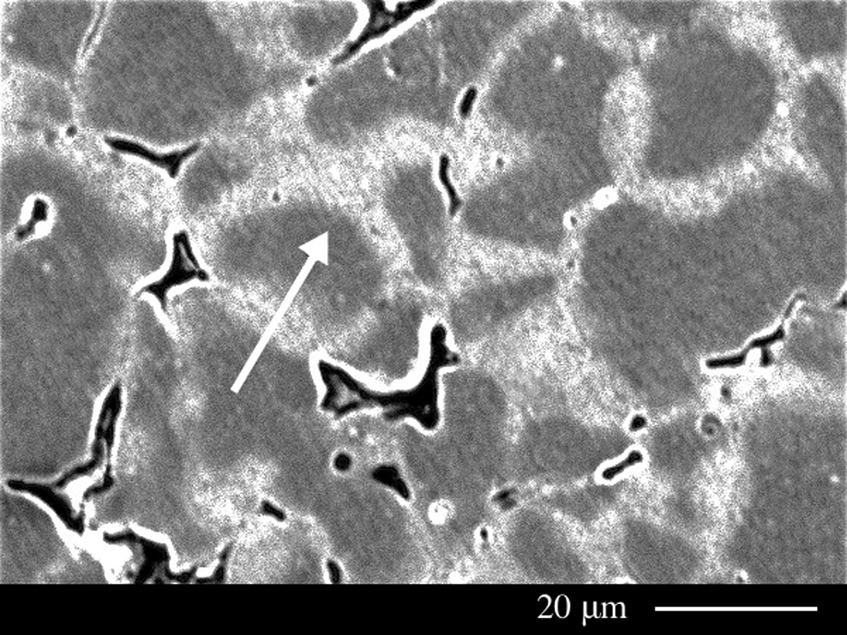
Representative SEM image for performing line scan: arrow is plotted across Fe interparticle boundary to measure Cu concentration profile
A representative plot of the Cu concentration profile at the Fe interparticle boundary is shown in Fig. 11. The following steps are performed to extract the Cu diffusion distance xd from the concentration profile. First, the EDXS concentration profile is fitted with the bell curve of the function
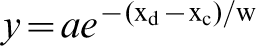
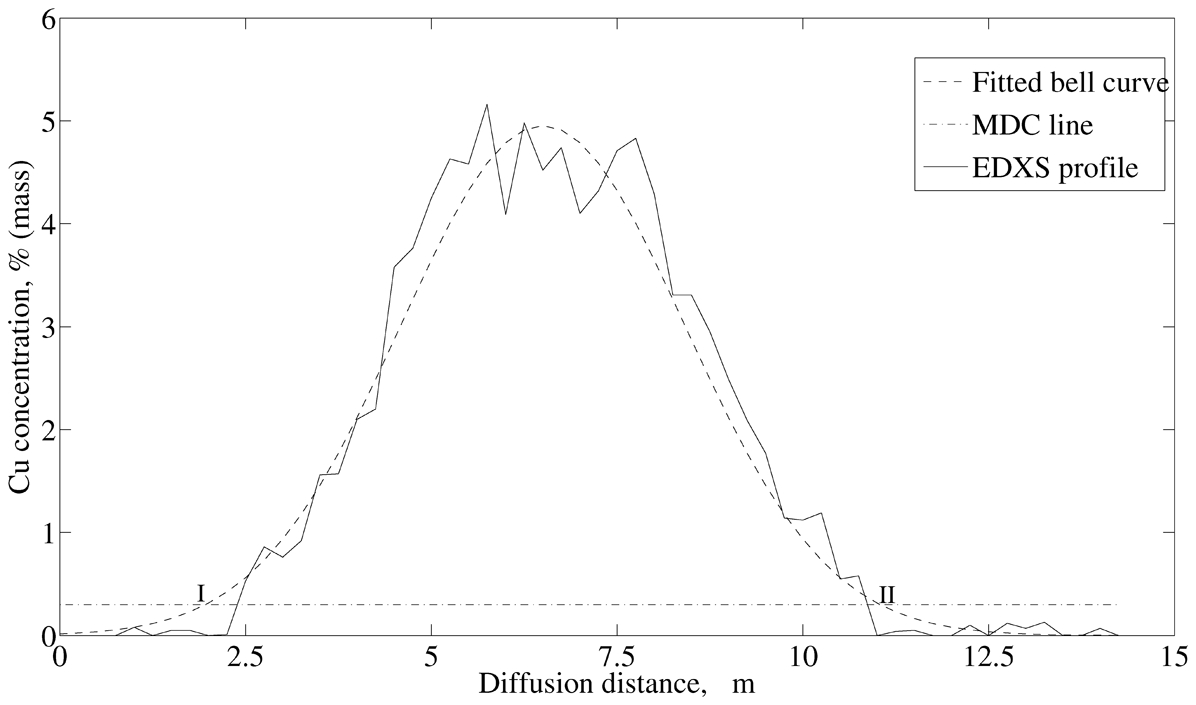
Cu concentration profile versus diffusion distance: diffusion distances were measured from centre of profile to 0·3 mass-%Cu; solid line shows EDXS measured Cu concentration profile; dashed line shows fitted bell curve to EDXS profile; dashdot line shows MDC of Cu
The initial results of EDXS analysis suggest that the diffusion distances in samples sintered below the Cu melting point (trial 1 and trial 2) are in the order of the probe resolution (∼1 μm). The LOM images of the etched samples also show that in trial 2, the solid state diffusion of Cu into Fe particles is unsubstantial. That is why attention is given to samples sintered above the melting point of Cu. Figure 12 illustrates the SEM/EDXS measured Cu diffusion distances in Fe at different holding times during sintering for Fe–2Cu and Fe–2Cu–0·5 systems. The error bars show a standard deviation of uncertainty around the mean value.
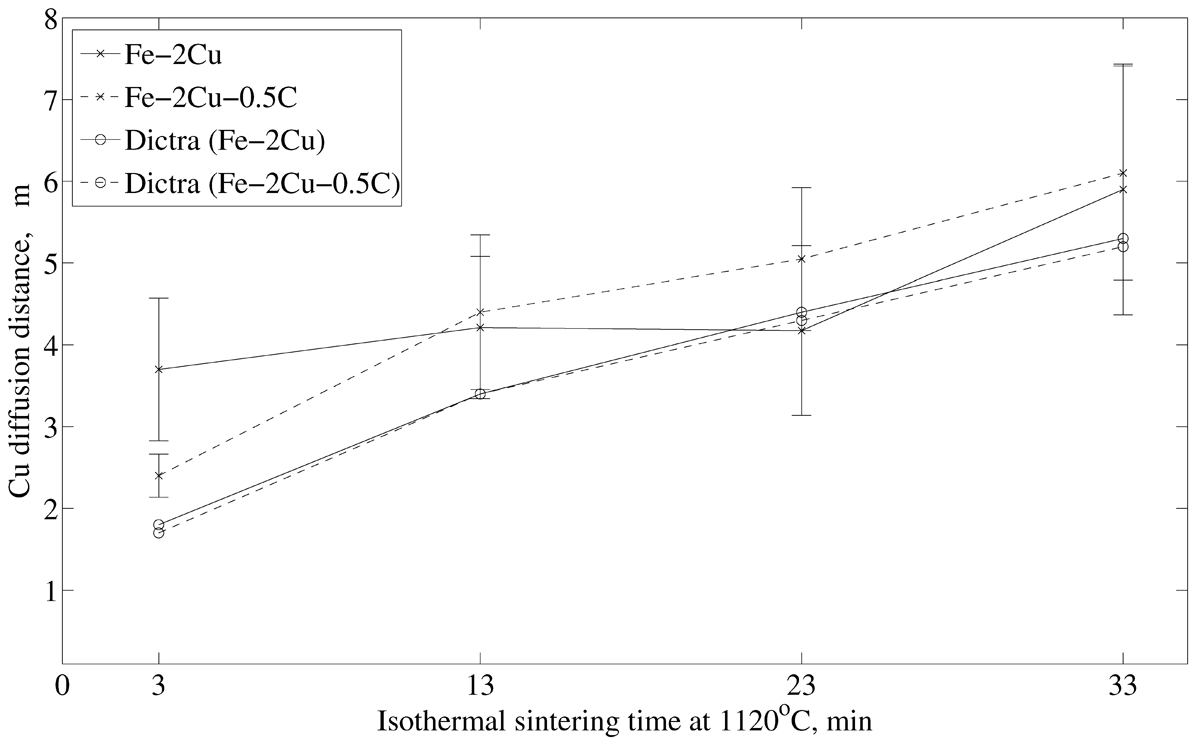
Cu diffusion distances in Fe for Fe–2Cu and Fe–2Cu–0·5C systems for holding times of 3, 13, 23, 33 min at 1120°C: lines with x-marks show EDXS measured results; lines with circles show Dictra results; set of 10 readings for every sample is used to calculate mean and standard deviation
The error bars show that the diffusion is not homogeneous in the sample, as it can be affected by various factors, e.g. position of Cu particle, etc. In both systems, there is an increase in the mean value of Cu diffusion distances with the increase in holding time as expected. The mean Cu diffusion distance in Fe for trial 3 is 3·7 and 2·4 μm for C-free and added system respectively. The final mean Cu diffusion distance in Fe for trial 6 is 5·9 and 6·1 μm for C-free and added system respectively. Therefore, the effect of C on the Cu diffusion is evident at trial 3 but as the isothermal sintering time increases the Cu diffusion distances are almost in the same range for both systems. In addition, there is a significant difference in the magnitude of error bars between C-free and added systems for trial 3.
Dictra simulations
The diffusion of Cu in γ-Fe and how it is affected by C addition is also investigated by performing Dictra simulations. The predicted diffusion distances at different times for both systems are obtained and plotted as shown in Fig. 12. The simulation results show that the diffusion distances of Cu in Fe and Fe–0·5C are equal. Which implies that the diffusion of Cu in Fe remains unaffected by the C addition. The comparison between experimental and simulation results is also illustrated in Fig. 12. The predicted diffusion distances at different holding times match very well with the experimental findings. There is a small deviation at the holding time of 3 min where the predicted diffusion distances are little less than the experimental. This might be the result of solid state diffusion below the melting point of Cu that is neglected in the simulations.
Discussion
LOM images of trial 3 show free Cu in the C added sample, whereas Cu is completely dissolved in the C-free sample. Almost all the Fe interparticle boundaries have been penetrated by molten Cu in both systems; the grain boundary penetration is not completed by molten Cu, especially in large Fe particles, in the C added system. Cu free grain boundaries in Fe particles indicate that C addition hinders the penetration of liquid Cu. This is in agreement with previous work,28,40,44 which states that the C additions result in higher wetting contact angle between liquid Cu and Fe–C as compared to the liquid Cu and Fe, and thus hinders the grain boundary penetration by the liquid Cu phase. While a recent work reports that the infiltration rate in Fe compact, by liquid Cu, is found to be more rapid than in Fe–C compact, where the complete infiltration is delayed possibly because of enhance dissolution. 45
Trial 3 involves sintering at 1120°C for 3 min, and the extent of liquid Cu penetration into Fe interparticle boundaries is fairly equal in both systems. Although the effect of C on the interparticle boundary penetration by liquid Cu cannot be seen, but the presence of free Cu in the C added system clearly suggests that C does hinder the molten Cu distribution. In the case of grain boundary penetration, the effect of C addition is easily detectable, as molten Cu is not able to fill in all the grain boundaries, especially in large Fe particles, in the C added system. The presence of free Cu at the junction of particle and grain boundaries also suggest that maximum possible grain boundary penetration is achieved until this time. This is supported by the observation that the unfilled grain boundaries in the C added system persist even till the holding time of 33 min.
Dilatometry results show that there is a sudden expansion just after the melting point of Cu is reached in the C-free system, while in the case of the C added system, the expansion peak is delayed both in time and magnitude. This can be explained on the basis of Cu redistribution.47,18,28 The C-free system allows rapid penetration of molten Cu into Fe interparticle and grain boundaries that produces sudden expansion, while the penetration is hindered by C addition, resulting in less and delayed expansion. This is supported by LOM findings that show the hindered and delayed redistribution of Cu in the C added system. The dilatometry results also show that the expansion peak because of liquid penetration is achieved in less than 3 min of holding time, which agrees with the LOM observations, showing that Cu redistribution by liquid penetration is achieved in less than 3 min of holding time.
The quantitative analysis of solid state diffusion of Cu in Fe at interparticle boundaries show that Cu redistribution by solid state diffusion becomes significant only after the melting point of Cu is reached. As the diffusion measurements of trials 1 and 2 show (not reported here) that Cu diffusion is less than 1 μm and is also localised around the Cu particles. However, after melting, the transient liquid phase initially distributes itself rapidly, which results in the increase in contact area between the liquid phase and Fe particles, and then solid state diffusion becomes important. The diffusion measurements show that the Cu diffusion distances are relatively higher in the C-free system than in the C added system. This is possibly because of the unhindered rapid distribution of molten Cu into Fe interparticle boundaries in the C-free system, while in the C added system, the liquid Cu penetration is delayed and thus the diffusion is lagging behind.
The standard deviation of Cu diffusion distances for the trial 3 is higher in C-free system compared to C added system. The same trend is found in the measurements from trials 4 to 6, although the difference in the deviation becomes insignificant until trial 6. This indicates that the Cu redistribution in the Fe interparticle boundaries is relatively more homogeneous in C added system compared to C-free system for the trial 3, but as the sintering progresses the Cu redistribution at the interparticle boundaries becomes similar in both systems.
In the C-free system, approximately 65% of the final (trial 6) mean Cu diffusion distance is achieved within 3 min of holding time (trial 3), compared to the C added system, where it is 40% of the total mean Cu diffusion distance. However, still the final mean diffusion distances of Cu in both systems are almost the same. The LOM investigations support these findings; the molten Cu distribution is rapid and all the Cu is readily diffused at interparticle boundaries in C-free system, as no free Cu is found in trial 3. This limits the supply of molten Cu and thus lowers the diffusion rate. But in C added system the hindered Cu redistribution delays the availability of molten Cu, which results in lower initial diffusion distances, but the pockets of free Cu maintains the supply of Cu and hence the final diffusion distances in both systems are similar.
The predicted (Dictra) diffusion distances of Cu in γ-Fe show that C addition (0·5 mass-%) does not affect the solid state diffusion of Cu. These results support the argument that in C added system the lesser Cu diffusion in Fe is the result of hindered Fe interparticle boundary penetration by liquid Cu, which in turn delays the availability of liquid Cu for solid state diffusion of Cu in γ-Fe. This is in agreement with the EDXS results for trial 3, where C added system has lower mean diffusion distance of Cu in Fe compared to C-free system because of hindered liquid Cu distribution.
Conclusions
The rapid Cu redistribution by liquid penetration results in compact swelling, and C addition helps in reducing the expansion by hindering the liquid Cu penetration, particularly into the grain boundaries of large Fe particles.
The distribution of liquid Cu into Fe interparticle/grain boundaries is achieved in less than 3 min of holding time at 1120°C. Moreover, half of the final mean diffusion distance of Cu in Fe particles is achieved in the C-free system, while slightly less than half of the total mean diffusion distance is achieved in the C added system.
The mean diffusion distance of Cu in Fe particles is relatively higher in the C-free system than that in the C added system after 3 min of holding time, but the final mean diffusion distance after 33 min of holding time is found to be similar in both systems.
Diffusion (Dictra) simulations show that the solid state diffusion of Cu in Fe remains unaffected by the C addition. This supports the argument that the delayed penetration of Fe interparticle boundaries by liquid Cu in C added system is responsible for the lesser diffusion distances of Cu in Fe.
Footnotes
Acknowledgements
This work was performed within the VINN Excellence Center Hero-m, financed by VINNOVA, the Swedish Governmental Agency for Innovation Systems, Swedish industry, and KTH Royal Institute of Technology. The authors are grateful to Hans Söderberg (formerly at Swerea KIMAB and now at Sandvik AB) for performing the sintering trials, Joakim Odqvist (KTH) for support in Dictra simulations, and Grosser Heike (Höganäs AB) for assistance in microstructure analysis.