
Abstract
The final shape of powder metallurgy hot isostatic pressing (HIP) components is determined by many factors, including the shape and size of the capsule, the initial density distribution of the powder before HIP, and HIP process parameters. Current HIP simulation, which usually assumes that the powder inside the capsule is homogeneous, cannot predict non-uniform shrinkage. Therefore, the purpose of this work is to develop a methodology to quantitatively determine the initial powder density distribution inside HIP capsules, which were precompacted by different techniques. The relative density distribution obtained from experimental work is used as the initial condition for numerical simulations. The final shapes of the capsules produced by HIP are compared to simulation results. The paper shows the sensitivity of the final shape on the initial powder density distribution and illustrates the need to implement the initial powder distribution into the finite element model to improve the quality of the near net shape HIP simulation.
Keywords
List of symbols
Dorn's constant
Porosity coefficient
Porosity coefficient
Creep exponent
Relative density of the powder
Initial relative density of the powder
von Mises stress
Deviatoric stress tensor
Temperature

Creep plastic strain rate
Kronecker Delta
Equivalent stress for the porous material
Cauchy stress tensor
Hydrostatic stress
Introduction
Near net shape hot isostatic pressing (HIP) simulation has been used for a long time in order to reduce development costs and design time. Many different constitutive densification models and simulation tools have been reported. Most of the publications show that good agreement between numerical simulation and experiments can be obtained, but so far, no summarising comparison of the results of the different finite element model (FEM) simulations was given. 1 In theory, the hot isostatically pressed components should have isotropic shrinkage under isostatic pressure, but in practice, this is often not the case. Non-uniform shrinkage of components and even high distortion (Fig. 1) have been observed, which is not predictable with the current FEM simulation method because the models assume that the powder distribution inside a capsule before HIP is homogeneous. Anisotropic shrinkage has been observed and verified in the sintering process for cases in which the powder body was not homogeneous. An inhomogeneous body has been created artificially from two powder layers. 2 The bilayer powder compact was bent after sintering toward the lower relative density (RD) side. In the HIP process, pressure and temperature are combined to achieve a full density material at a lower temperature than would be required for sintering alone. Moreover, not only the initial powder distribution, but also capsule shape, size and thickness, and the process parameters pressure and temperature will have influence on the final shape of hot isostatically pressed components. Therefore, the influence of an inhomogeneous powder distribution on the final shape of hot isostatically pressed components can differ from its influence on pressureless sintered components.
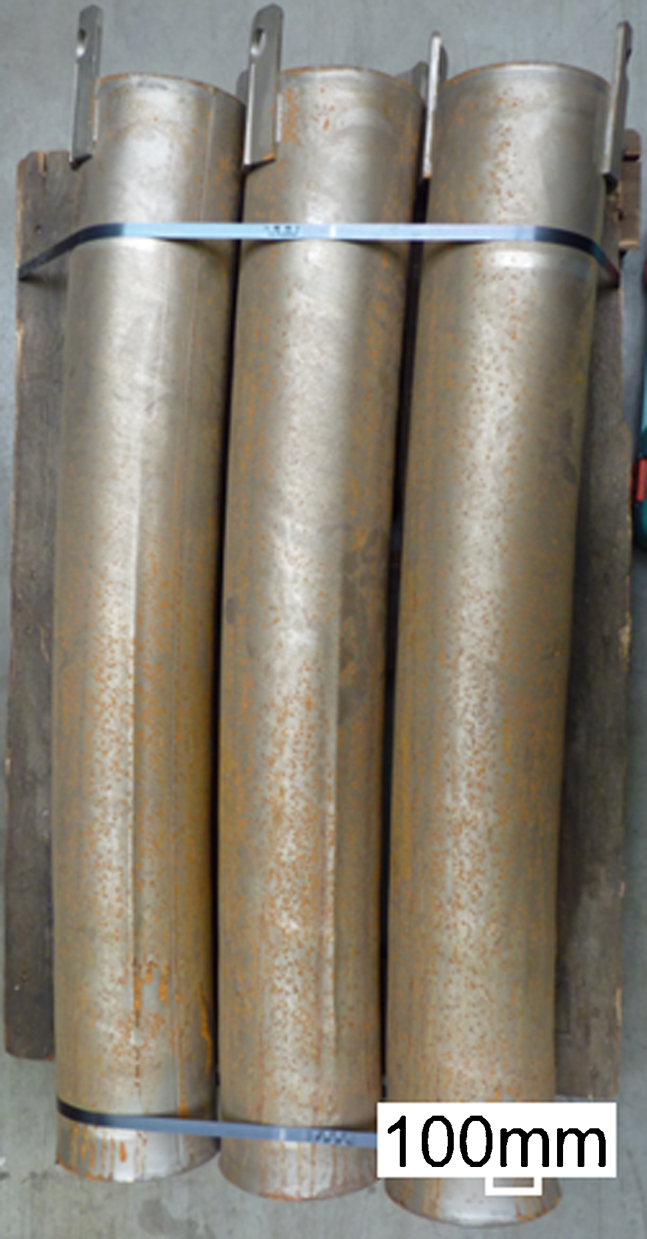
Bended tubes after HIP
The results of previous studies 3 show that an initial inhomogeneous powder distribution after preconsolidation (tapping or vibration of the filled capsules before HIP) results in anisotropic shrinkage or even high distortion (bending) for HIPed tubes as shown in Fig. 2, which is similar to the case of sintering. The hot isostatically pressed capsule bent toward the side, which has lower RD. These simulation results were based on the assumptions that three types of RD gradients might have appeared after a preconsolidation process, namely, an axial gradient (Fig. 2a), a horizontal plan gradient (Fig. 2b) and an inclined gradient (Fig. 2c).
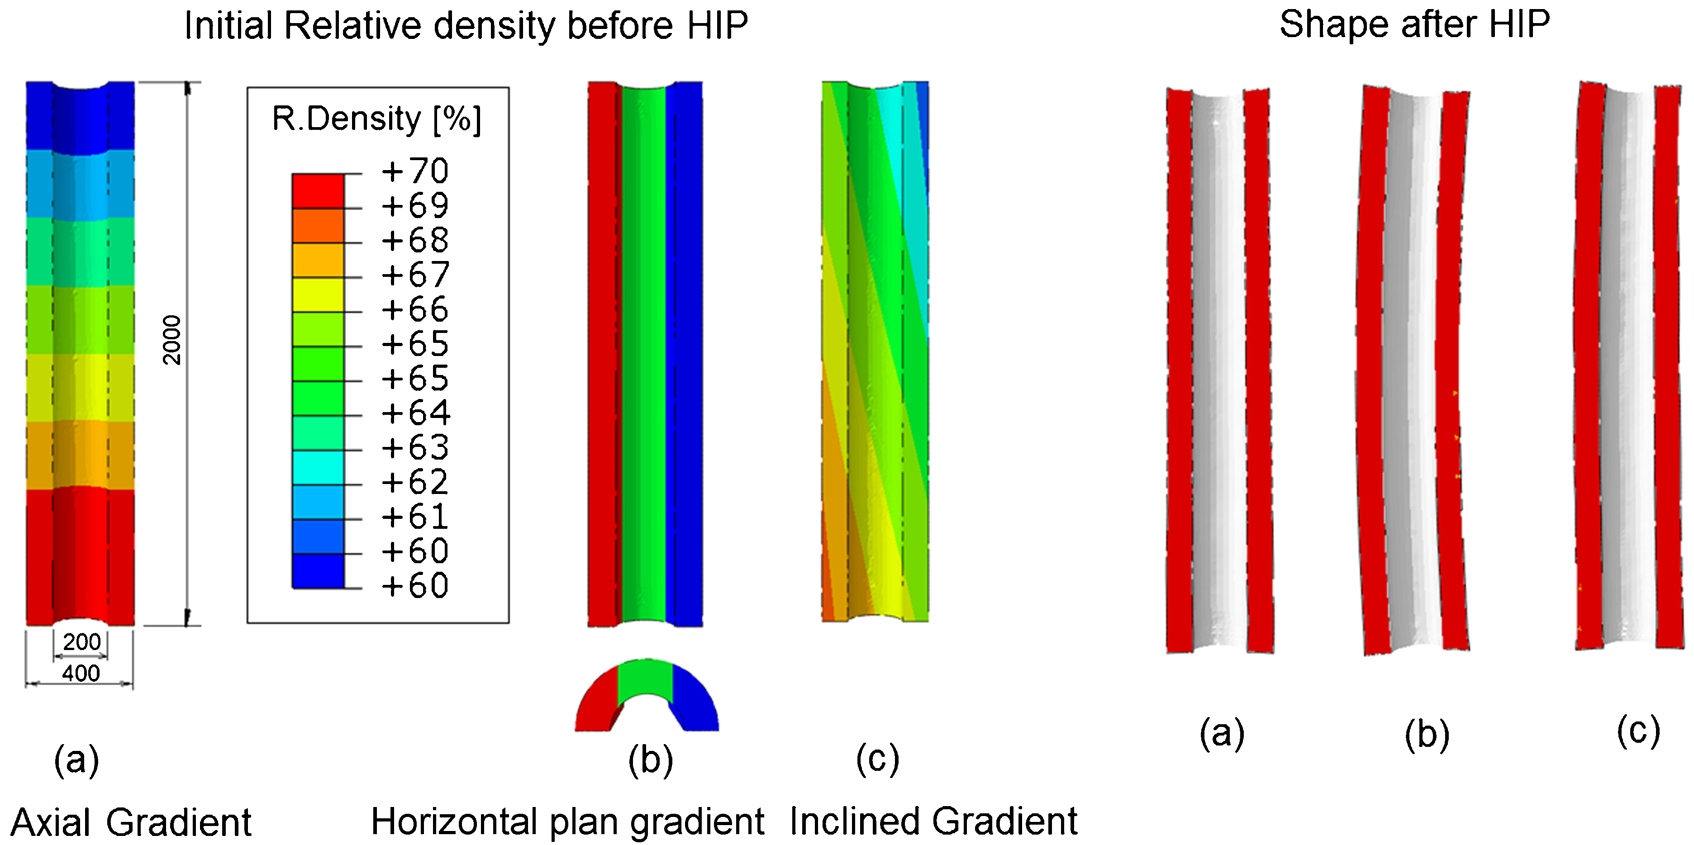
Deformation of hot isostatic pressed tubes with three assumption initial powder distributions; a final shape of tube having axial RD gradient, b final shape of tube having horizontal plan RD gradient, c final shape of tube having inclined RD gradient
The horizontal plan gradient and inclined gradient for a long tube can cause bending of the hot isostatically pressed component. Therefore, the motivation of this study is to further investigate the influence of an inhomogeneous powder distribution on the deformation behaviour of the capsule during HIP. Particularly, RD gradients in radial and inclined directions will be discussed as they have a high influence on the final shape of a long cylindrical component.
In the following, the preconsolidation process, characterised by vibration frequency, vibration time, number of refilling cycles, number of tapping steps, etc., will be varied in laboratory experiments in order to observe their influence on the powder distribution. An experimental methodology, which is based on image analysis (IA), to determine the RD and RD gradient will be developed. The outcome of this experimental work will be used to determine the initial boundary conditions for a FEM model in order to calculate the shrinkage of a component during HIP.
Experimental procedure
Powder
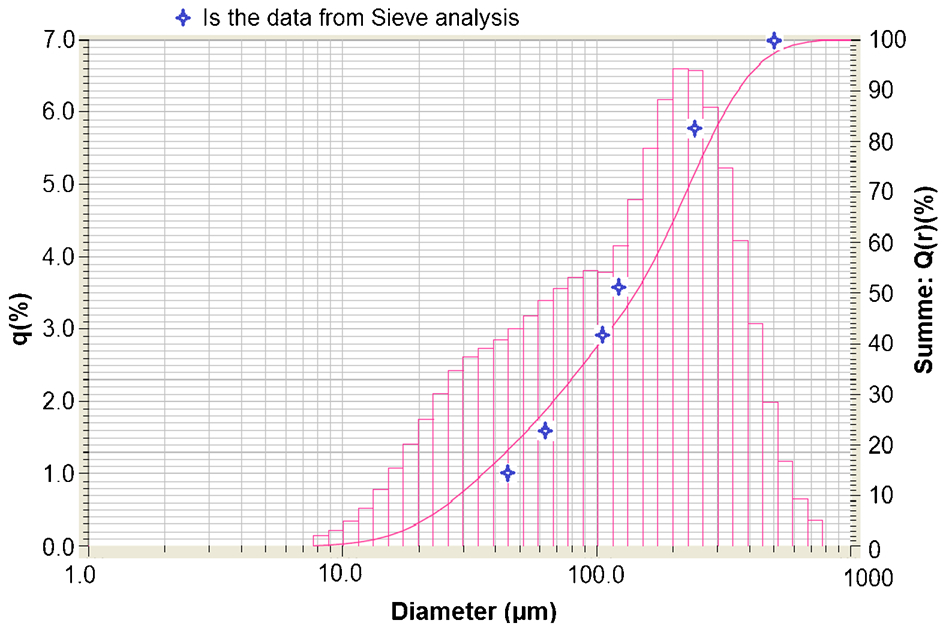
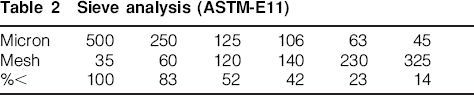
Gas atomised stainless steel powder of grade 316L, which is often used for the production of near net shape components by encapsulated HIP, is used for the investigation. The powder particles’ size covers the range from 3 to 500 μm. The chemical composition of the material is shown in Table 1, and the particle size from sieve analysis is shown in Table 2. All powder properties such as particle shape, mean particle size and particle size distribution have influence on the average RD and density distribution after powder filling and preconsolidation, because the particles separate due to size differences during flow and settling in the container. The powder used in this study has a mean particle size of 140 μm as shown in Fig. 3
Powder particle size distribution (Laser Scattering Particle Size Distribution Analyzer LA 950)
Chemical composition of powder 316L

Sieve analysis (ASTM-E11)
As seen in Fig. 3, there are some differences between the data obtained by Sieve analysis and laser scattering particle size distribution analyser. Further study will be continued to find the reason of these discrepancies.
Powder filling and preconsolidation process
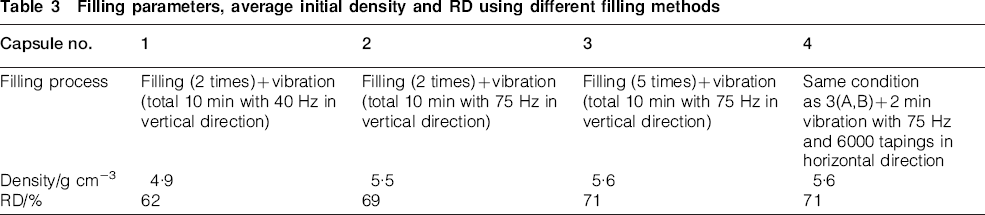
Capsules with a sheet thickness of 1·5 mm, made of 304 stainless steel and assembled using TIG welding, are used. The inner diameter is 41·5 mm, and the height is 180 mm. Two capsules were filled with 316L powder, which continuously flowed from a Hall flowmeter (ASTM B 212) into capsules. Subsequently, the powder was compacted by vibration using a RETSCH Vibro.66626 device for 5 min with a frequency of 40 Hz. Subsequently, the capsule was refilled and vibrated for another 5 min with the same frequency (no. 1). Two capsules were filled and vibrated using the same process as capsule series no. 1 but with a frequency of 75 Hz (no. 2). Two other capsules were filled five times and were compacted in between by vibration with 75 Hz for 2 min (no. 3). Total vibration time for these capsules (no. 3) was 10 min. All six capsules mentioned above were filled and vibrated in vertical direction. The last two capsules were filled and vibrated, with the same procedure as given under (no. 3), in vertical direction at the first step. After that, the capsules (no. 4) are sealed temporarily using a small ceramic part and glue in order to avoid powder particles flowing out of the capsules when they are laid horizontally. After sealing, these capsules were vibrated again for 2 min and then tapped 6000 times using a tapped density tester (STAV 2003) in horizontal direction. The average density of the powder inside the capsules is calculated from the weight of the powder and volume of the capsule (mass/volume). The average RD of the powder inside the capsules is the ratio between this density and the theoretical density of the dense material, which is 7·93 g cm3 for this powder.
The values of the average density and RD of all capsules are shown in Table 3. In order to analyse the density distribution within the capsules, one capsule of each filling procedure has been prepared for IA (see ‘IA to measure RD’ section). The remaining capsules have been hot isostatically pressed in order to investigate the final shrinkage.
Filling parameters, average initial density and RD using different filling methods
IA to measure RD
To analyse the density distribution in the capsule, the powder particles need to be kept in place during preparation for metallographic investigations. The arrangement of powder particles has to be ‘frozen’ in order to make it applicable for methods of IA. Therefore, a presintering step was introduced in order to build up weak connections between the individual particles. By using a sinter temperature of 1050°C and a holding time of 30 min, overall shrinkage was minimised, and therefore, it will be neglected in further analysis. After sintering, the capsules were partly opened by drilling holes into the capsule sheet. The powder arrangement thereafter was infiltrated by a mixture of EpoFix resin and EpoFix hardener at a mixing ratio of 18·7∶2·4. After this preparation, the capsule was cut in two pieces along a radial–axial plane. Then, the regions of interest were cut into smaller pieces. The samples were further grinded and polished. A microstructure of the powder before HIP can be seen in Fig. 4. The main steps necessary for IA are image capturing, image storage, segmentation of objects and image measurements. Digitisation is done by a digital camera. For an optimal discrimination between different objects or features in an image, uniformity of illumination in the whole image had to be ensured, 4 and therefore, the sharpness and brightness of all photos had to be carefully controlled.
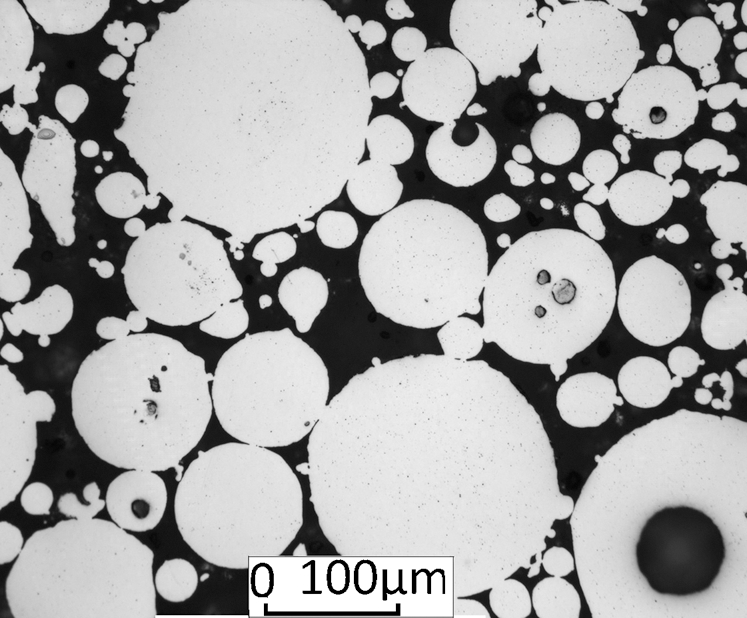
Microstructure of powder before HIP (light optical micrograph)
The microstructure of the sample was recorded after polishing. A light optical microscope of type Leica DM4000M with ProgRes3012 camera was used. A magnification of 100∶1 was used to analyse the microstructure. The porosity and material can be easily distinguished as they have different colours in the microstructural image (Fig. 4). Twelve subareas (measured points) per cross-section as shown in Fig. 5 are used for the analysis. This is the minimum requirement to get a good representation of the RD gradient inside a cylinder capsule. Each subarea has a 6 mm height and a 5 mm width. A number of 120 photos have been taken and assembled in order to get a microstructural view of the powder distribution in each subarea. The RD has been calculated automatically when the theoretical density is given.
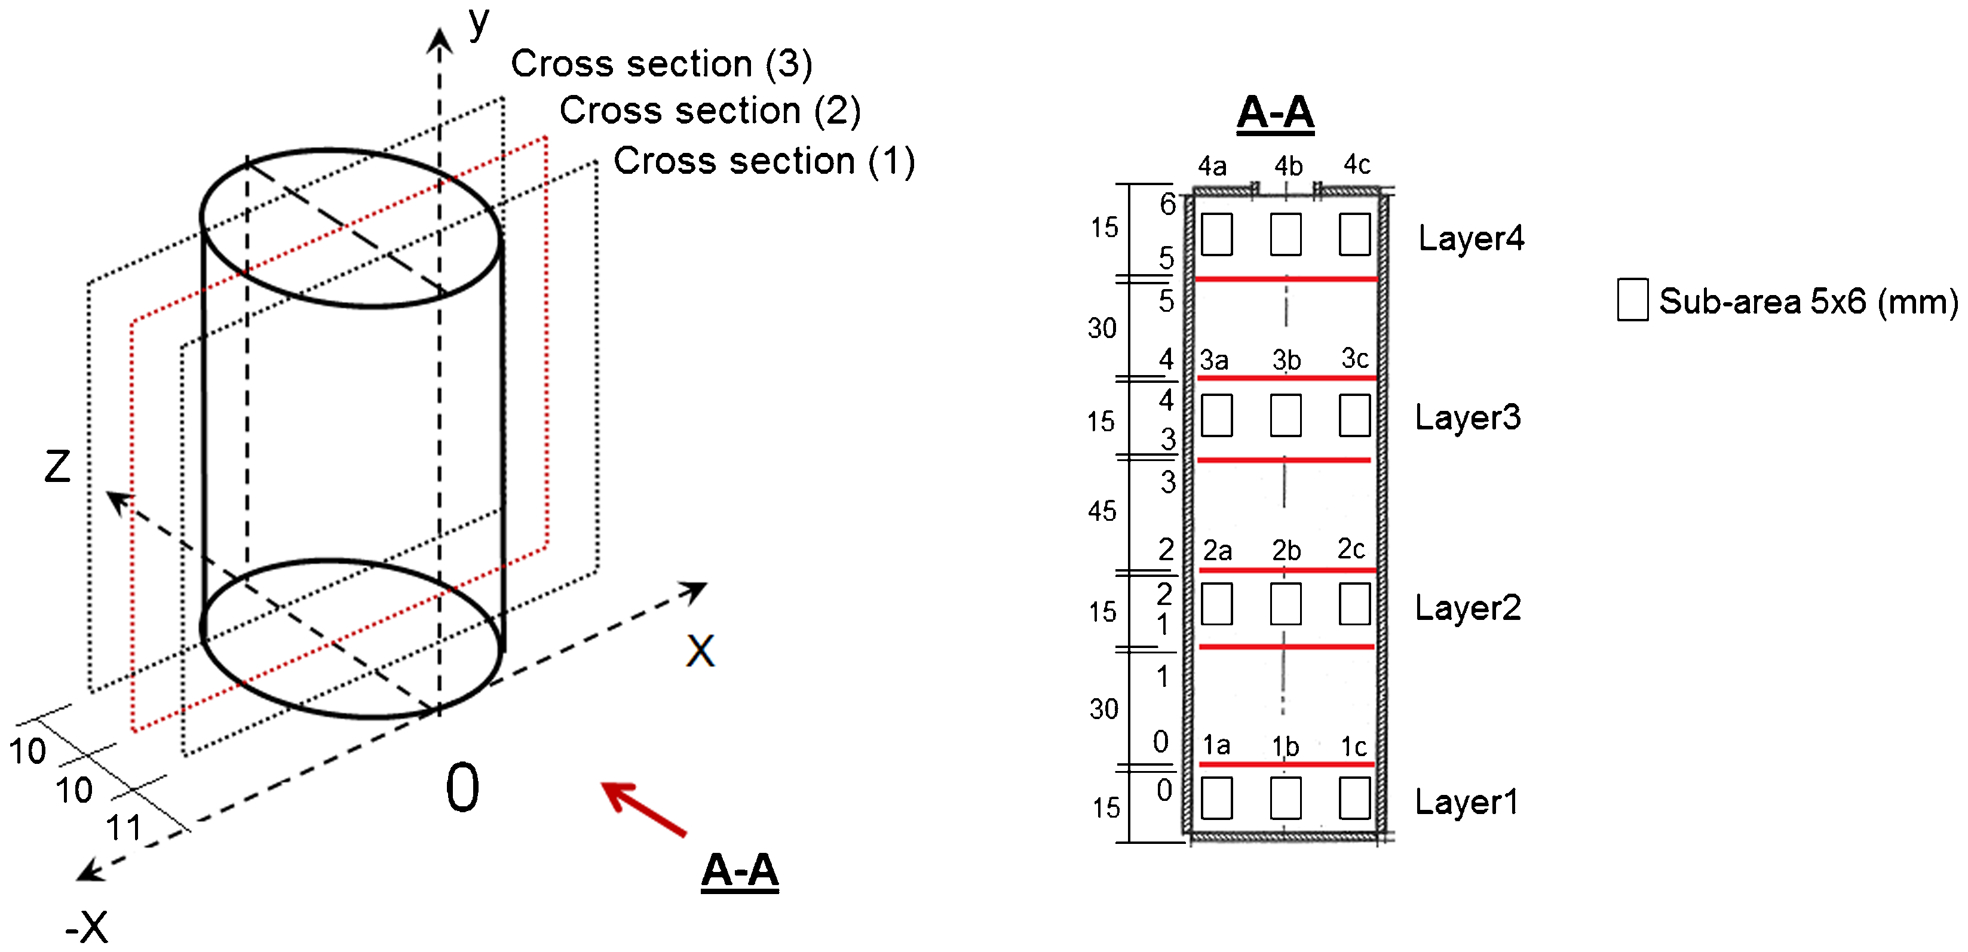
a three cross-section will be analysed; b measured points (subwindows) for each cross-section
After filling, all capsules were vibrated or tapped in order to get a higher compaction. Powder particles are assumed to distribute with a rotational symmetry around the middle axis of the capsule after filling and tapping because the driving force to make the rearrangement is gravity and axial acceleration force. During the vibration, powder particles are convectionally rearranged as shown in Fig. 6. This phenomenon was visually observed through a transparent glass capsule when different layers of powder with different colours were vibrated with the vibration machine. Powder particles went up on one side and flowed down on the other side, leading to the assumption that the powder is symmetrically distributed across cross-section 2. Therefore, cross-section 2 of each capsule was the only one explicitly analysed in this study.
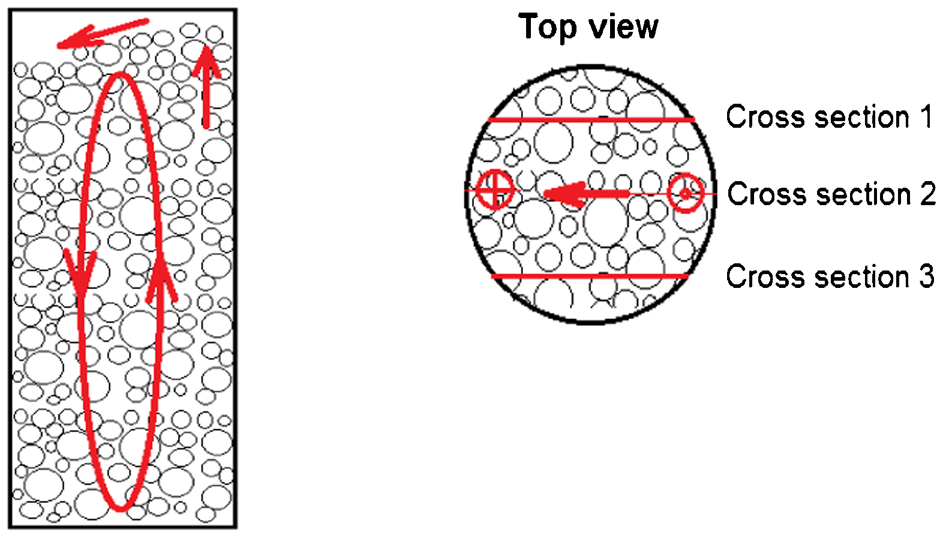
Powder particles rearrange during vibration
Density distribution in capsule before HIP
As discussed above, only 12 small subareas for each cross-section as shown in Fig. 5b were measured. The RD at other positions was calculated by linear interpolation. The contour of the RD distribution at the middle cross-section of four capsules is shown in Fig. 7. As seen from Fig. 7, all capsules have an inhomogeneous powder distribution. The RD values of all capsules are in the range of the average RD values, which was determined previously in Table 3. The RD distributions of the four capsules are different because they were filled and preconsolidated by a different method. Capsule no. 1, which was filled and vibrated with low frequency (40 Hz), has the lowest average RD, and the RD distribution is quite homogenous compared to other capsules. Capsule nos. 2 and 3 were vibrated with the same frequency (75 Hz), but the filling of capsule no. 3 was done in five time intervals; thus, the average RD is higher. It also resulted in different powder distributions. Capsule no. 2 has the highest RD at the bottom (Fig. 7b), and contrarily, capsule no. 3 has the highest RD in the middle-top region (Fig. 7c). The RD of capsule nos. 2 and 3 was distributed in an inclined direction as shown in Fig. 2c. Capsule no. 4 was prepared first using the same procedure as that for capsule no. 3 and, afterwards, vibrated and tapped in horizontal direction. Thus, a horizontal plan gradient as shown in Fig. 2b is observed here in Fig. 7d. RD value on the right side (the bottom side when vibrated and tapped in horizontal direction) has a higher value on the left side (the top side).
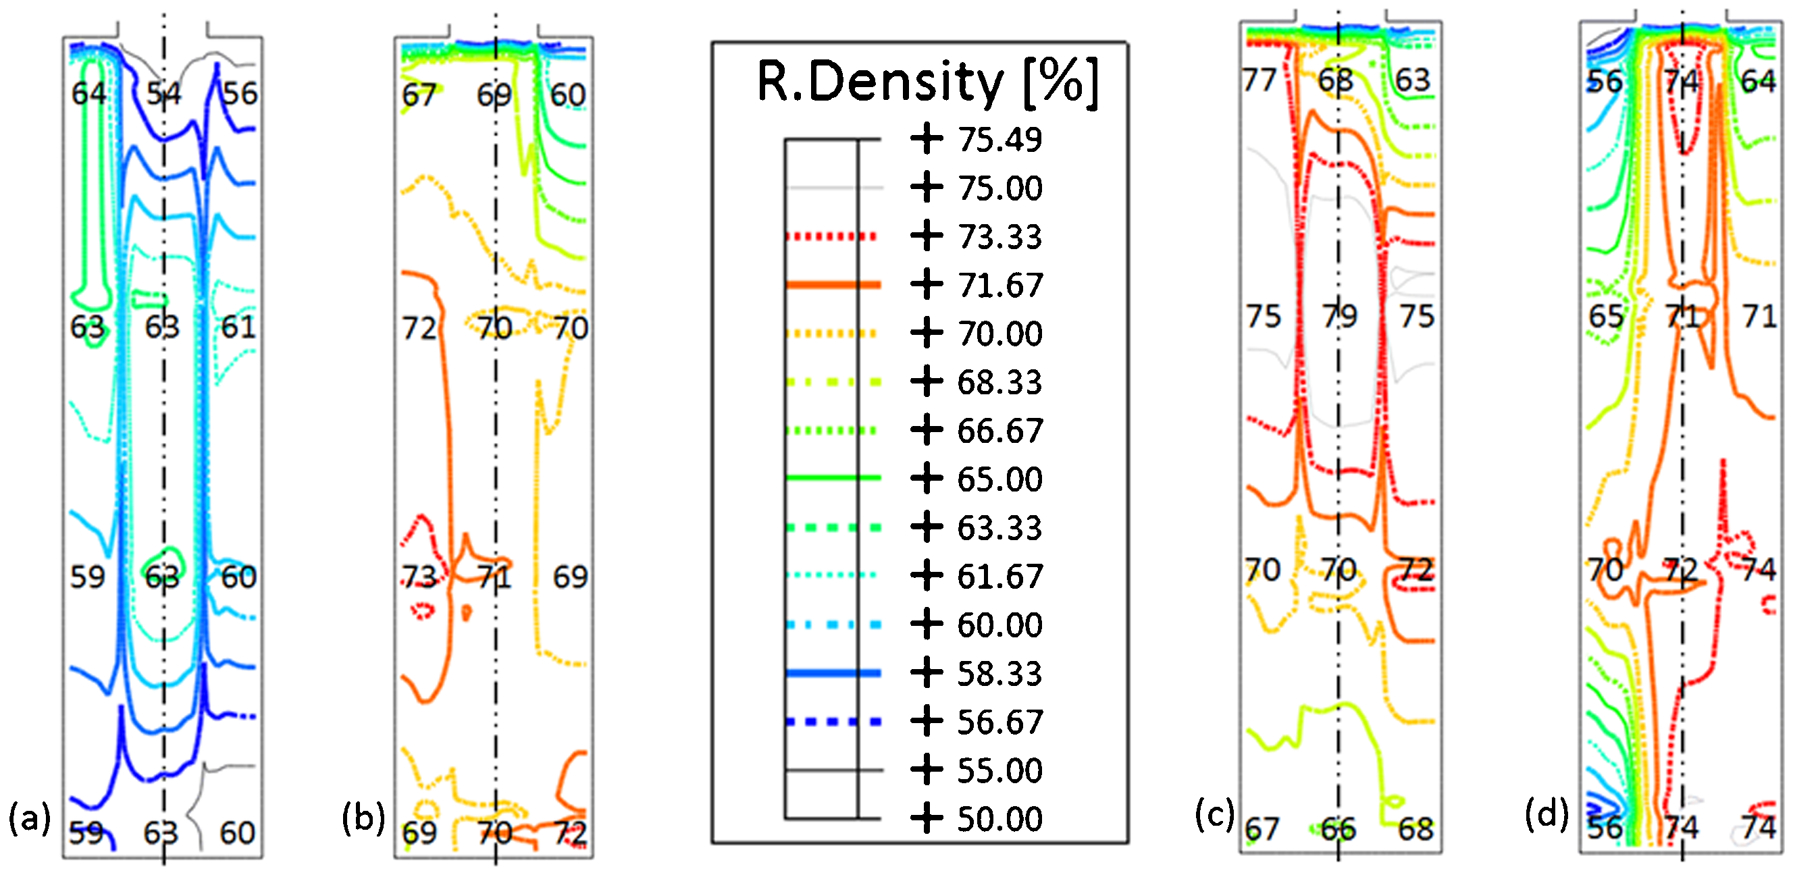
RD distribution at middle cross-sections of a capsule no. 1, b capsule no. 2; c capsule no. 3 and d capsule no. 4
Numerical simulation
Densification model and material parameters
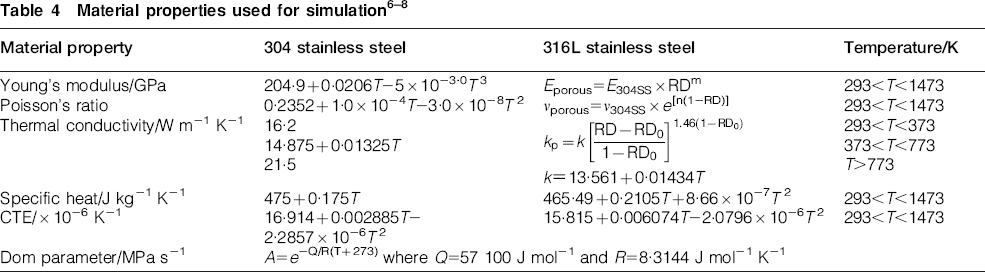
As summarised in Ref. 1, there are two different approaches to simulate the densification process during HIP: micro- and macroapproach. The first approach deals with the assembly of individual particles. The various mechanisms of densification such as power–law creep, Nabarro–Herring and Coble creep, diffusion, and grain growth are analysed in terms of a single particle and its contact with surrounding particles. The total rate of densification was obtained by combining the rate equations of the individual mechanisms. In the macroapproach, in contrast to the microapproach, it is assumed that the powder compact behaves as a continuum body containing porosities. Therefore, the general plasticity theory for solids is modified for a porous continuum and a constitutive equation is constructed that relates the strain increment to the stresses. Coefficients for the constitutive equation have to be determined experimentally.
The microapproach unites the material properties and processing parameters into an analytical rate equation, which is related to the microphysical mechanisms. Subsequently, it is relatively easy to estimate their roles in the hipping process, which can conveniently be modified to take into account new densification mechanisms. However, the micromechanical analysis is based on many assumptions to reduce the complexity of the problem, such as the assumption of homogeneity of particle size and the assumption of steady stage of temperature and pressure. Moreover, microapproach does not relate strain and strain rate to density and density rate. This feature of the model makes it difficult to predicate the shape change of a complex component.1,5 On the other hand, the macroapproach can predict the shape changes and is convenient to use for complex geometrical components, as it has fewer parameters compared with the microapproach. Furthermore, results from Ref. 6 show that micromechanical analysis based approaches usually give less accuracy. As the main focus of this study is to predict the shape changes of hot isostatically pressed components, the macroapproach is chosen. Among many different models, the densification model suggested by Abouaf et al. 7 is the most popular one. Abouaf et al.'s model is based on the assumption that the inelastic deformation during HIP is composed only of time dependent plastic deformation (viscoplastic). Although later studies have proved that the viscoplastic model is not satisfactory in many cases and improvement of constitutive densification is required to improve the quality of HIP simulation, they also confirmed that the viscoplastic densification model can correctly predict the final stage of the densification (75–100%).9–11 Moreover, the parameters of Abouaf et al.'s viscoplastic model for 316L stainless steel powder have been completely identified. Therefore, the Abouaf et al. model will be used in this study.
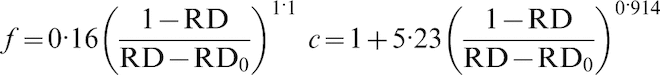
Assuming that the viscoplastic work of the matrix material is the same as that of a porous material, Abouaf et al. suggested the creep strain rate for porous material as described in equation (1)
 is the creep strain rate;
 ; c and f are known as porosity coefficients obtained by conducting uniaxial compression tests on fully dense material and on porous samples. These parameters suggested by Abouaf et al. for 316L powder are functions of RD as shown in equation (3). They do not have universal worth
FEM model and boundary condition
As mentioned earlier, the powder is assumed to be distributed symmetrically across the middle cross-section 2 (Fig. 7); thus, half of the three-dimensional (3D) FEM model has been created as shown in Fig. 8. A mapped mesh with an element size of ∼2 mm has been used. An in house MATLAB code has been developed to read the RD values from an Excel file (from IA measurement) and assign the values to the corresponding elements of the FEM model. Moreover, some nodes are fixed in order to avoid rigid body motion. A HIP profile with a holding temperature of 1125°C and a pressure of 110 MPa held over 4 h as shown in Fig. 9 is used for simulation and experiment.
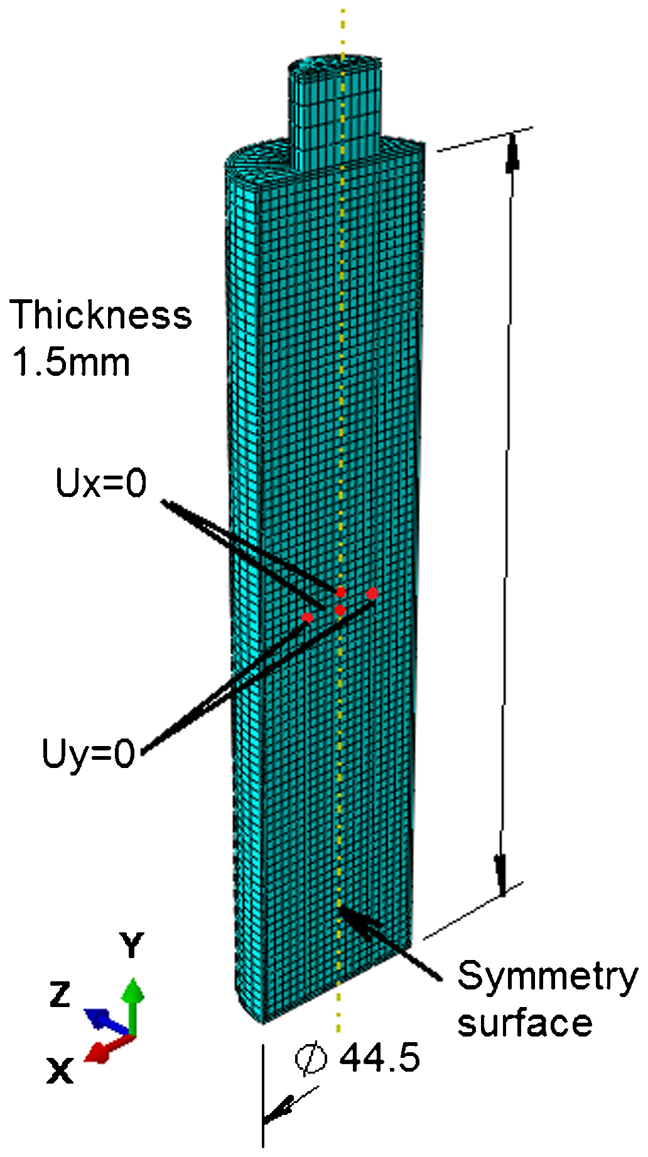
FEM model
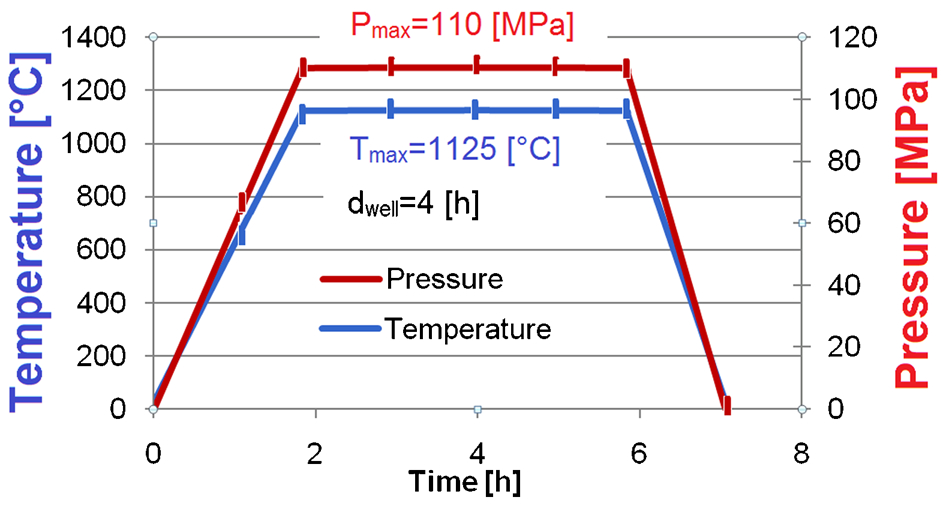
HIP profile
Simulation results
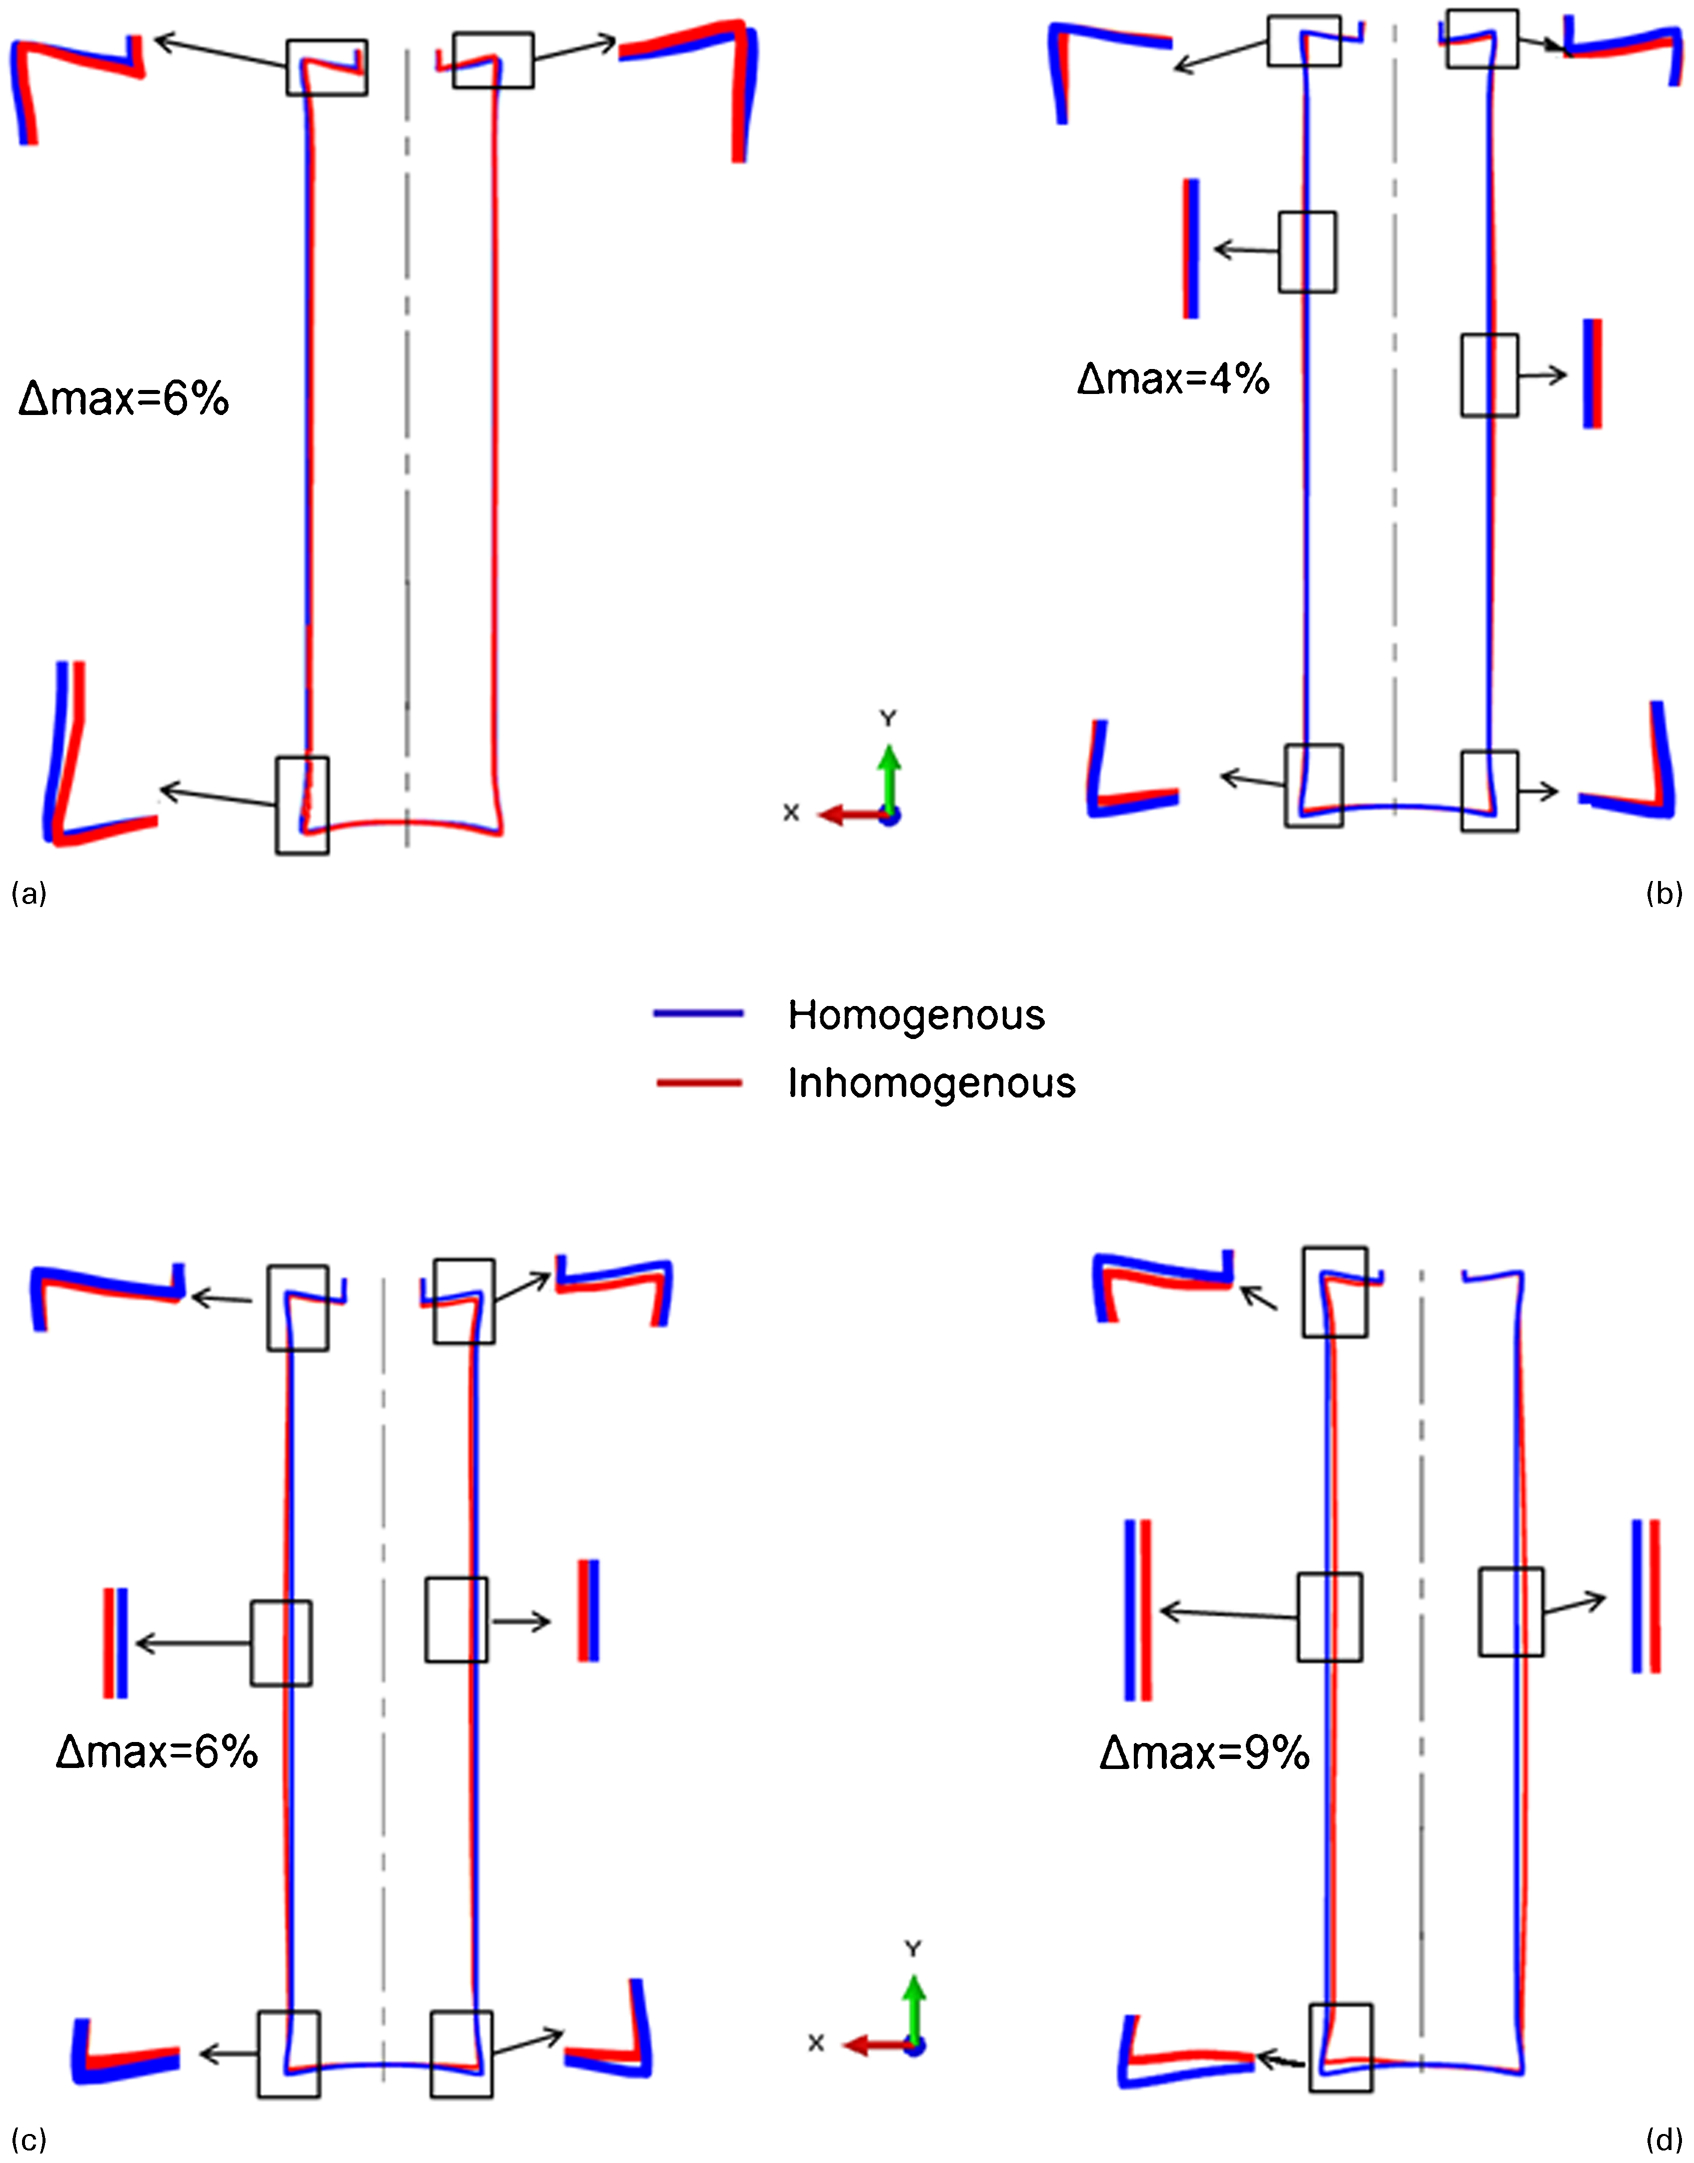
Two FEM models were created for each of the capsules. The first FEM model of each capsule is considered to be homogenous with the RD taken from the average RD as shown in Table 3, and the second FEM model takes into account local RD values taken from IA measurement (Fig. 7). As observed from the simulation results (Fig. 10), all capsules that have an initially inhomogeneous powder distribution deform non-uniformly. On the contrary, all capsules that are assumed to have a homogenous powder distribution have isotropic deformation (Fig. 12).
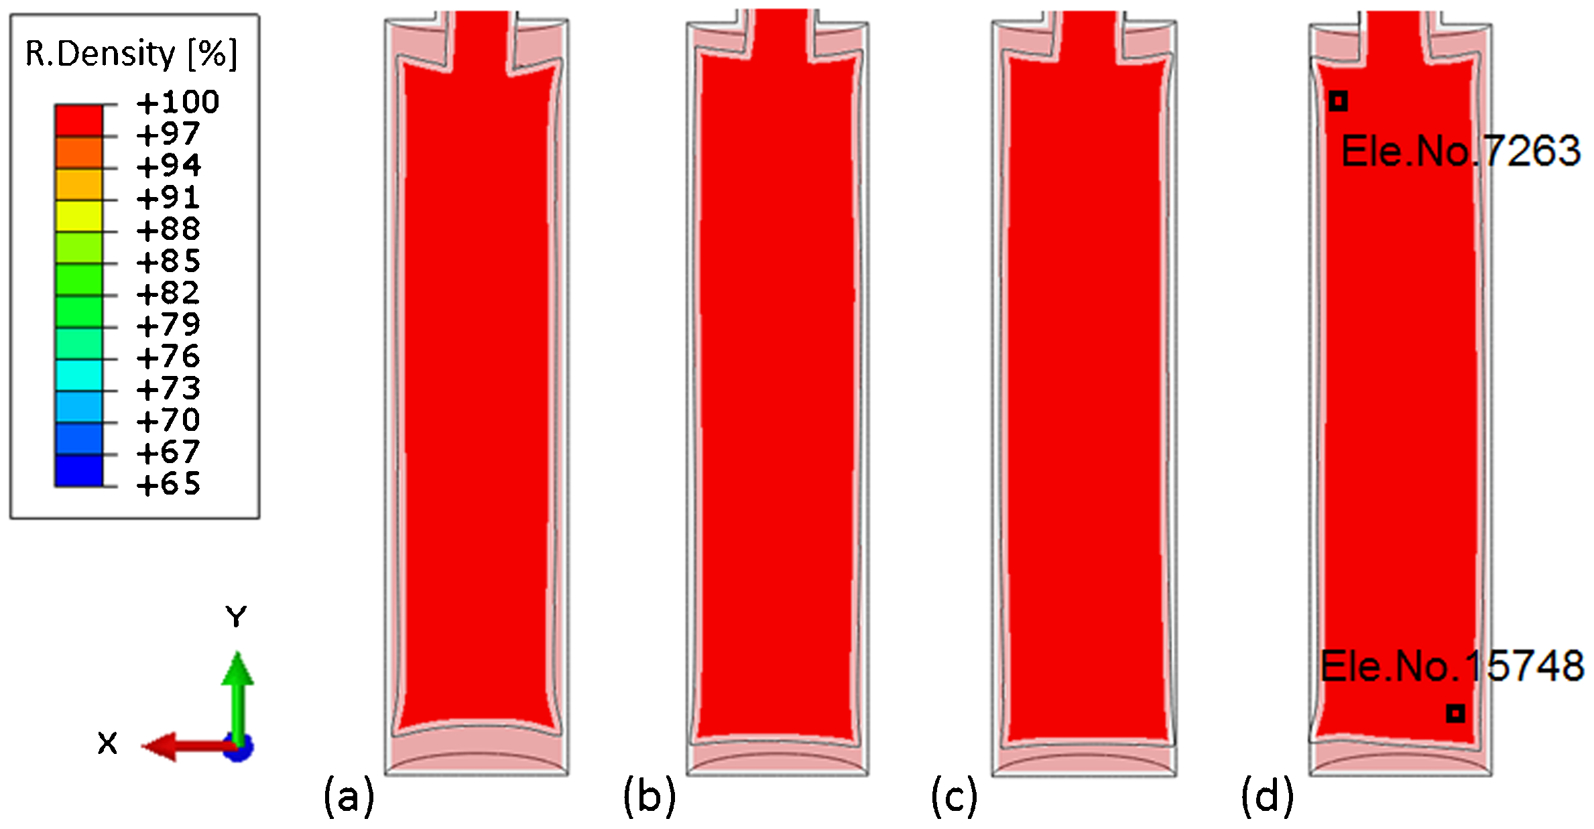
Deformation plot before and after HIP of a capsule no. 1, b capsule no. 2, c capsule no. 3 and d capsule no. 4
a capsule no. 1; b capsule no. 2; c capsule no. 3; d capsule no. 4
The comparison between the deformation of capsules that have homogenous and inhomogeneous powder distributions is shown in Fig. 12. Figure 10 shows that capsule no. 1 has the highest deformation as it had the lowest initial RD. It also has less distortion compared to others as the RD distribution is quite even over the whole cross-section as seen in Fig. 7a. Capsule nos. 3 and 4 have less shrinkage compared to the other capsules as they have the highest initial average RD. Capsule no. 4 also has the biggest distortion (bending from the right to the left side) as it has an initial RD gradient in radial direction as shown in Fig. 7d. This bending pointed to a lower RD side (the left side). This phenomenon is also well known in pressureless sintering. In order to attain full density, all porosity has to be removed. The mass conservation can only be maintained when the lower RD or (higher porosity) regions have to be shrunk more than the higher RD regions. The left side has a lower RD; therefore, it shrinks more than the right side, causing bending to the left side. This effect can be clearly seen in Fig. 11. RD of two elements, nos. 7263 and 15748 of capsule no. 4, have different initial RDs, 0·56 and 0·74 respectively, but they reach full density at the end of the HIP cycle.
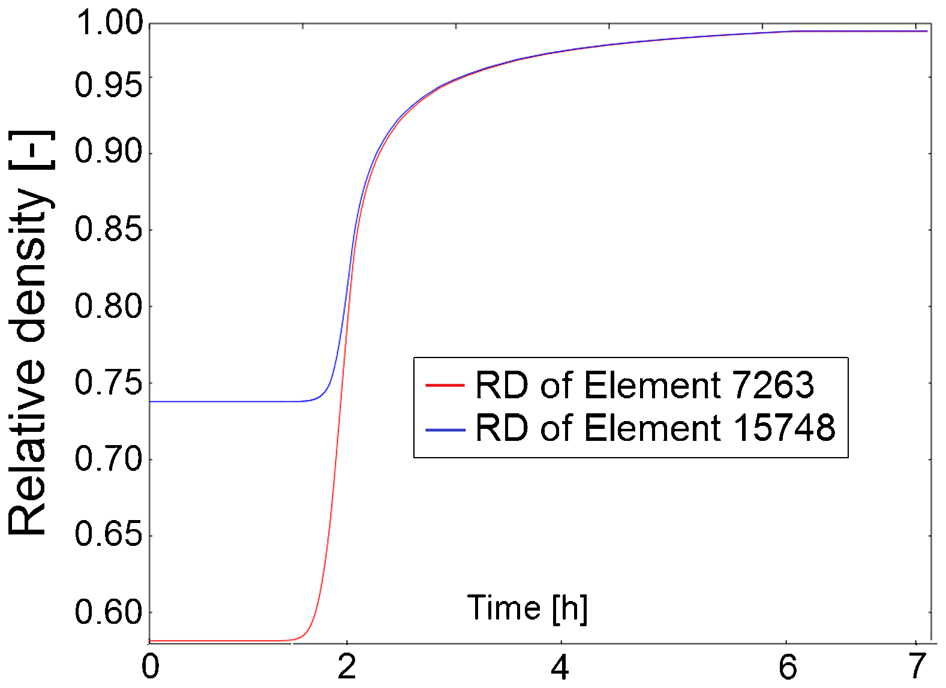
Evolution of RD during HIP of element no. 7263 and no. 15748 (capsule no. 4)
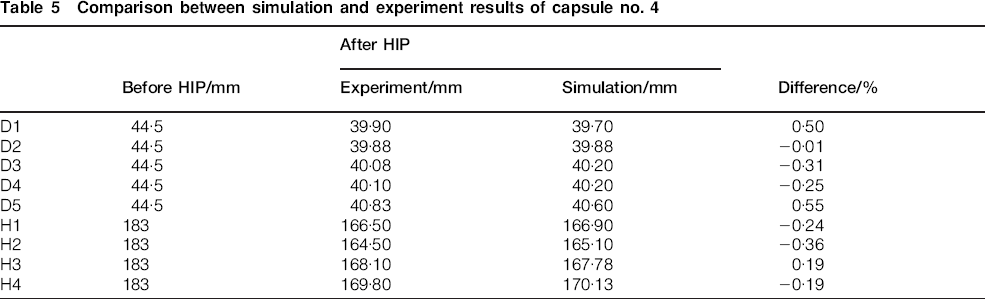
The deformation patterns of all four capsules analysed via FEM agree well with the shape of capsules hot isostatically pressed in a laboratory HIP unit (Fig. 13). In this study, the influence of a temperature gradient has been disregarded because only one capsule was hot isostatically pressed in each HIP cycle, and the capsule was placed in the centre of the HIP vessel. Therefore, it is reasonable to assume a homogeneous temperature field. The non-uniform shrinkage from those capsules, especially the bending of capsule no. 4, can therefore only be explained through the influence of the inhomogeneous powder distribution. As seen from Fig. 14 and Table 5, the maximum difference between the predicted and measured capsule dimensions is <0·55%. The welding position at the edges of the capsule shows the highest difference because its shape and material properties could not be modelled correctly.
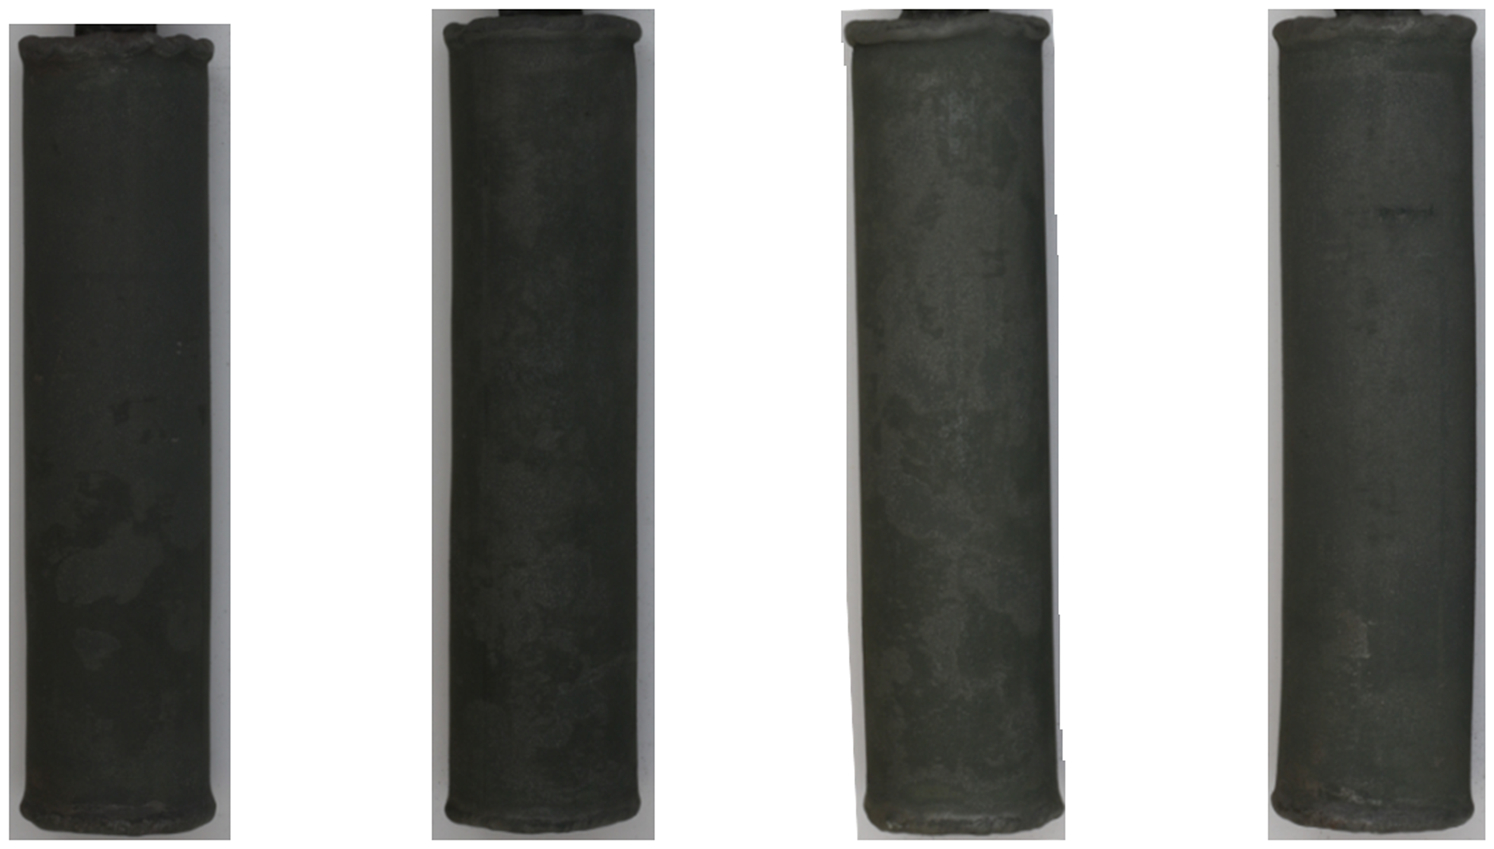
Deformation of hot isostatic pressed capsules
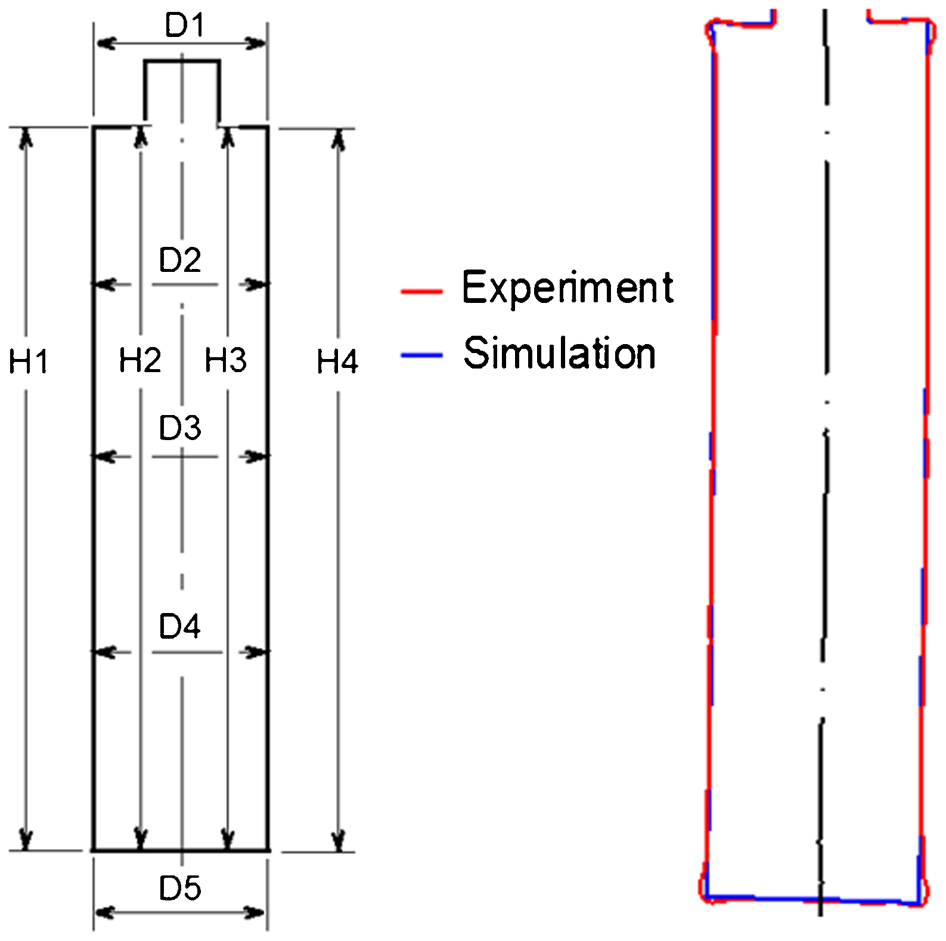
Predicted and measured shape changes of capsule no. 4
Comparison between simulation and experiment results of capsule no. 4
Conclusions
A procedure to analyse the RD distribution of powder inside a capsule has been developed. The density distributions of the four capsules, which have been prepared under different filling and preconsolidation processes, have been analysed. The results show that the powder inside a HIP capsule is distributed inhomogeneously and the RD gradient strongly depends on the filling and preconsolidation process. Abouaf et al.'s viscoplastic model has been implemented in the user subroutine using the commercial software Abaqus, with which 3D FEM simulation models have been created. The initial powder distribution taken from IA has been included in the FEM model. Simulation and experimental results have proven that an inhomogeneous RD distribution contributes to non-uniform shrinkage or high distortion of the components after HIP. The extremes of the initial density distribution can be even more pronounced in larger and more complex shaped components. Near net shape parts with small geometrical allowances require a reproducible, stable powder grain size distribution and good mixing before filling. Tapping and vibrating should be optimised in order to obtain maximum average RD and minimise the inhomogeneous powder distribution. As seen from the simulation results, an exact knowledge of the initial powder distribution needs to be taken into account in the FEM models to predict the final shape and dimension of a component precisely.
Footnotes
Acknowledgement
This work was performed under the financial support from Germany Research Foundation (DFG) under contract no. BR 1844/6-1.