
Abstract
This paper is a study of microstructure and densification of a gas atomised Fe–45Cr–5.9B–2Si–0.1C (wt-%) alloy powder consolidated using the spark plasma sintering (SPS) process. The results showed that the fabricated alloy contained about 65 wt-%(Cr,Fe)2B plates and 1 wt-%(Cr,Fe)7C3 precipitates dispersed in a 34 wt-% body centred cubic Fe based solid solution matrix containing Cr and Si. The powder was fully densified with solid state sintering for a short period of time (<10 min). After sintering, the phases did not transform, and the fraction, shape and aspect ratio of (Cr,Fe)2B did not change. In addition, we adapted the known SPS constitutive densification model from Olevsky and Froyen to include a microstructure factor describing deformation of a metal matrix composite powder. The model was in reasonable agreement with the experimental results.
Introduction
Fe–Cr–B based alloys can be a good replacement candidate for currently used materials in engineering parts subjected to wear and erosion because of their high hardness, wear resistance and corrosion resistance.1–7 These alloys are in situ metal matrix composites (MMC); the reinforcing (Cr,Fe)2B boride solidifies as a primary solid phase within a Fe based solid solution matrix during fabrication from liquid metal.7–15 These powder alloys were previously processed using powder injection moulding (PIM),2,14–16 hot isostatic pressing 17 and supersolidus liquid phase sintering 17 routes.
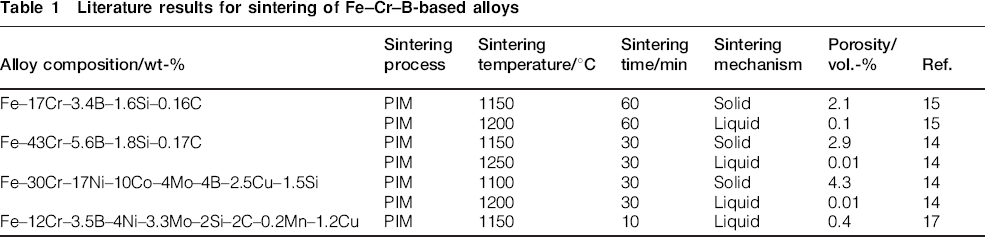
Table 1 presents a summary of the consolidation data obtained in the literature for the PIM and supersolidus liquid phase sintering routes. While the Fe–17Cr–3.4B–1.6Si–0.16C and Fe–43Cr– 5.6B–1.8Si–0.17C (wt-%) alloys contained (Cr,Fe)2B and α-Fe based matrix, the Fe–30Cr–17Ni–10Co–4Mo–4B–2.5Cu–1.5Si (wt-%) alloy consisted of (Cr,Fe)2B and γ-Fe based matrix. The Fe–12Cr–3.5B–4Ni–3.3Mo–2Si–2C–0.2Mn–1.2Cu (wt-%) alloy contained (Cr,Fe)2B, Cr7C3, Mo3B2 and Fe3(C,B) dispersed in γ-Fe based matrix. The phases were independent of the sintering temperature, time and whether liquid phase formed (liquid state) during sintering or not (solid state). Full densification was reached when liquid state sintering was used, while solid state sintering yielded samples with the remaining porosity (>2.1 vol.-%). As the sintering temperature increased, the porosity decreased, while the size of (Cr,Fe)2B and hardness increased. 14 However, for fully dense samples, the (Cr,Fe)2B fraction and hardness decreased as the sintering temperature increased. 15
Literature results for sintering of Fe–Cr–B-based alloys
As presented, Fe–Cr–B based alloys are hard to sinter. It has been shown that solid state sintering can be facilitated through the imposition of an electric current through the powder bed during sintering, a process known as spark plasma sintering (SPS). 18 The SPS process has been shown to sinter the Fe based alloys.19–22 The SPS offers many advantages over the conventional sintering processes, such as lower sintering temperature, shorter sintering time, higher heating rate, which minimise grain growth and lead to improved properties of the sintered materials.18,23
The primary aim of this study was to investigate the microstructure and densification development of a gas atomised Fe–Cr–B based alloy powder sintered by the SPS process. The solidification behaviour of the starting powder was studied using thermodynamic calculations and differential scanning calorimeter (DSC) analysis. Microstructural analysis was carried out using X-ray diffraction (XRD), field emission scanning electron microscopy, energy dispersive spectroscopy and quantification image analysis. A densification model of this alloy during SPS was also adapted for this powder microstructure and experimentally validated.
Experimental procedures
A Fe–Cr–B based alloy powder, commercially known as Armacor M, was used for this study. The powder was produced by high pressure argon gas atomisation process. Table 2 presents the chemical composition of this alloy, as indicated on the manufacturer's data sheet.
Chemical composition of starting Fe–Cr–B based alloy powder
The DSC analysis of the starting powder was performed using a Netzsch DSC 404 F1 Pegasus instrument. The powder and the sapphire standard were placed in alumina crucibles and then heated at 20 K min−1 under argon gas.
To measure the particle size distribution of the powder, 10 micrographs (50× magnification) of the powder were acquiring by a Nikon Epiphot 200 light microscope. The size of 220 powder particles was measured using a Clemex Vision Professional image analysis software.
The starting powder was consolidated using the Thermal Technology Ltd 10-3 SPS system. About 7 g of the powder was pressed in a graphite die under 6.8×10⁻² Torr vacuum. The sintering process involved heating to 1150°C at 200°C min−1, while the pressure was simultaneously ramped to 50 MPa. A soaking time of 10 min was used. Temperature, pressure and displacement were monitored during the process.
The relative densification occurring during sintering was calculated based on the displacement of the actuator. The sintered specimens had a disc shape with 20 mm diameter and 3 mm thickness. Density of the sintered specimen was measured using the Archimedes's principle, according to ASTM B962 Standard. The relative density was calculated considering the theoretical density of the alloy as 7.13 g cm−3. 24
To characterise the powder cross-section, the powder was hot mounted in conductive graphite filled polymer resin. For the SPS specimen analysis, the specimen was cut using a wafering diamond blade and also hot mounted with the same procedure. The mounted powder and specimen were ground and polished using standard metallography procedures. Final polishing was achieved using 0.05 μm colloidal silica. The polished specimens were cleaned in an ultrasonic bath with acetone for 10 min.
Microstructural analysis was carried out with Hitachi SU-8000 and Phillips XL 30 field emission scanning electron microscopes to acquire secondary electron (SE) and backscattered electron (BSE) micrographs. An Oxford XMax energy dispersive spectrometer was used for qualitative elemental analysis. The volume fraction and aspect ratio of the phases were measured by image analysis of three BSE micrographs (10 000× magnification) of each polished specimen. All average values were compared using two-sided student t test with a confidence interval of 99%. To investigate the shape of the boride particles, the specimen was deeply etched in a solution composed of one part HCL, one part HNO3 and one part H2O for 20 min, followed by imaging.
X-ray diffraction analysis was performed with a Philips PW1070 diffractometer employing Cu Kα (λ = 0.15406 nm) radiation to identify the phases and measure their lattice parameters. X-ray diffraction scans were made under the operation conditions of 40 kV and 20 mA with a scan rate of 0.02° s−1 from 30 to 100°. The lattice parameters were calculated using W powder as a standard for peak position correction. The refinement of the patterns was carried out using the XLAT software. 25
Results and discussion
Characterisation of powder
Microstructure analysis
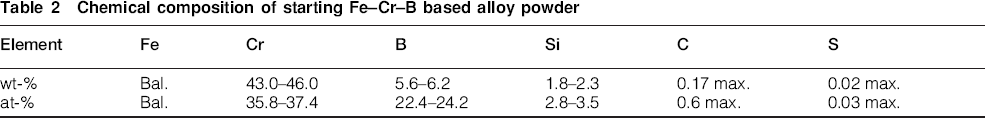
Figure 1a shows the SE micrograph of the starting Fe–Cr–B based alloy powder. The powder has a spherical shape, which is typical of the gas atomisation process. The size distribution of these powders, as measured by image analysis, is presented in Fig. 1b. The mean diameter of the powder was 118±34 μm.
a micrograph (SE) and b particle size distribution of starting Fe–Cr–B based alloy powder fabricated by gas atomisation process

Micrographs (BSE) of as polished a, b starting powder and c, d sintered specimen by SPS. Particles refer to (Cr,Fe)2B phase, while matrix refers to Fe based solid solution
Figure 2a and b shows the BSE micrographs of the polished cross-sectional powder. It consisted of dark contrast particles and a light contrast matrix. Energy dispersive spectroscopy analysis showed that the particles were rich in B, Cr and Fe while the matrix was rich in Fe, Cr and Si. Table 3 presents the measured volume fractions of the particles and matrix and the aspect ratio of the particles for the starting powder by image analysis of the BSE micrographs.
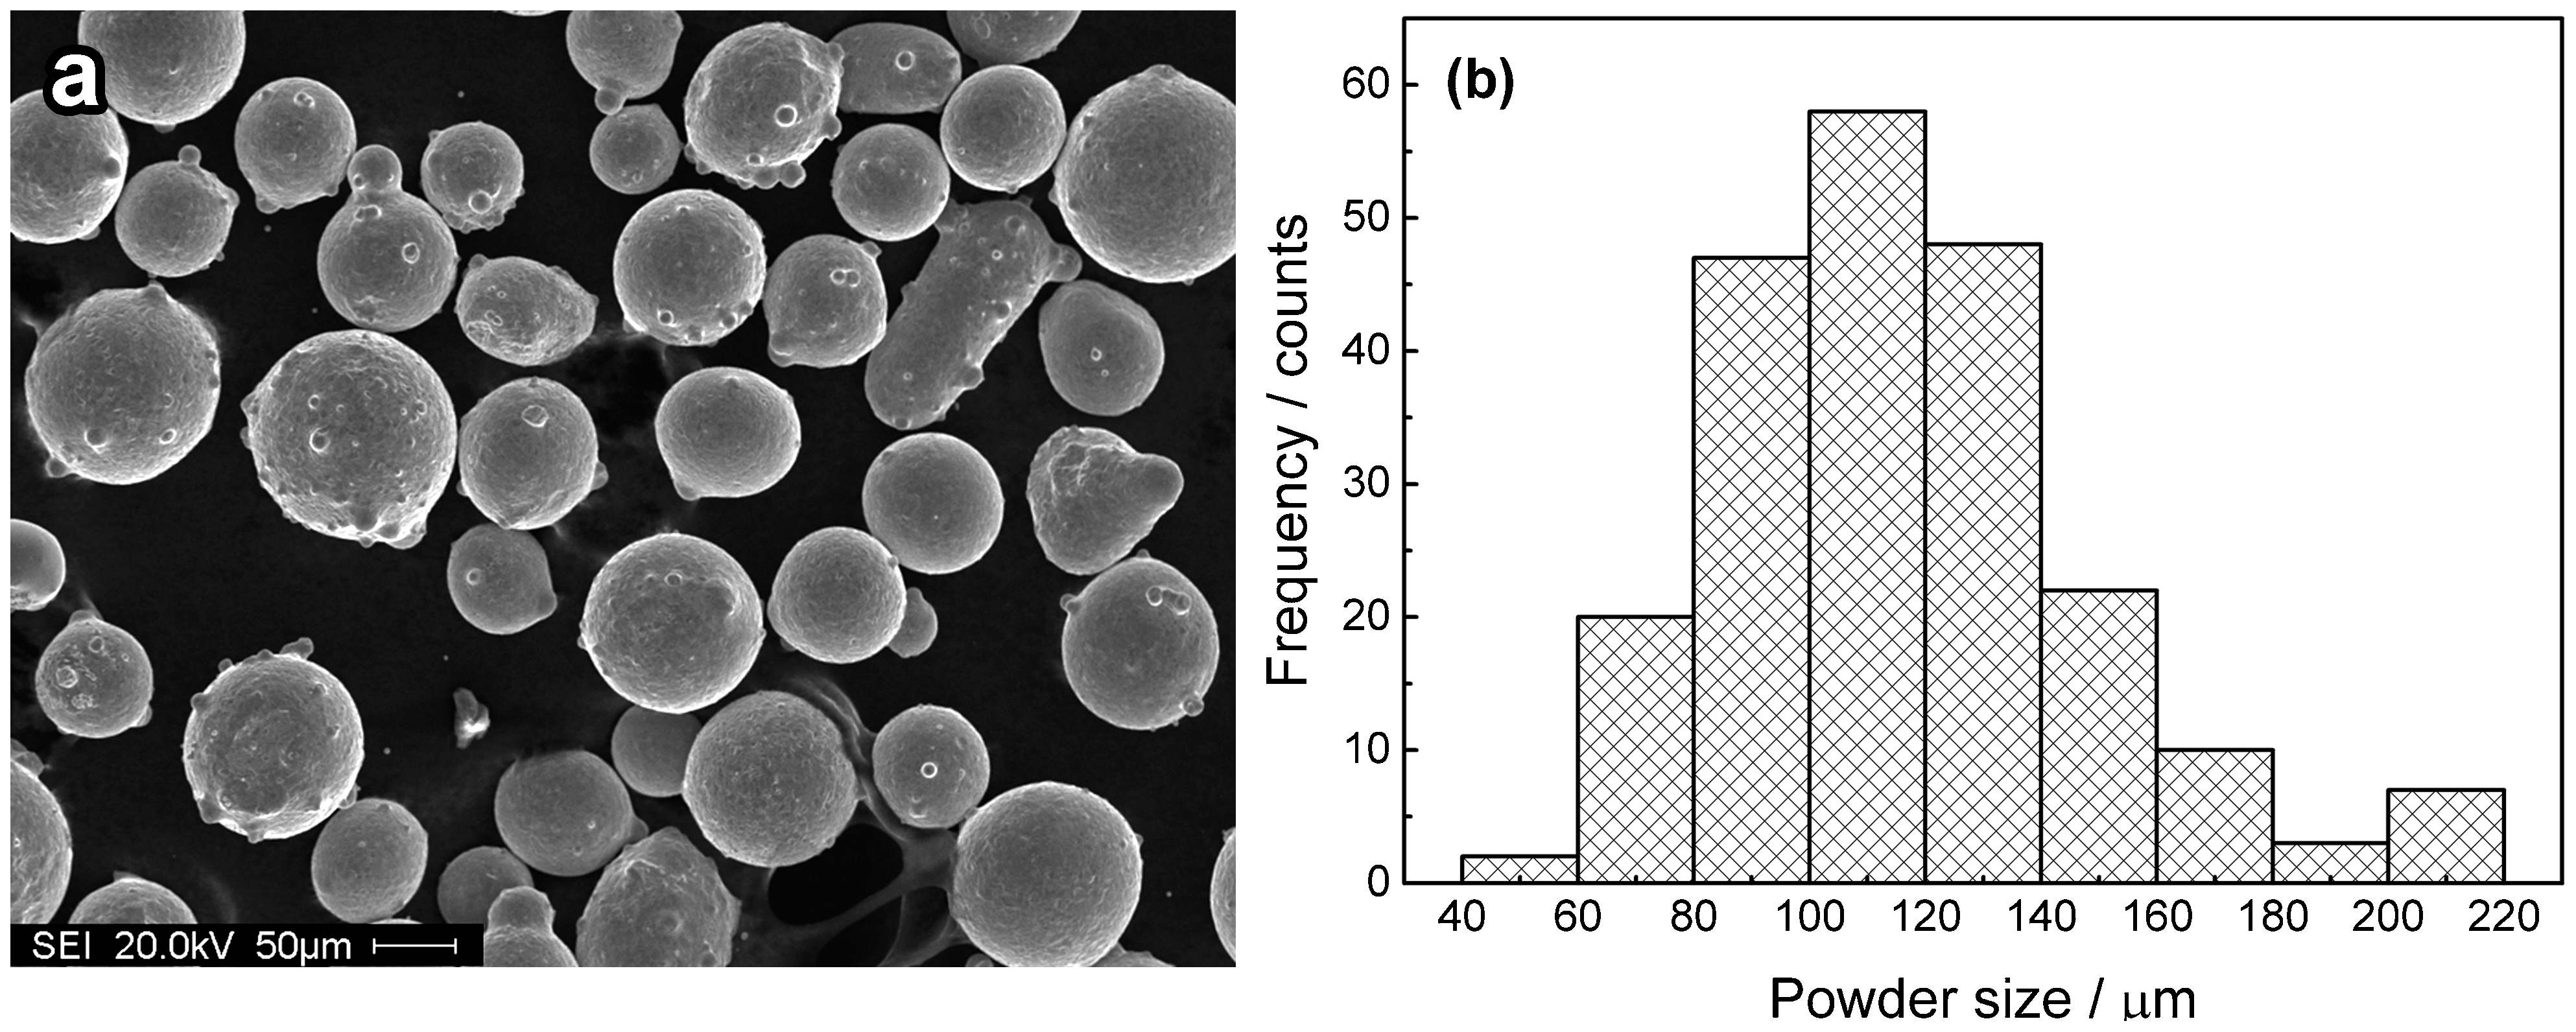
Figure 3a shows the XRD result for the starting powder. The identified phases were body centred cubic (bcc) α-Fe (JCPDS no. 006-0696) 26 and orthorhombic (Cr,Fe)2B (JCPDS no. 072-1073). 27 Therefore, the light contrast matrix (Fig. 2b) corresponds to the bcc Fe based solid solution containing Cr and Si, and the dark contrast particles correspond to the orthorhombic (Cr,Fe)2B phase.
X-ray diffraction results of a starting powder and b sintered specimen by SPS
Table 4 presents the measured lattice parameters of these phases and reported values from the literature. The measured and reported lattice parameters of (Cr,Fe)2B were similar. The measured lattice parameter of the α-Fe phase for the powder (2.861±0.001 Å) was slightly lower than the one reported for pure α-Fe (2.866 Å).
Figure 4a shows the SE micrograph of the etched powder. The shape of the (Cr,Fe)2B particles was irregular plate-like. Some of these plates were in contact with each other. The number of contact points to the number of plates for six micrographs were measured, and the ratio of points/plates number was 0.44±0.12.
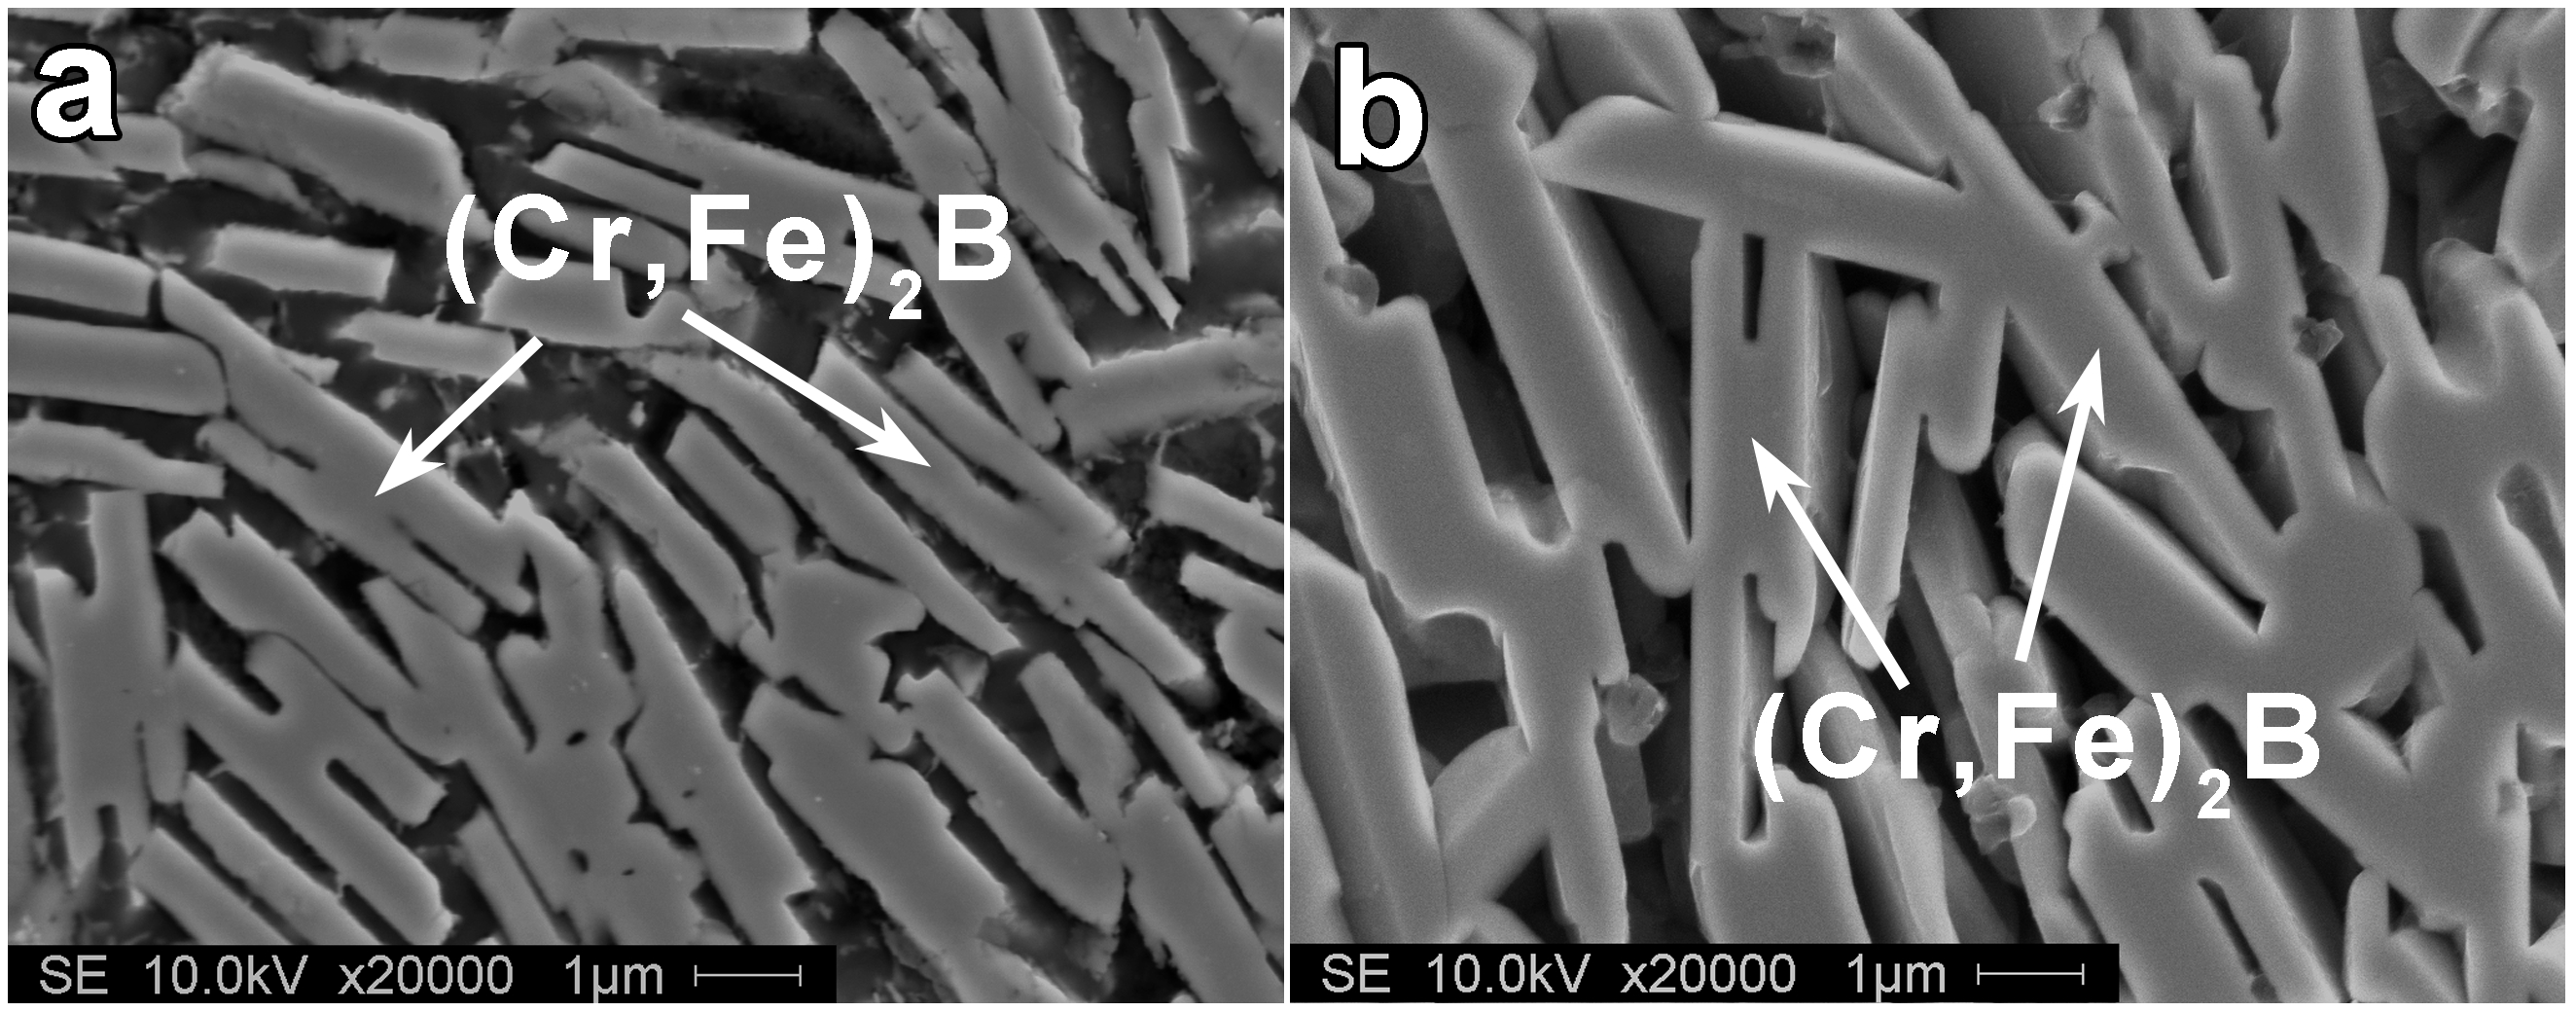
Micrographs (SE) of etched a starting powder and b sintered specimen, showing morphology of (Cr,Fe)2B
Thermodynamic calculations
To further understand the solidified phases, thermodynamic analysis of the solidification of this gas atomised alloy was performed. The solidification behaviour of alloys has been widely studied28–31 using the Scheil–Gulliver model,32,33 which assumes infinitely fast diffusion in the liquid phase and zero diffusion in the solid phases. This model was valid for the solidification of the Fe–Cr–B based alloy fabricated by the controlled short circuit metal inert gas welding process that yields a 102–104°C s−1 solidification rate. 13 Since typical cooling rate of Fe based alloys fabricated by the gas atomisation process is similar (103–104°C s−1), 34 this model was applied here for the gas atomised powder to provide reasonable estimates of the evolution of the phase fractions and solute distribution during the solidification.
Figure 5 and Table 5 illustrate the phase distribution evolution during solidification and chemical composition of each phase at transition temperatures, as calculated by the FactSage thermochemical software with the FSStel database 35 using the Scheil–Gulliver model.32,33 The (Cr,Fe)2B phase began to solidify at 1664°C and its content increased as the temperature decreased. At 1217°C, a bcc phase containing Fe, Cr, Si and low contents of B and C started to solidify. At 1204°C, the (Cr,Fe)7C3 phase formed. The solidification finished at 1181°C, and the modelling alloy contained 64.1 wt-% (Cr,Fe)2B, 35.0 wt-% bcc solid solution and 0.9 wt-%(Cr,Fe)7C3. The (Cr,Fe)2B and bcc α-Fe phases were detected by XRD (Fig. 3a), though (Cr,Fe)7C3 was not detected because of its low content (0.9 wt-%). In addition, the peaks of (Cr,Fe)7C3 (JCPDS no. 005-0720) overlap with those of (Cr,Fe)2B (JCPDS no. 072-1073).
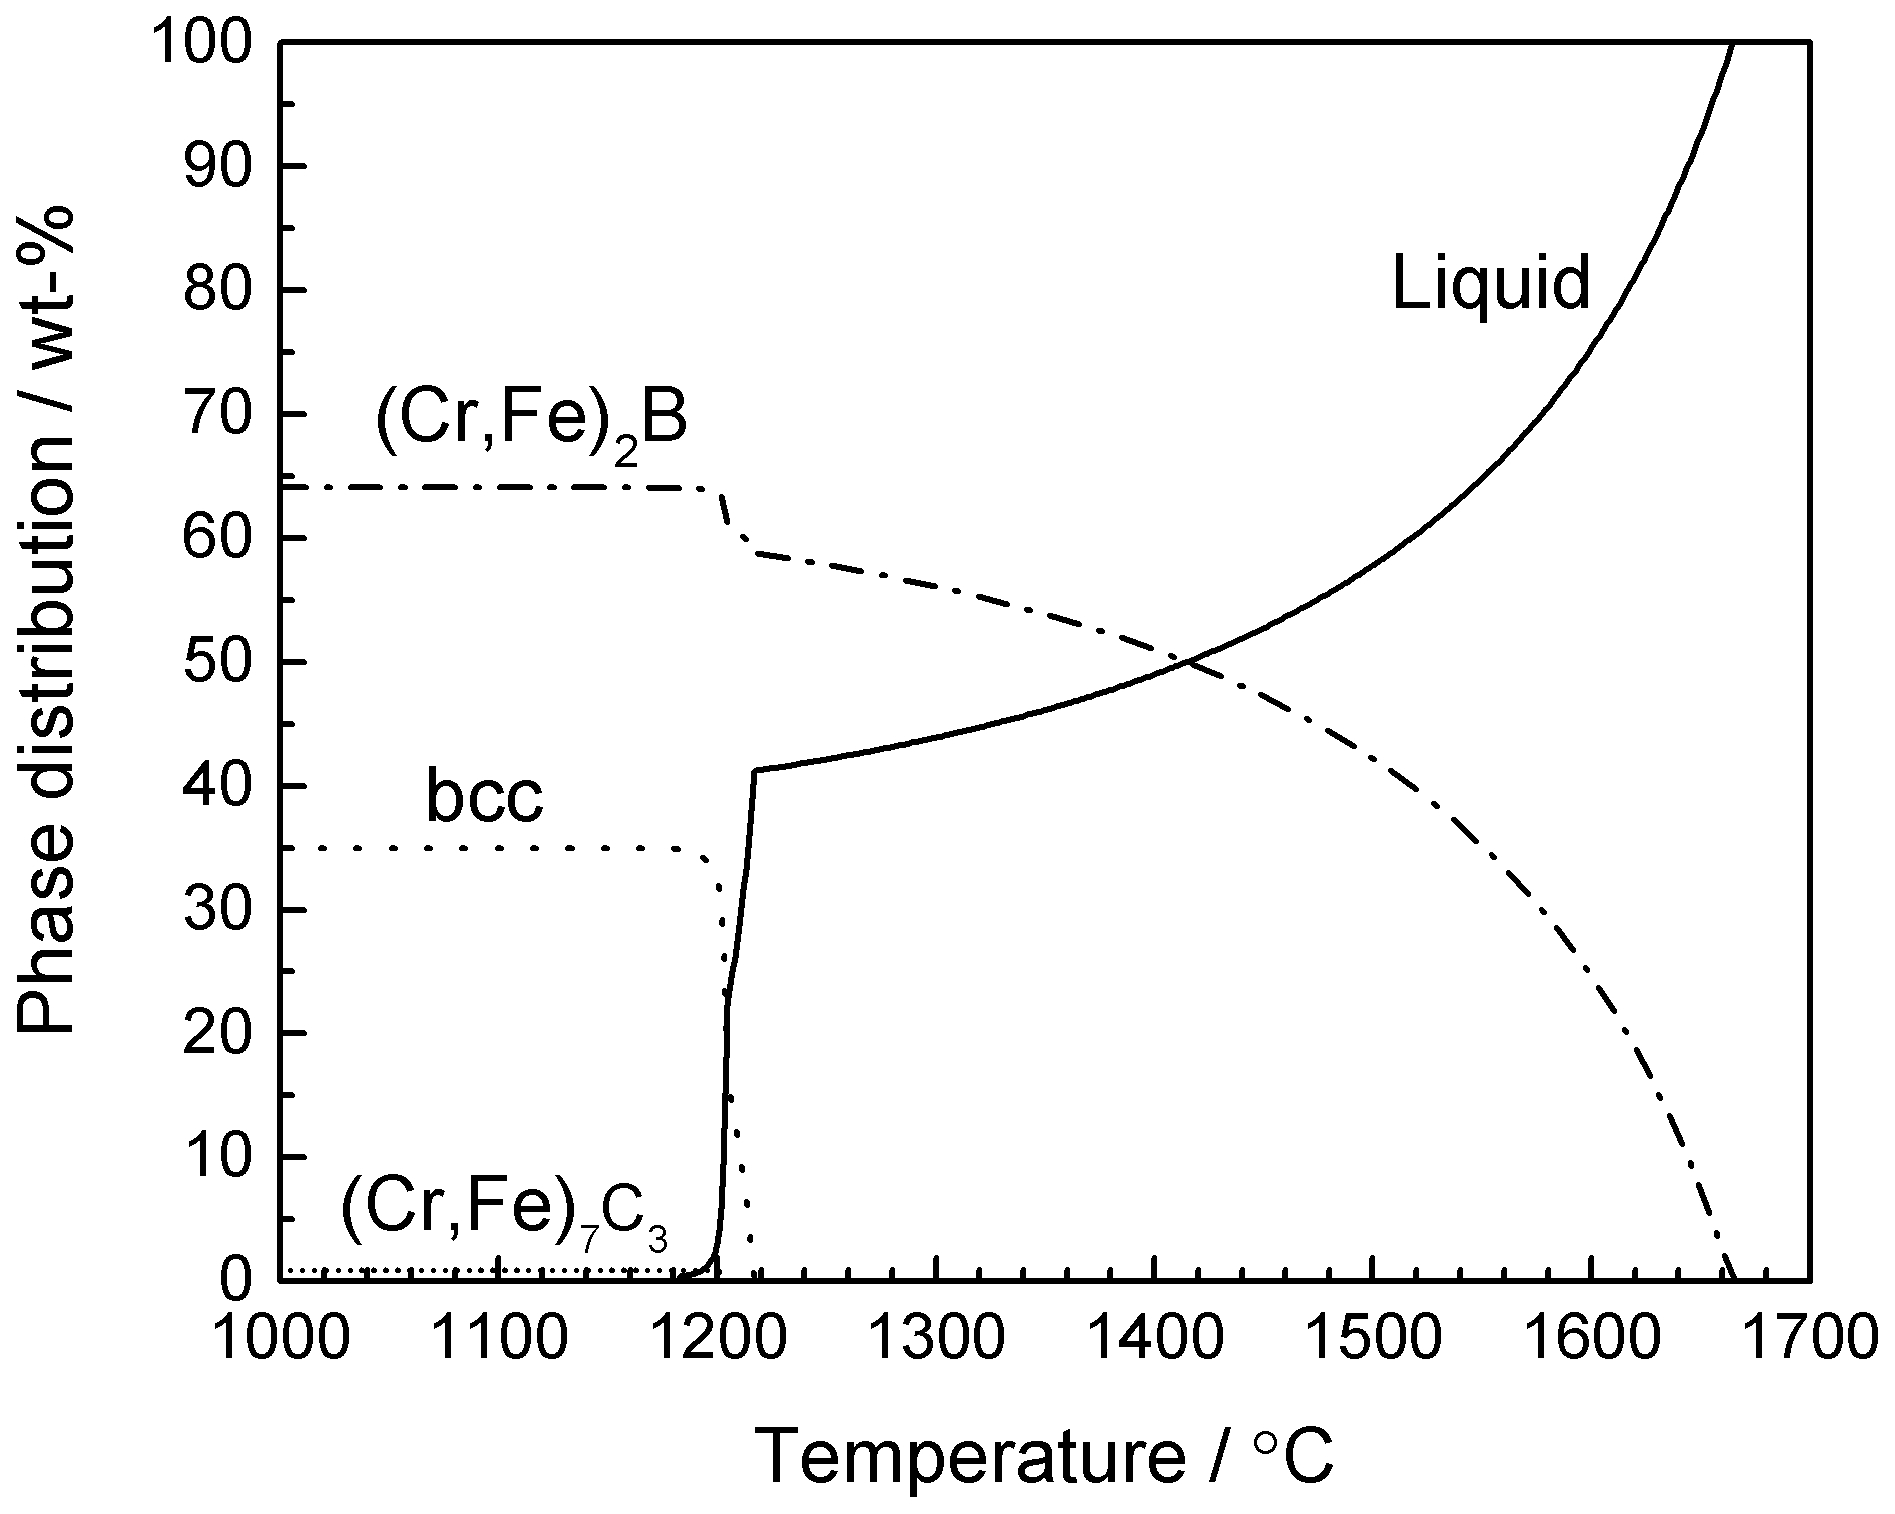
Phase distribution as function of temperature based on Scheil–Gulliver model in FactSage software for investigated alloy composition: Fe–45Cr–5.9B–2Si–0.1C (wt-%)
Volume fractions of particles and matrix for starting powder, sintered specimen and modelling alloy as well as measured aspect ratios of particles
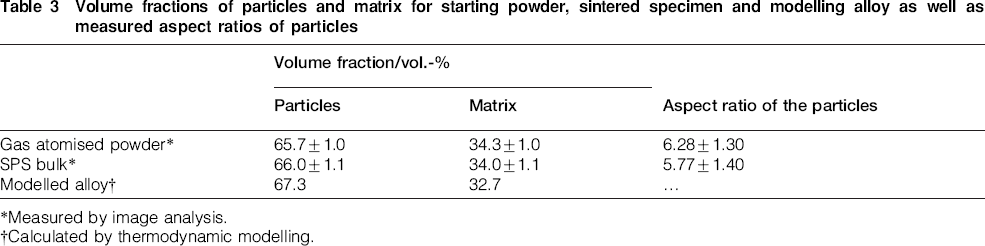
Measured by image analysis.
Calculated by thermodynamic modelling.
Reported and measured lattice parameters of identified phases of starting powder and sintered specimen by SPS
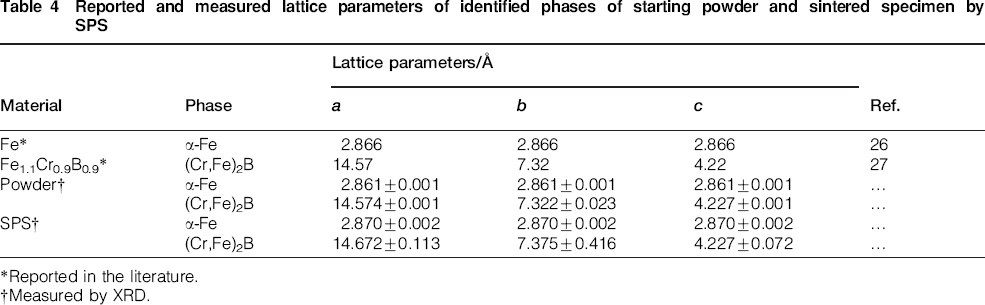
Reported in the literature.
Measured by XRD.
Modelled weight per cent and chemical composition of each phase for transition temperatures of investigated alloy, as calculated by thermodynamic using Scheil–Gulliver model
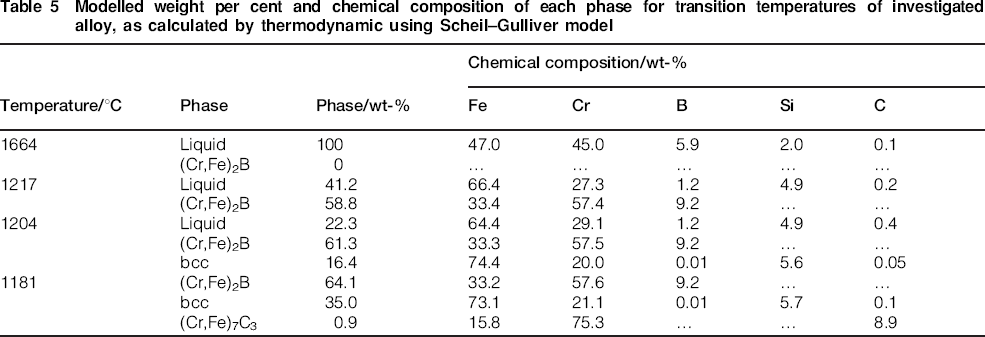
The volume fractions of the phases based on thermodynamic modelling (Table 5) were calculated and are presented in Table 3, assuming the density of (Cr,Fe)2B and (Cr,Fe)7C3 as 6.8 g cm−3 and that of the matrix as 7.6 g cm−3. The deviation of the calculated volume fractions from those measured by image analysis was less than 5%. This, in fact, indicates a valid approximation of the thermodynamic calculation using the Scheil–Gulliver model.
The equilibrium thermodynamic calculation was also performed to identify whether it agreed to Scheil–Gulliver cooling. The predicted equilibrium stable phases at 1150°C (sintering temperature) were similar: 64.0 wt-%(Cr,Fe)2B, 35.1 wt-%(Fe,Cr) bcc solid solution and 0.9 wt-%(Cr,Fe)7C3. The equilibrium solidus temperature was predicted as 1206°C, below which no phase transformation occurred.
DSC analysis
To measure the solidus temperature, DSC analysis of the starting powder was performed; the result is shown in Fig. 6. A melting endothermic peak started at 1215°C. This peak corresponded to the melting of the phases. This measured melting temperature was in agreement with the calculated one (1206°C) by the equilibrium thermodynamic analysis. Similar behaviour for the melting of the Fe–28.2Cr–3.8B–1.5Si–1.5Mn (wt-%) alloy has been found; 13 a small peak starting at 1205°C followed by superimposed main melting peaks.
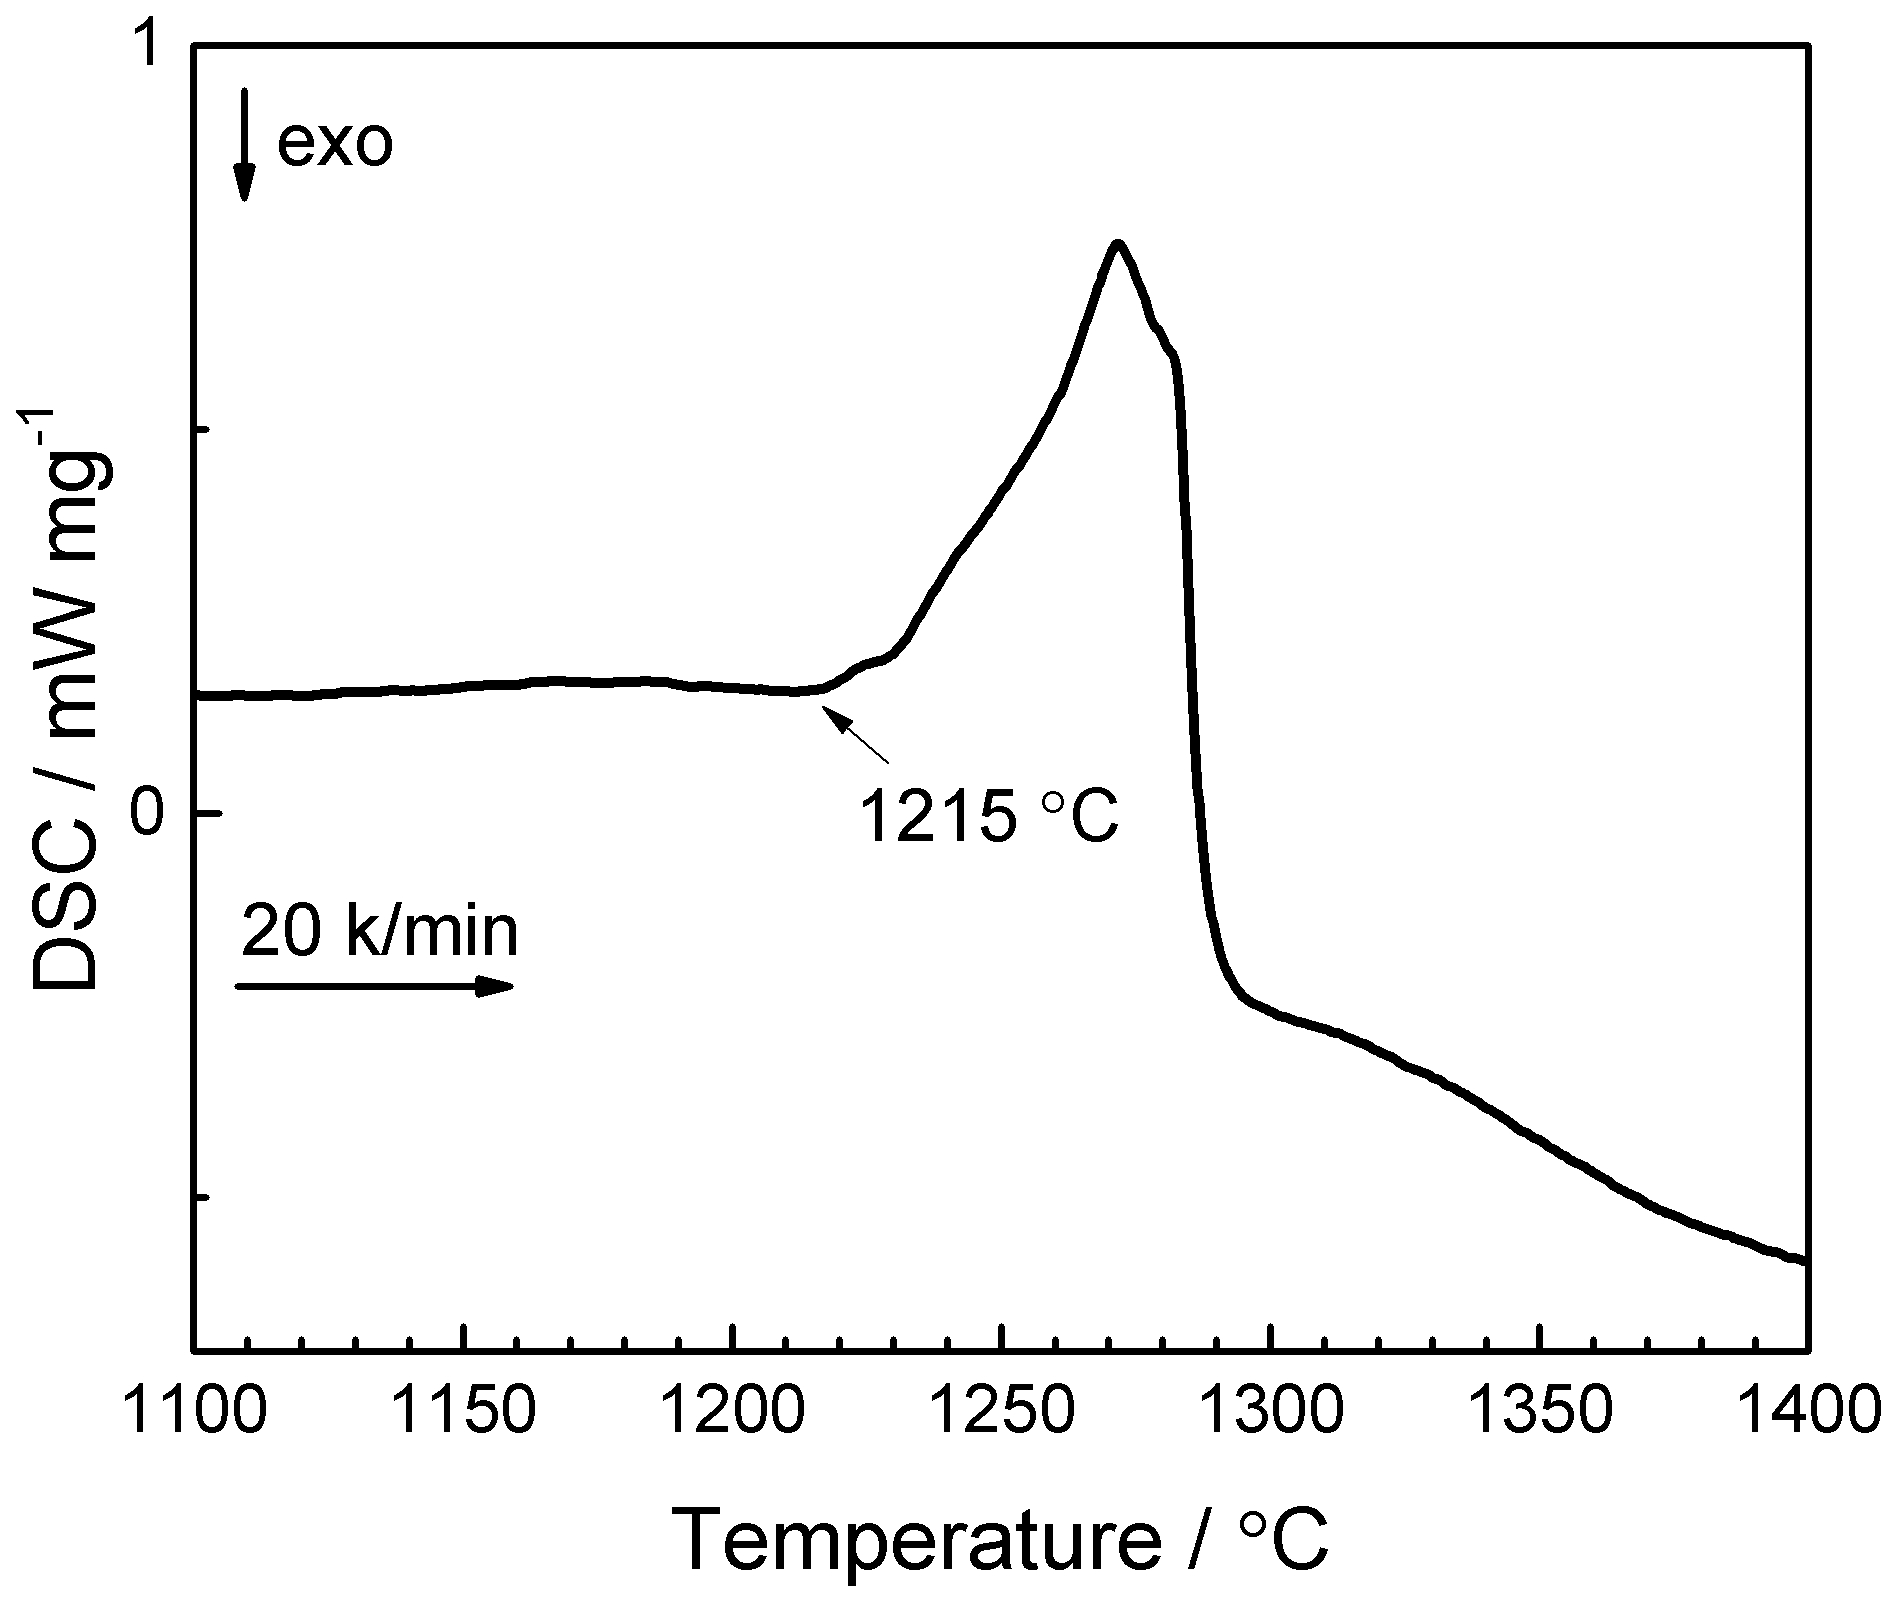
Curve (DSC) for starting powder fabricated by gas atomisation
Characterisation of sintered specimen
Densification
The Fe–Cr–B based alloy powder was sintered at 1150°C for a short period of time (10 min) using the SPS process to produce a bulk specimen. The measured density of the sintered specimen was higher than 98.5% of theoretical density. This full densification occurred at a sintering temperature lower than the solidus temperature (1215°C, Fig. 6).
Son et al. 14 and Do et al. 15 solid state sintered the same alloy using the PIM process at the same temperature (1150°C), as presented in Table 1. As the sintering time increased from 30 to 60 min, porosity was slightly reduced from 2.9 to 2.1 vol.-%. In this investigation, the powder was successfully sintered with a porosity less than 1.5 vol.-% at the same temperature (1150°C) for a shorter period of time (10 min). This SPS densification improved as compared to PIM mainly because of the application of pressure during the sintering cycle. The pressure has a direct effect on the particle sliding and re-arrangement, plastic deformation and destruction of agglomerates. 18 In addition, the role of electric fields in SPS processing to improve densification should not be ignored. The electric field has a thermal effect (Joule heating) and intrinsic role. Joule heating provides high heating rate (higher sinterability) 36 and creates local thermal gradients that induce the diffusion at particles’ boundaries. Intrinsically, the electric field enhances mass transport by electromigration, 37 increase in point defect concentration, 38 decrease in the mobility activation energy for defects 39 and/or dielectric breakdown of oxide layers (in non-conductive powders). 40 Besides the improvement of the densification, the solid state sintering maintains the original structure of the phases and properties, as experimentally shown.
Microstructure analysis
Figure 2 Figures 2c, d and 3b show the sintered specimen's BSE micrographs and XRD, respectively. Energy dispersive spectroscopy analysis (Fig. 7) showed that the matrix (S1) was rich in Fe, Cr and Si while the particles (S2) were rich in B, Cr and Fe. In the particles (S2), a small peak of Si was detected. The beam interaction within these particles was estimated by the Monte–Carlo simulation using CASINO software, 41 and it was found to reach up to 1 μm depth. Because the thickness of the particles was about 1 μm, the spectrum also contains information from the matrix as a result of the interaction volume of the beam with the matrix. In addition to these phases, a few precipitates (S3) that has brighter contrast than the particles (S2) were detected and were rich in C, Cr and Fe.
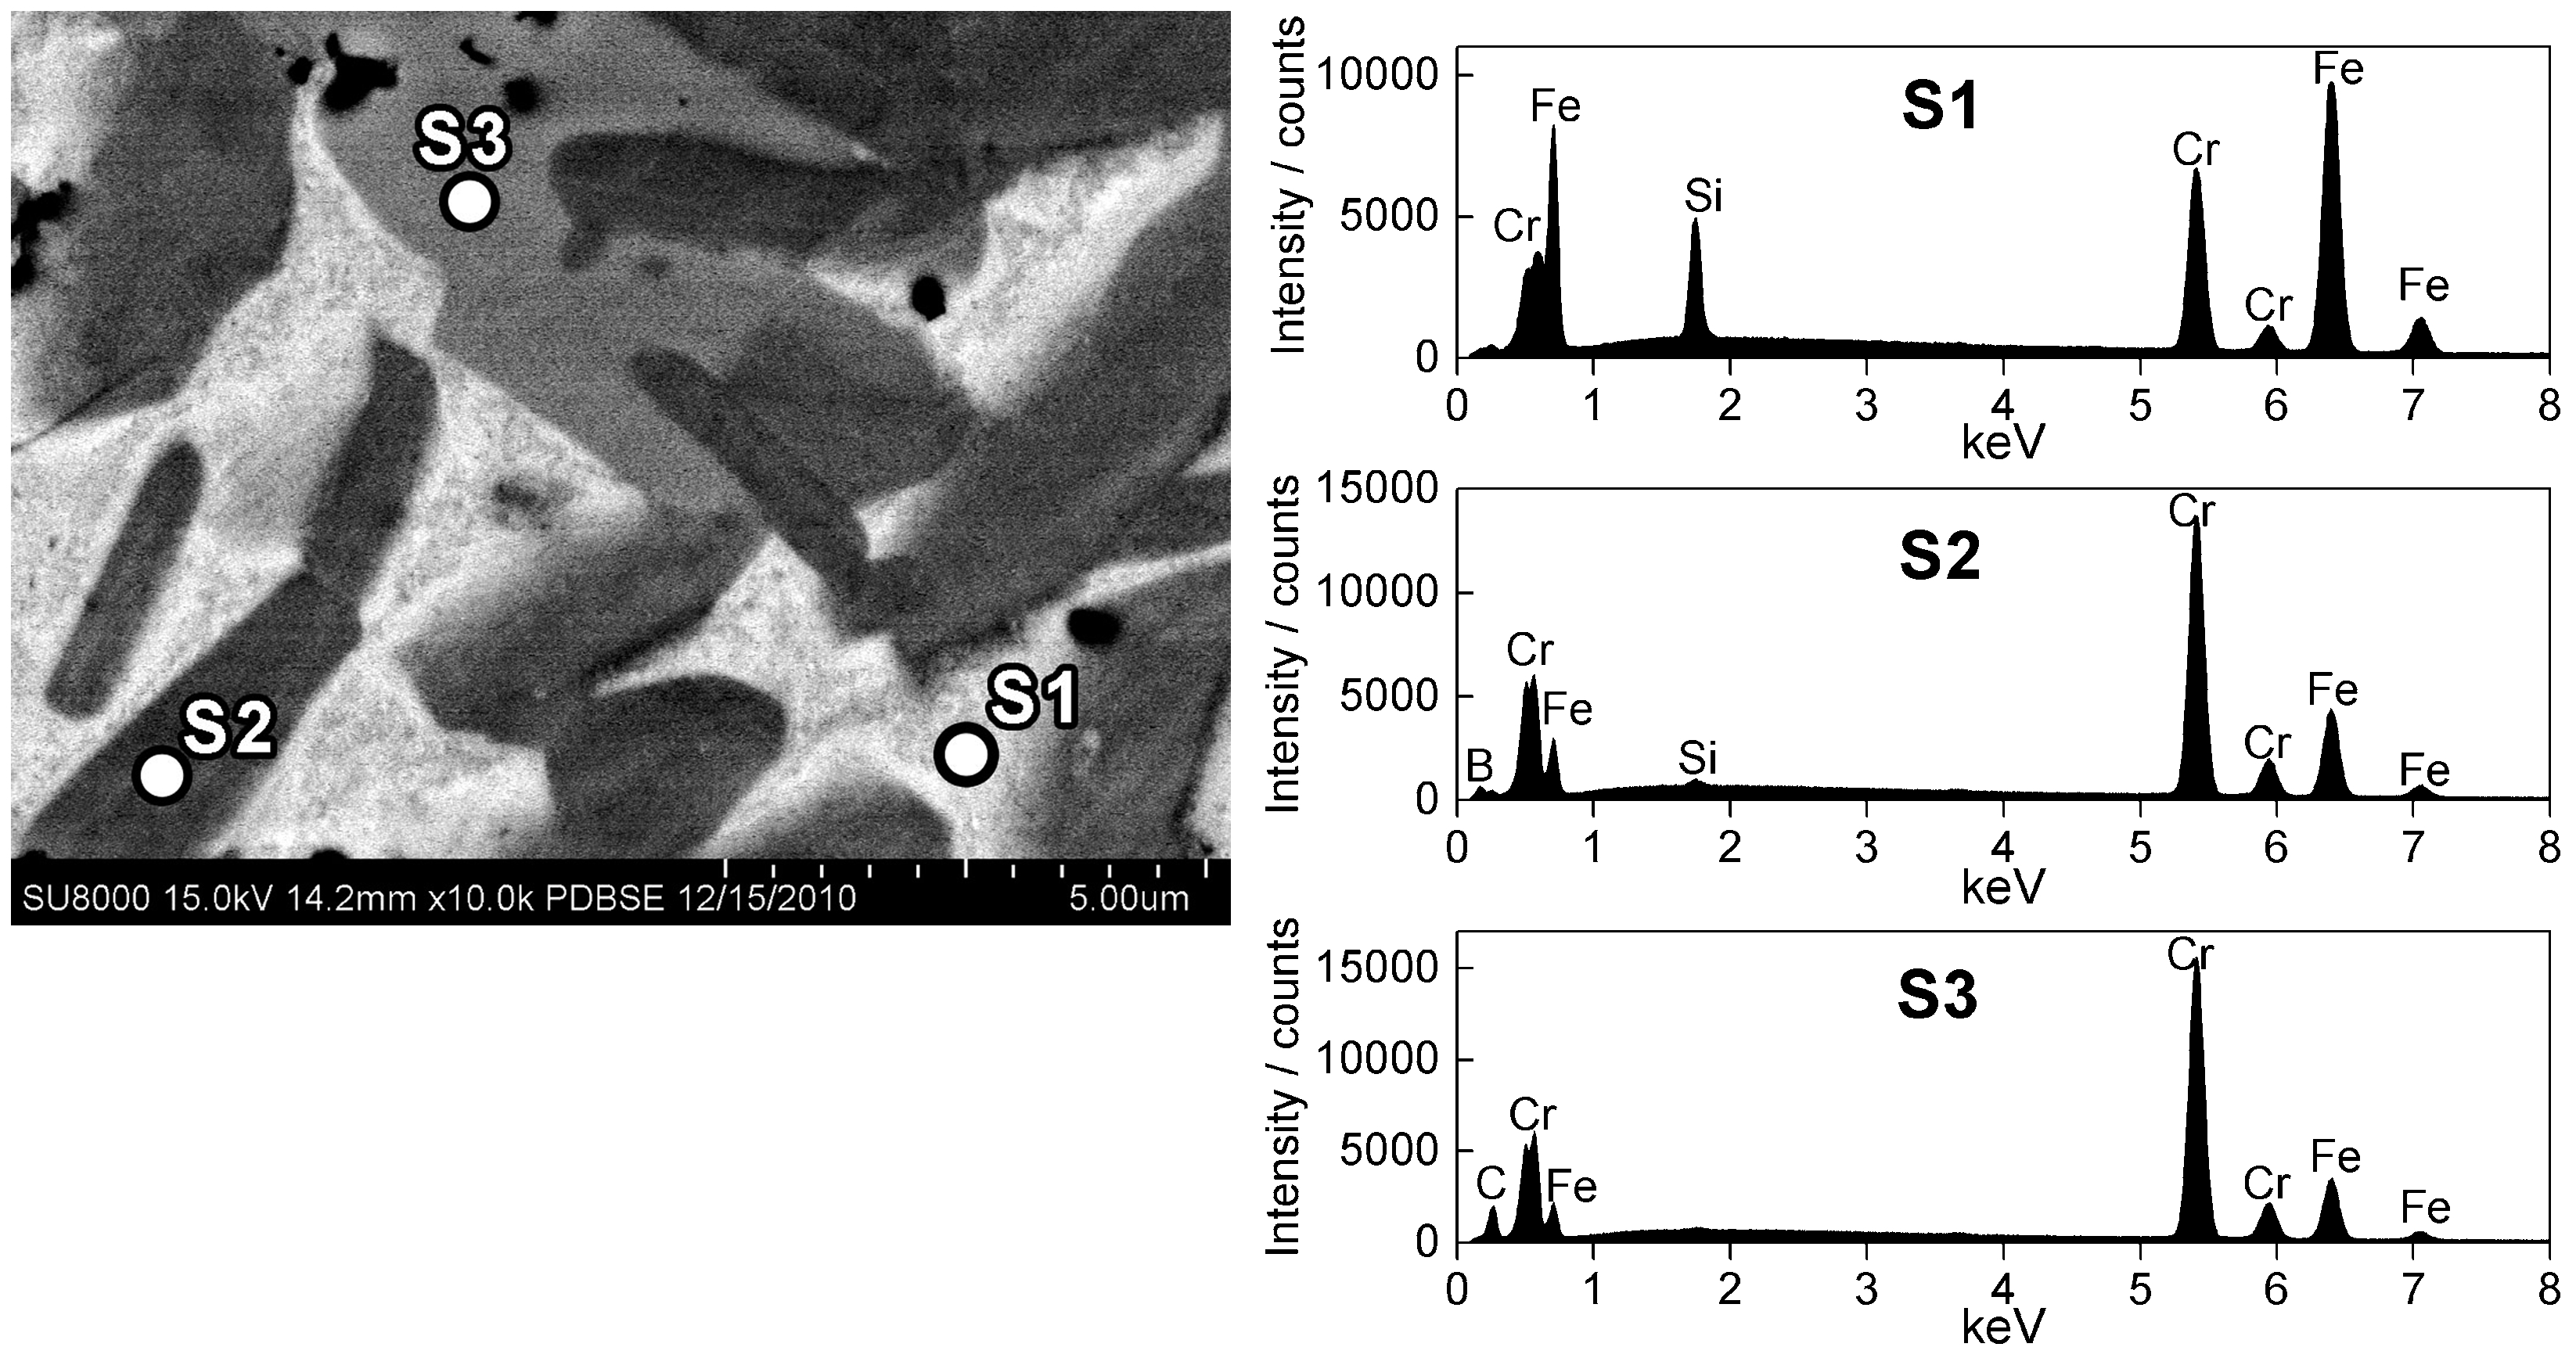
Micrograph (BSE) of sintered specimen with corresponding energy dispersive spectroscopy analysis at 15 keV accelerating voltage
Similar to the powder, the sintered specimen consisted of the bcc Fe based solid solution matrix containing Cr and Si, (Cr,Fe)2B particles and a few precipitates of (Cr,Fe)7C3. The measured volume fraction and aspect ratio of the particles for the sintered specimen are presented in Table 3. The particles’ volume fractions and aspect ratios for the powder and sintered specimen were statistically similar.
Table 4 presents the measured lattice parameters of these phases. The measured and reported lattice parameters of (Cr,Fe)2B were similar. The measured lattice parameter of the α-Fe phase for the sintered specimen (2.870±0.002 Å) was slightly higher than the one reported for pure α-Fe (2.866 Å) because of the substitution of Cr, which has larger atomic radii than Fe. 42 Silicon, which is smaller than Fe, 42 would decrease the lattice parameter, but this effect was neglected because of the smaller concentration of Si compared to Cr in the investigated alloy. However, the lattice parameter of the powder (2.861±0.001 Å) was lower than that of the sintered specimen (2.870±0.002 Å). This decrease most probably occurred because the matrix was supersaturated with B as a result of rapid solidification during the gas atomisation process, as found by Jin et al. 9
The shape of the (Cr,Fe)2B particles for the sintered specimen (Fig. 4b) was similar to that for the powder (plate-like). However, the connection between plates was increased as a result of the SPS sintering. Due to the applied pressure and high temperature, the sample was deformed and thus the plates were brought into contact. The ratio of points/plates number was increased from 0.44±0.12 (for the starting powder) to 0.73±0.1 (after the sintering). Guo and Kelly 43 found similar shape of the boride phase in the casted Fe–11Cr–1.4B–1.2Si–1.1Ni–0.9Mo–0.7V–0.6Cu–0.2Mn–0.2C alloy. The plates were in contact with each other, and when the alloy was heat treated, the thickness of the plates increased and the connection between them became more prominent.
Densification modelling
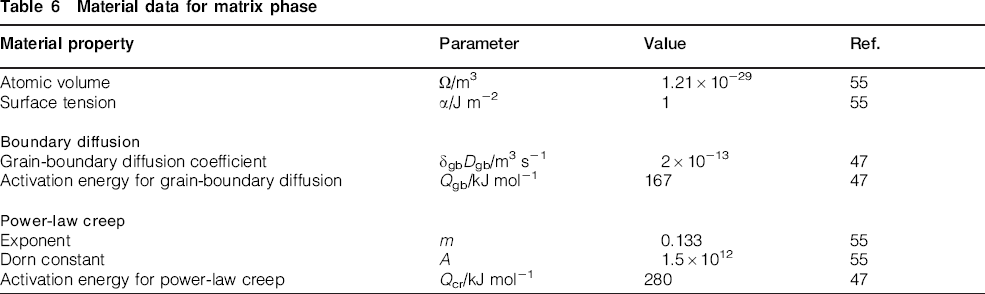
While there is some controversy about the densification mechanisms during SPS, Olevsky and Froyen 44 developed the most complete constitutive model that describes SPS densification. They considered the dominant mass transport mechanisms for SPS densification as power-law creep, grain boundary diffusion, electromigration and surface diffusion. Milligan et al. 45 used the Olevsky and Froyen model 44 to describe the densification of Al–12%Si alloy. In addition, they added the plastic flow criterion developed by Helle et al. 46 to accommodate densification of a deformable alloy. In the present case, there is a lack in mechanical, diffusion and creep data for this matrix in the literature; thus, we used data for 304 stainless steel (Table 6) as material parameters as its properties assimilate those of this Fe–Cr–Si–C matrix for the same temperature range. 47
Material data for matrix phase
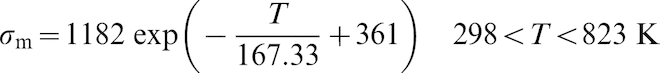
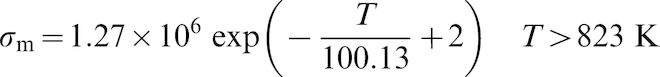
The plastic flow of the matrix (σm) reduces with temperature and was evaluated using the JMatPro simulation software
48
for the chemical composition: Fe–21.1Cr–5.7Si–0.1C (wt-%), as predicted by the thermodynamic calculation (Table 5). Figure 8 shows the evolution of the plastic flow of the matrix as a function of temperature. Above about 600°C, there is a sharp decrease in the plastic flow. This decrease was believed to occur as a result of thermal activation mechanism that induces the dislocation motion to overcome obstacles.49,50 The data were exponentially fitted to establish the relation between σm (in MPa) and the temperature, T (in Kelvin), as follows
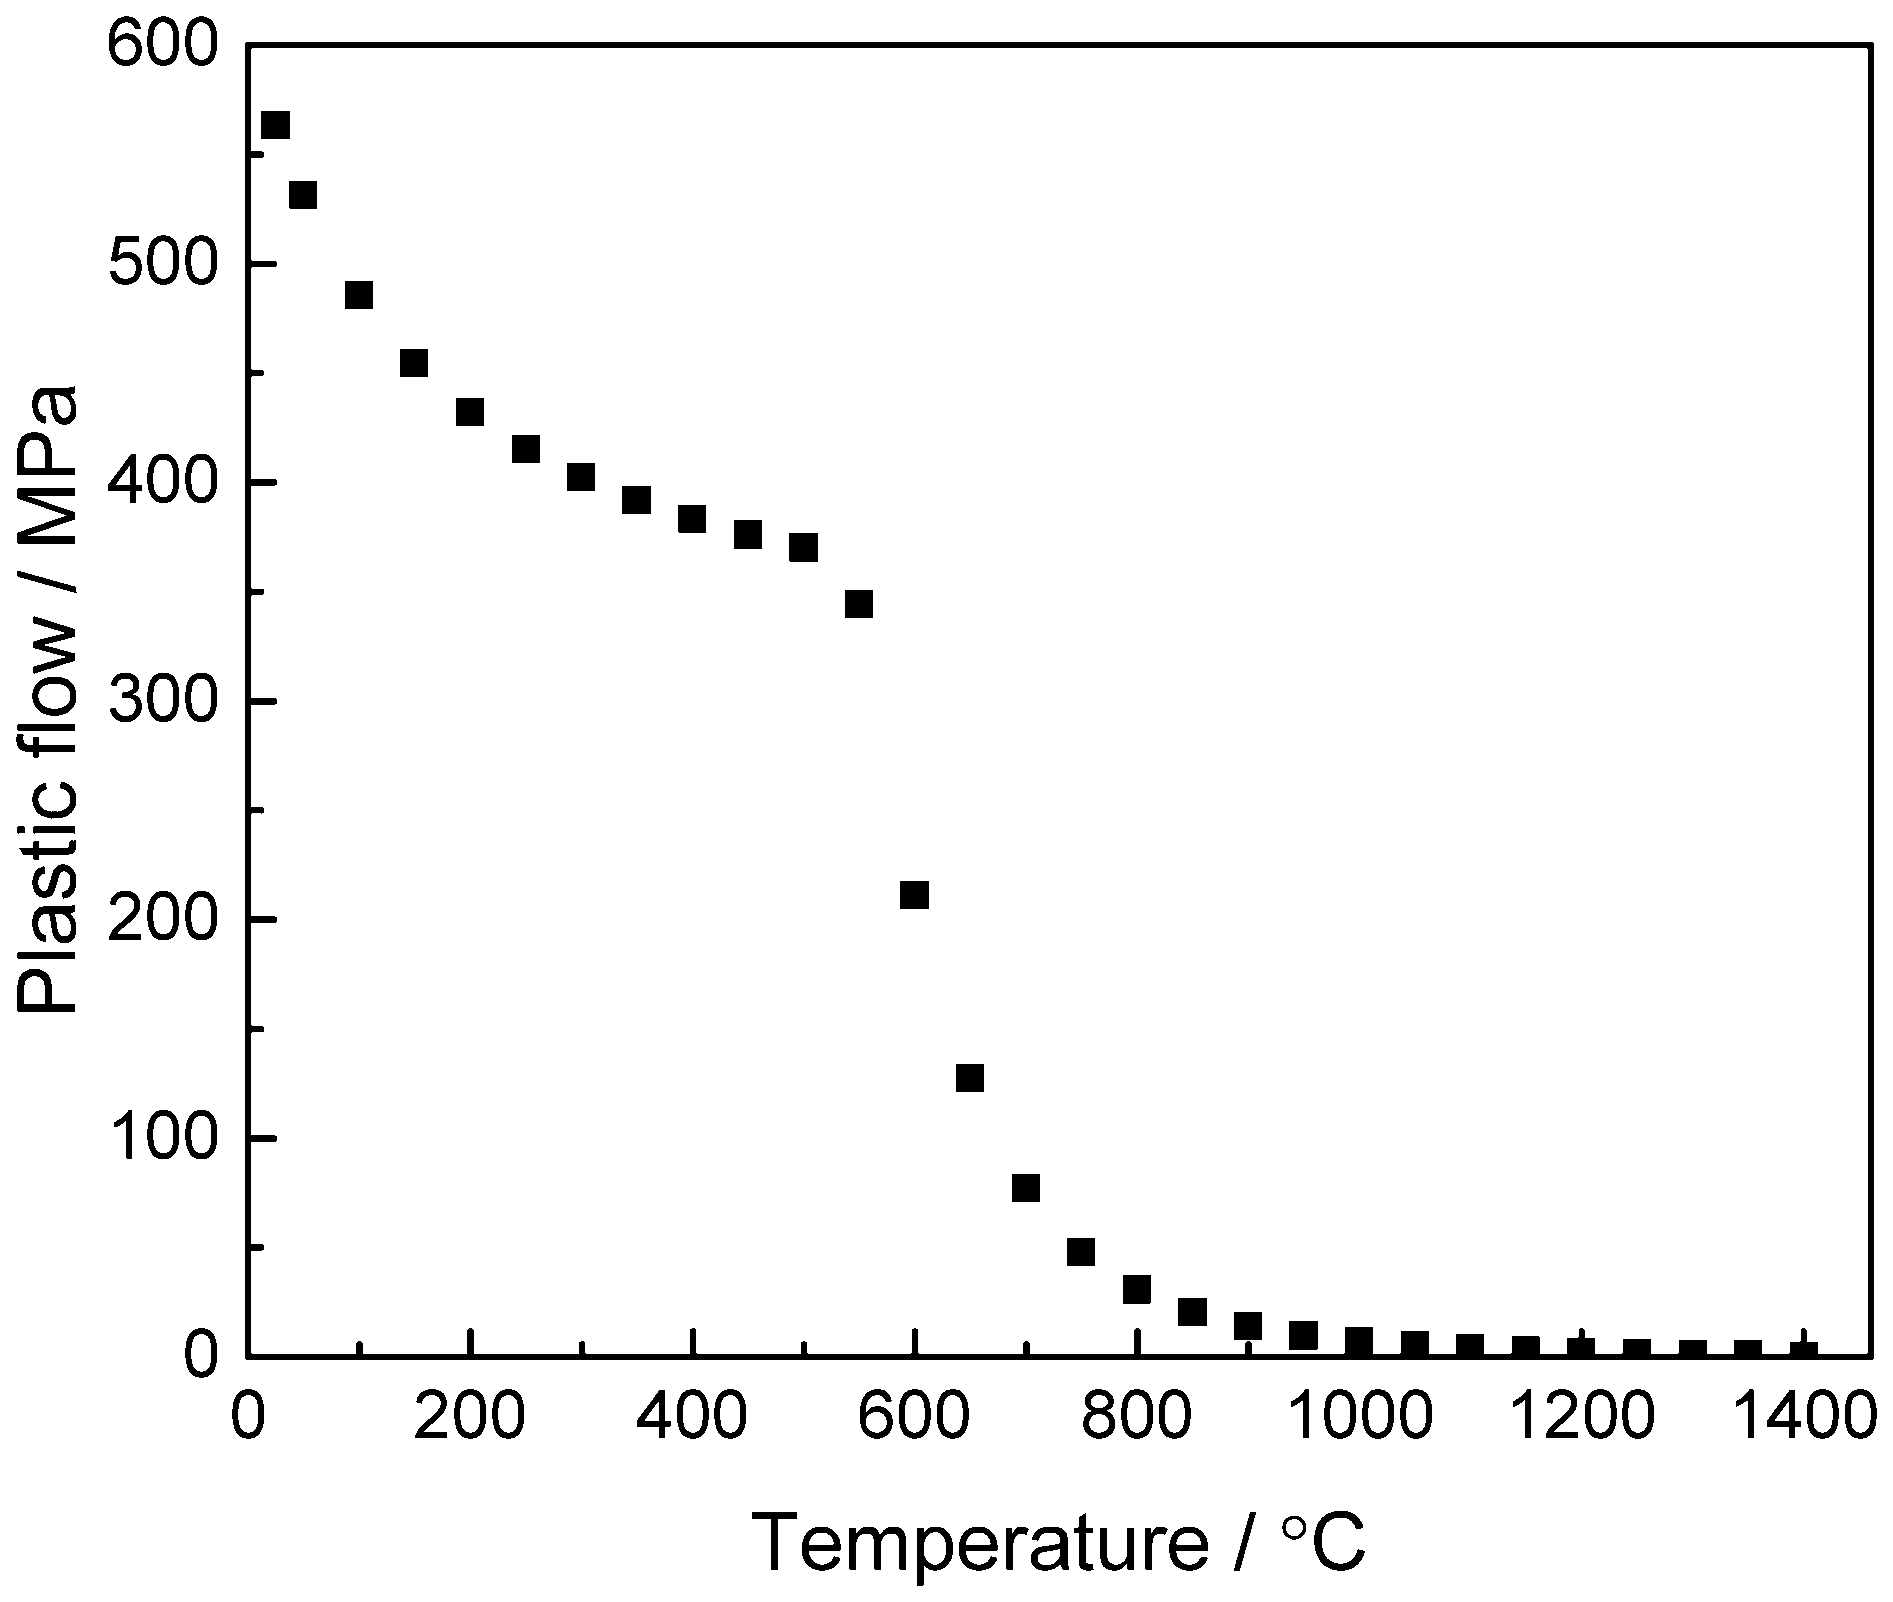
Plastic flow for Fe–21.1Cr–5.7Si–0.1C (wt-%) alloy (matrix) as function of temperature
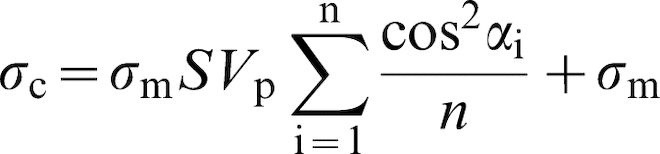
The incorporation of a relatively high fraction of the reinforcement (Cr,Fe)2B plates in the matrix of the investigated alloy resulted in increases in yield strength relative to the matrix material. Xiong et al.
51
found that the deformation of composites is controlled by the matrix deformation and reinforcement’ movements and rotations. Therefore, the influence of the presence of undeformable particles on the plastic flow of this MMC must be considered in the overall deformation criterion. The compression flow stress of a reinforced composite (σc) can be calculated by
51
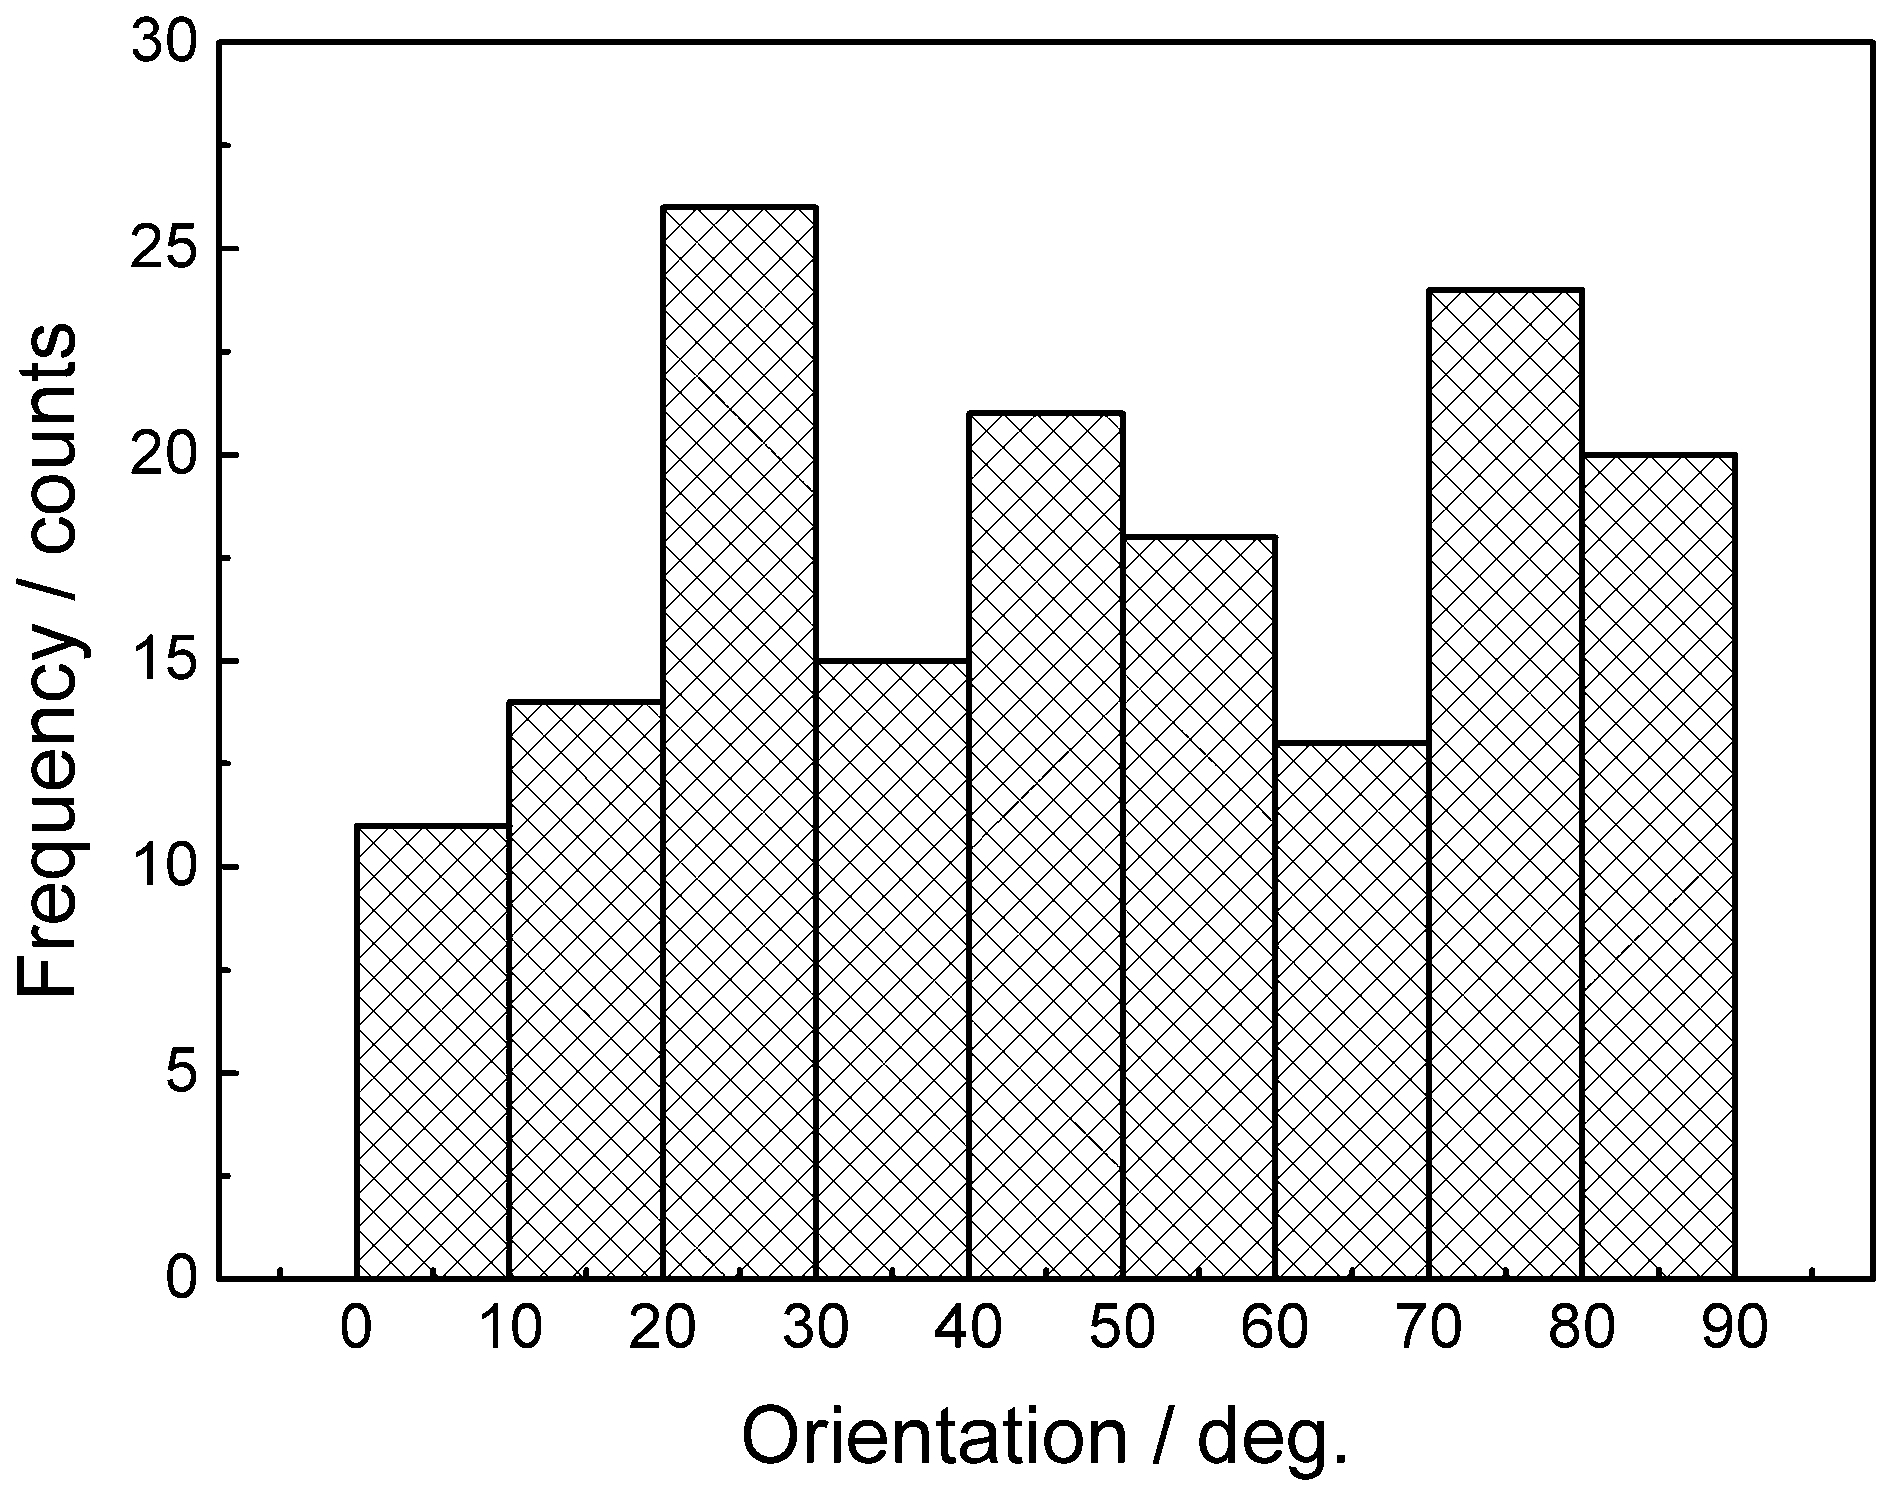
Orientation distribution frequency of plates to compression direction
Figure 10 compares the modelled overall densification with the experimental data as a function of time and temperature. The model started to deviate at 600°C. According to the model, the full densification should be reached at 1095°C under these pressing conditions.
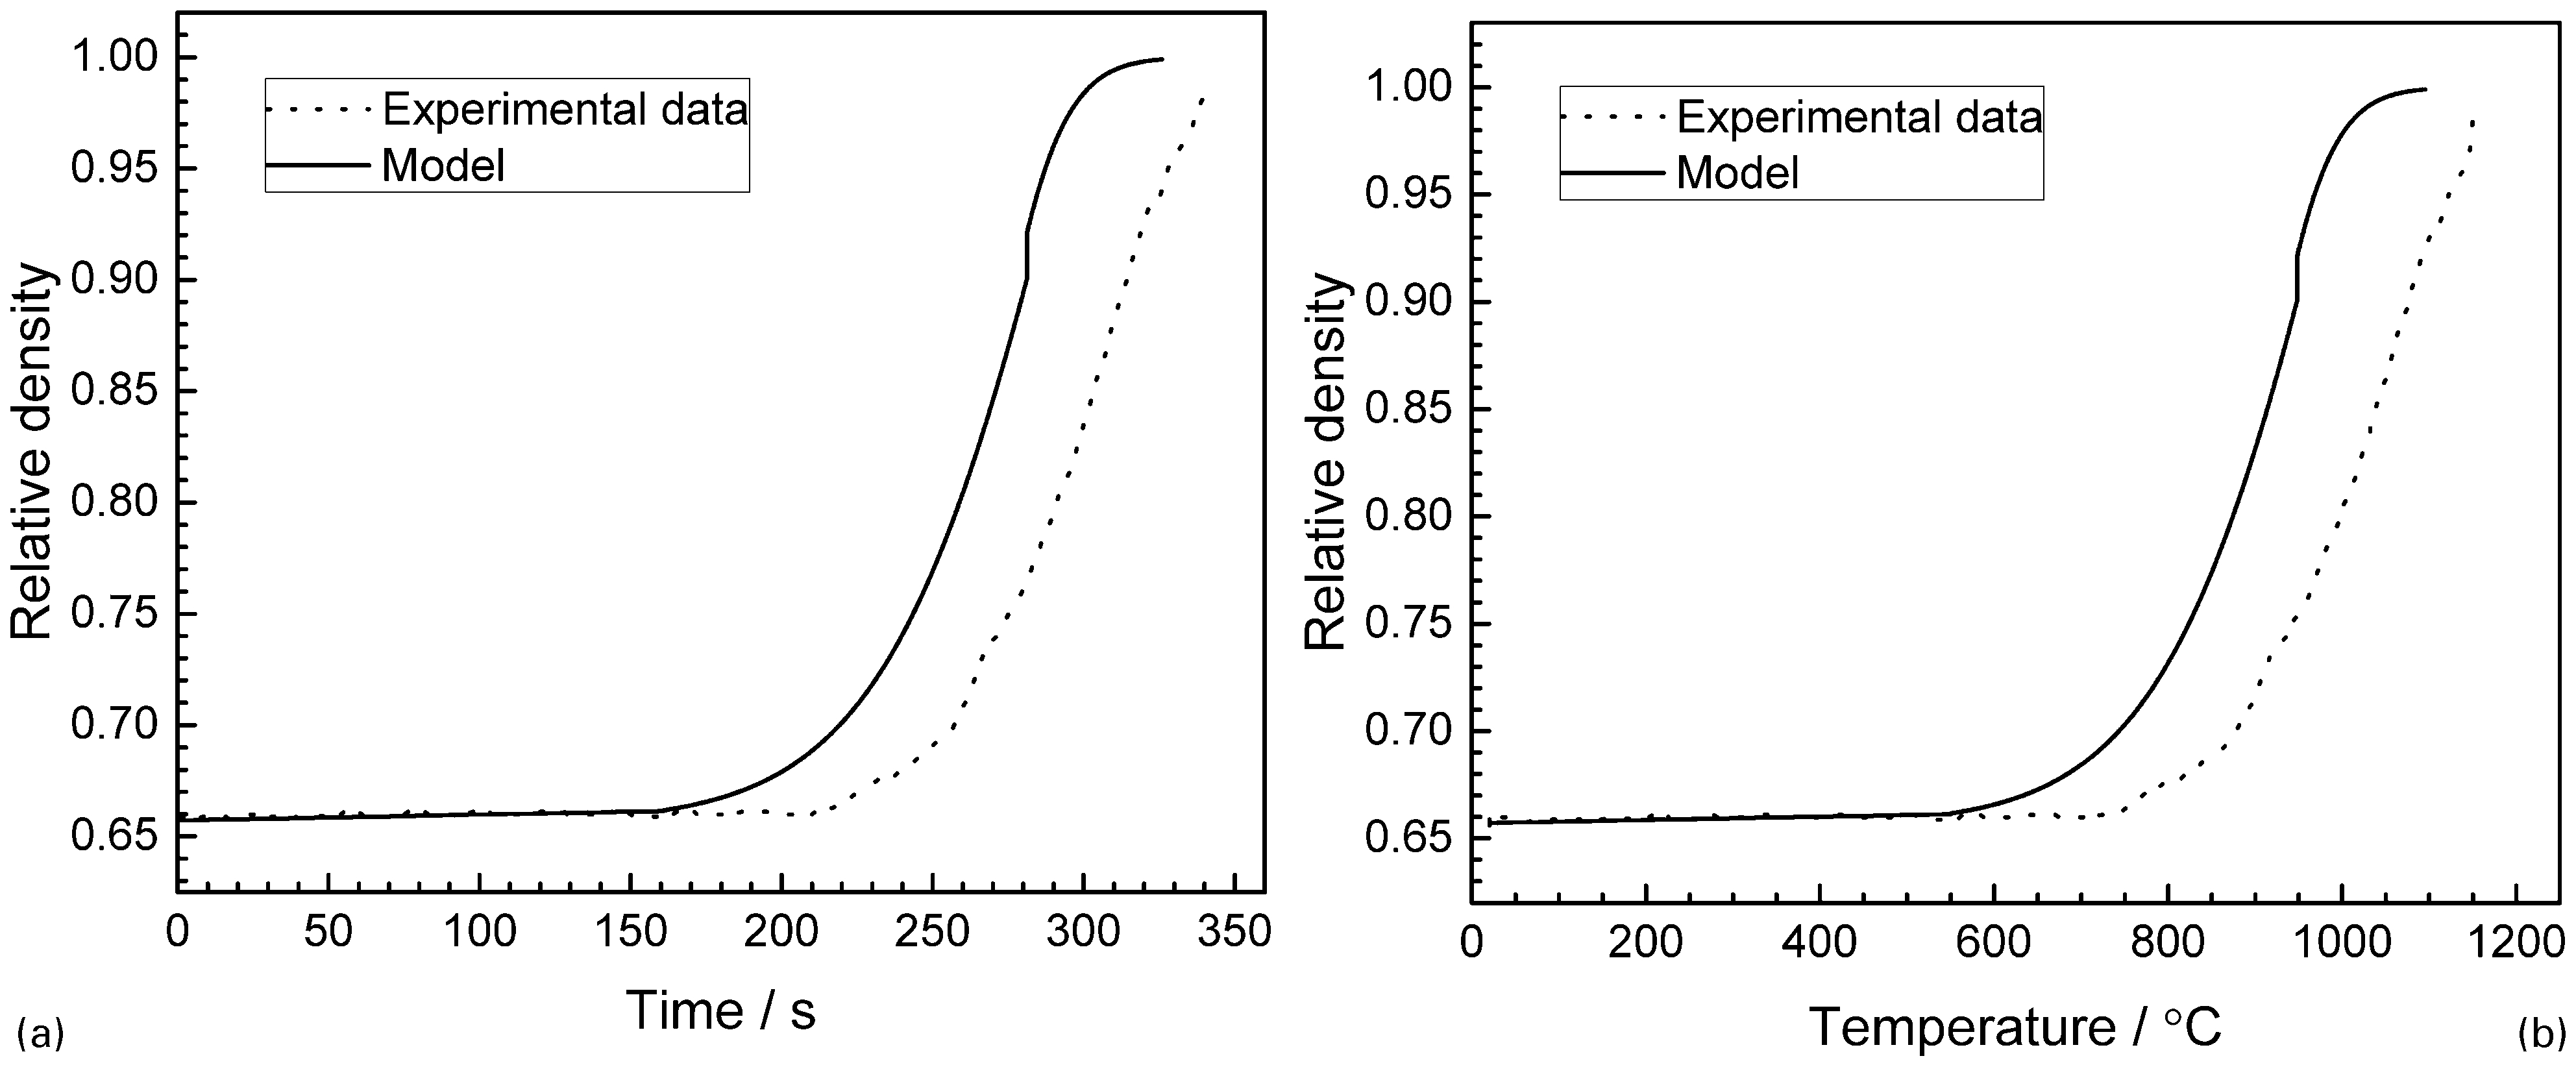
Calculated density by densification model as function of a time and b temperature vs experimental data
The deviation between the experimental data and model prediction of the densification may be attributed to one or both of the following:
it has been found that the punches exhibited higher temperature than the sample, regardless of the sample's conductivity.52–54 This temperature gradient decreased as the sintering temperature increased. In the used SPS system, the temperature was monitored during the process by a thermocouple that was placed inside the lower punch and was 2–3 mm below the sample. Therefore, the measured temperature was higher than the actual one inside the sample. The experimental densification curve (Fig. 10) should be shifted to the left
during the SPS process, the (Cr,Fe)2B plates sintered together, as shown in Fig. 4. The ratio of the contact points to the plate number of the starting powder was 0.44±0.12, and it increased to 0.73±0.1 after the SPS sintering at 1150°C for 10 min. The formation of this network between plates increased the yield strength of the matrix, and thus it has slowed down the densification. Figure 11 shows that when the densification starts, the densification rate of the model is higher than that of the experimental data up to about 970°C.
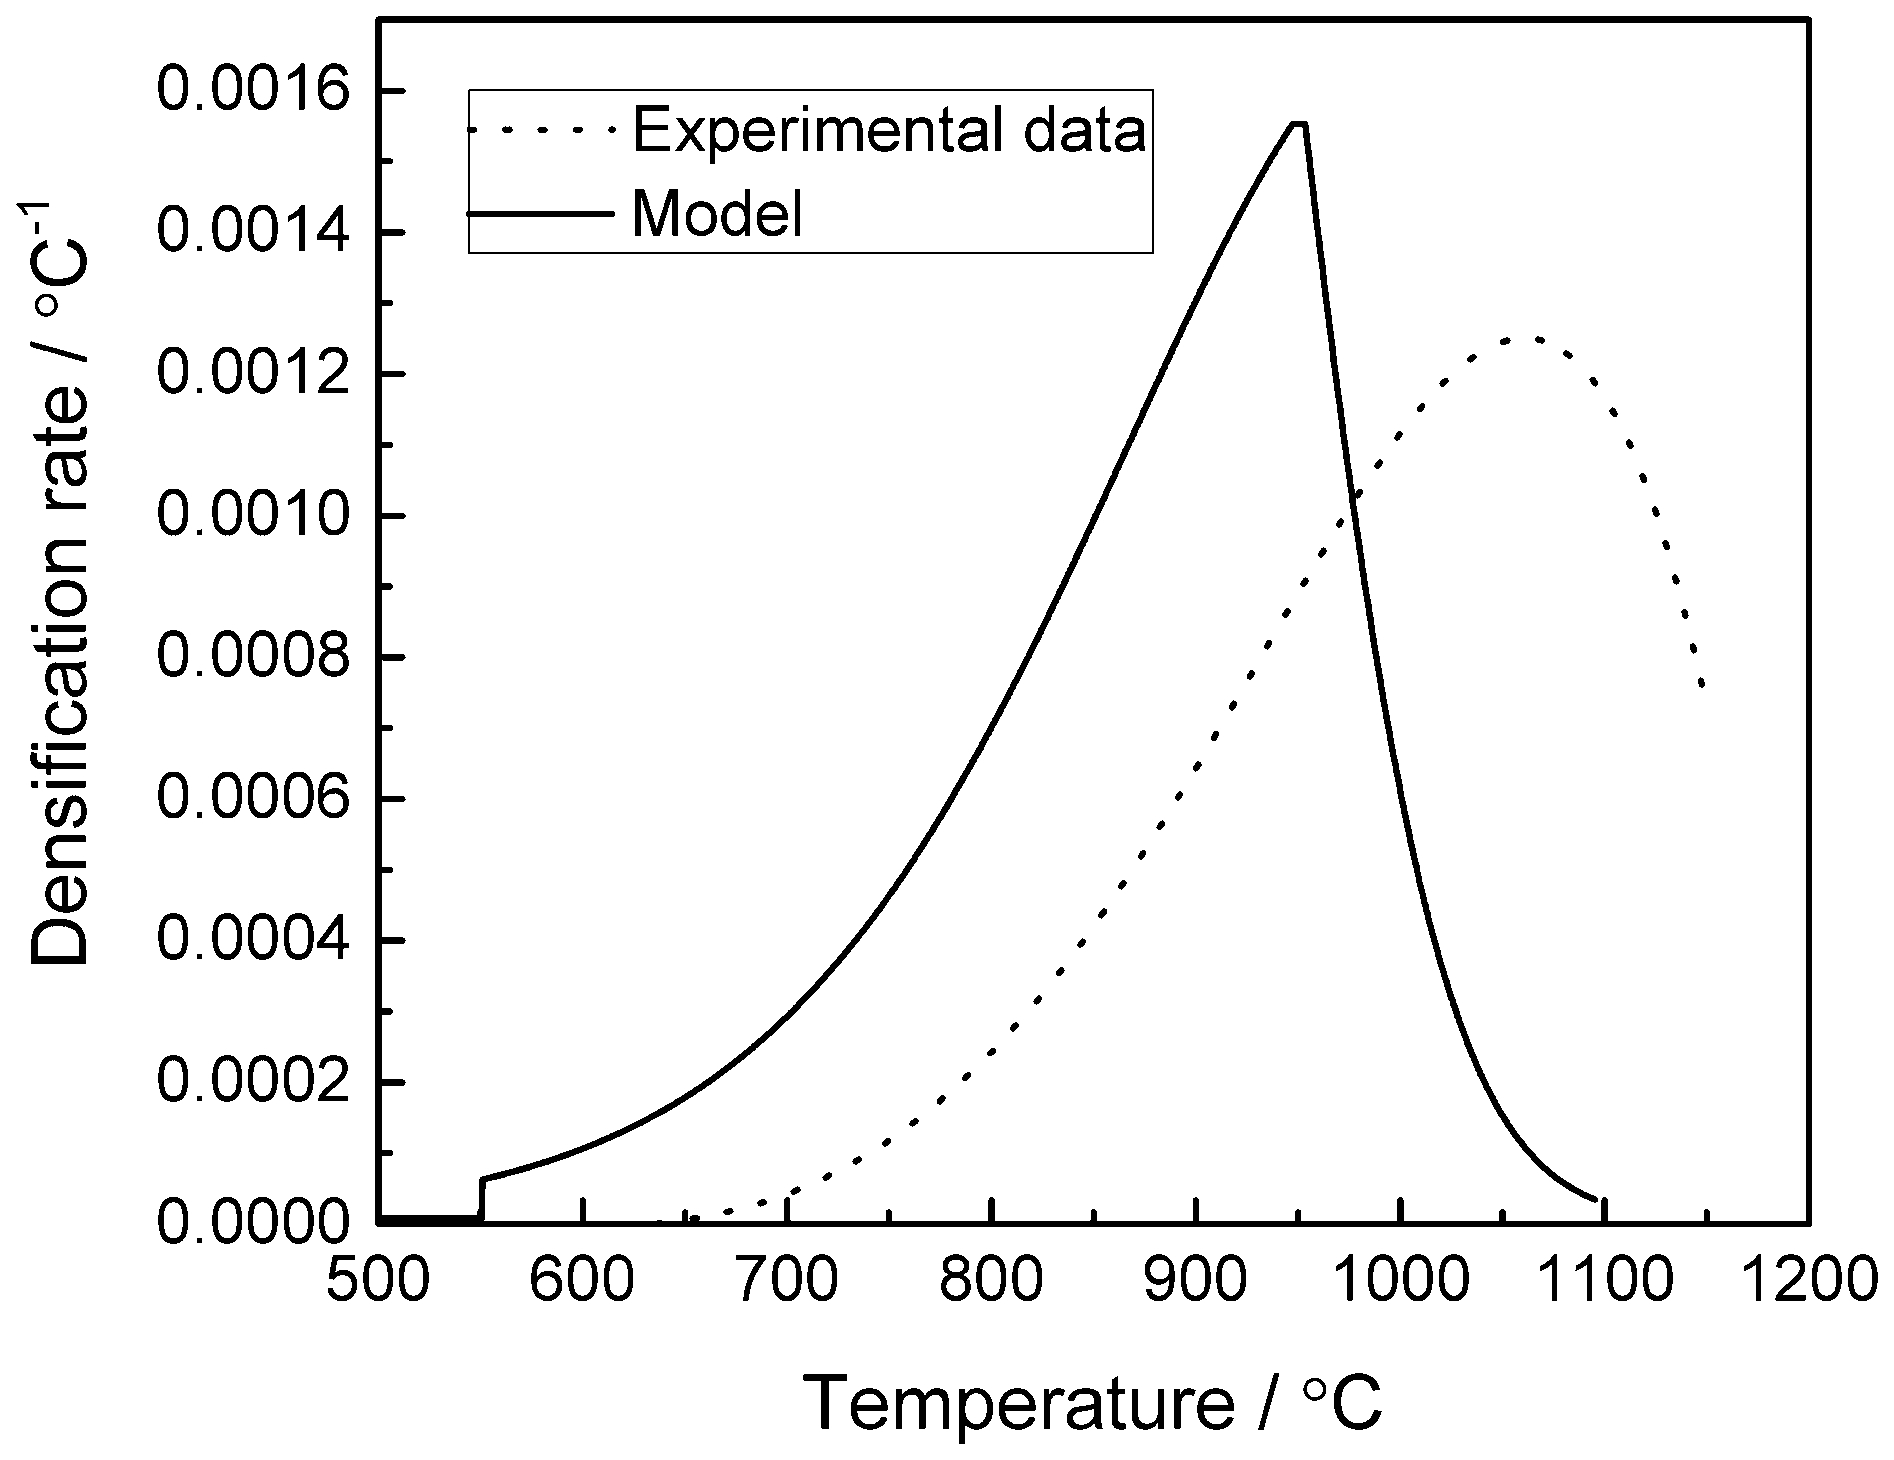
Densification rate for densification curves that were calculated by model and measured experimentally
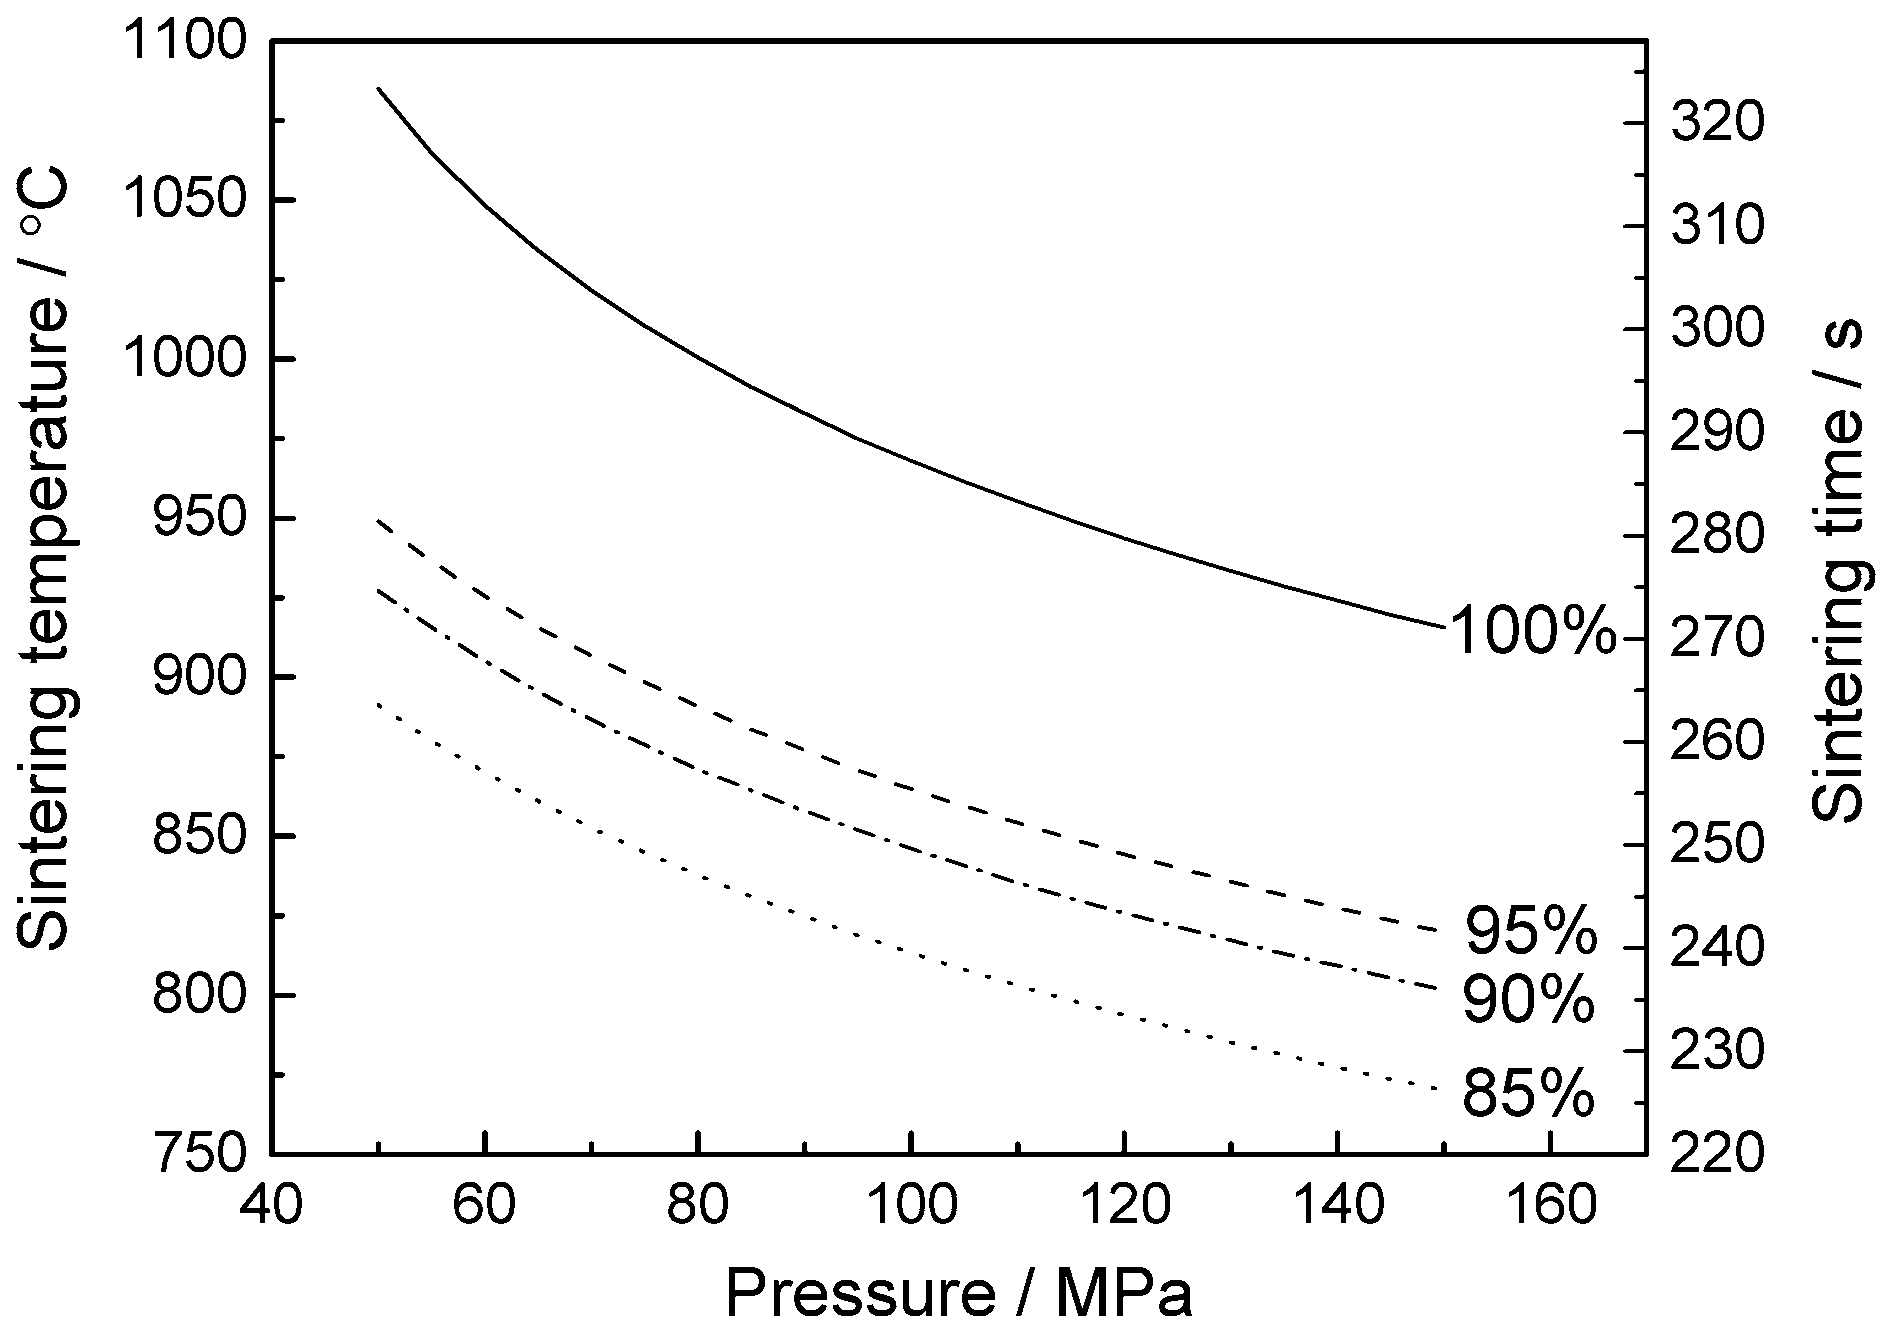
Densification map of sintered alloy by SPS at 200°C min−1 as function of sintering temperature, time and pressure
The model approached the experimental data at high temperature because (i) the temperature difference between the punch and the sample decreased and (ii) the contribution of the reinforcement on the yield strength of the composite was reduced at high temperature and thus the effect of the network formation between plates was diminished.
Using this model, the densification map of this alloy as sintered by SPS at 200°C min−1 heating rate as a function of sintering temperature, time and pressure is shown in Fig. 12. The sintering temperature linearly increased with time. As the temperature increased, the specimen density increased. When the sintering pressure increases from 50 to 150 MPa, while keeping the other parameters constant, the sintering temperature to reach full densification (100%) decreases from 1085 to 916°C.
The sintering temperature and time at which full densification reaches were also calculated as a function of the volume fraction and aspect ratio of the plates, as shown in Fig. 13. As the volume fraction or aspect ratio of the (Cr,Fe)2B phase decreases, the temperature decreases. The fraction of (Cr,Fe)2B can be mainly decreased by reducing the B content.8,15 If the alloy do not contain this reinforcement plates, full densification occurs at 937°C. The aspect ratio of the (Cr,Fe)2B plates can be reduced by heat treatment,8,43 and full densification should be reach at 971°C when the aspect ratio is unity.
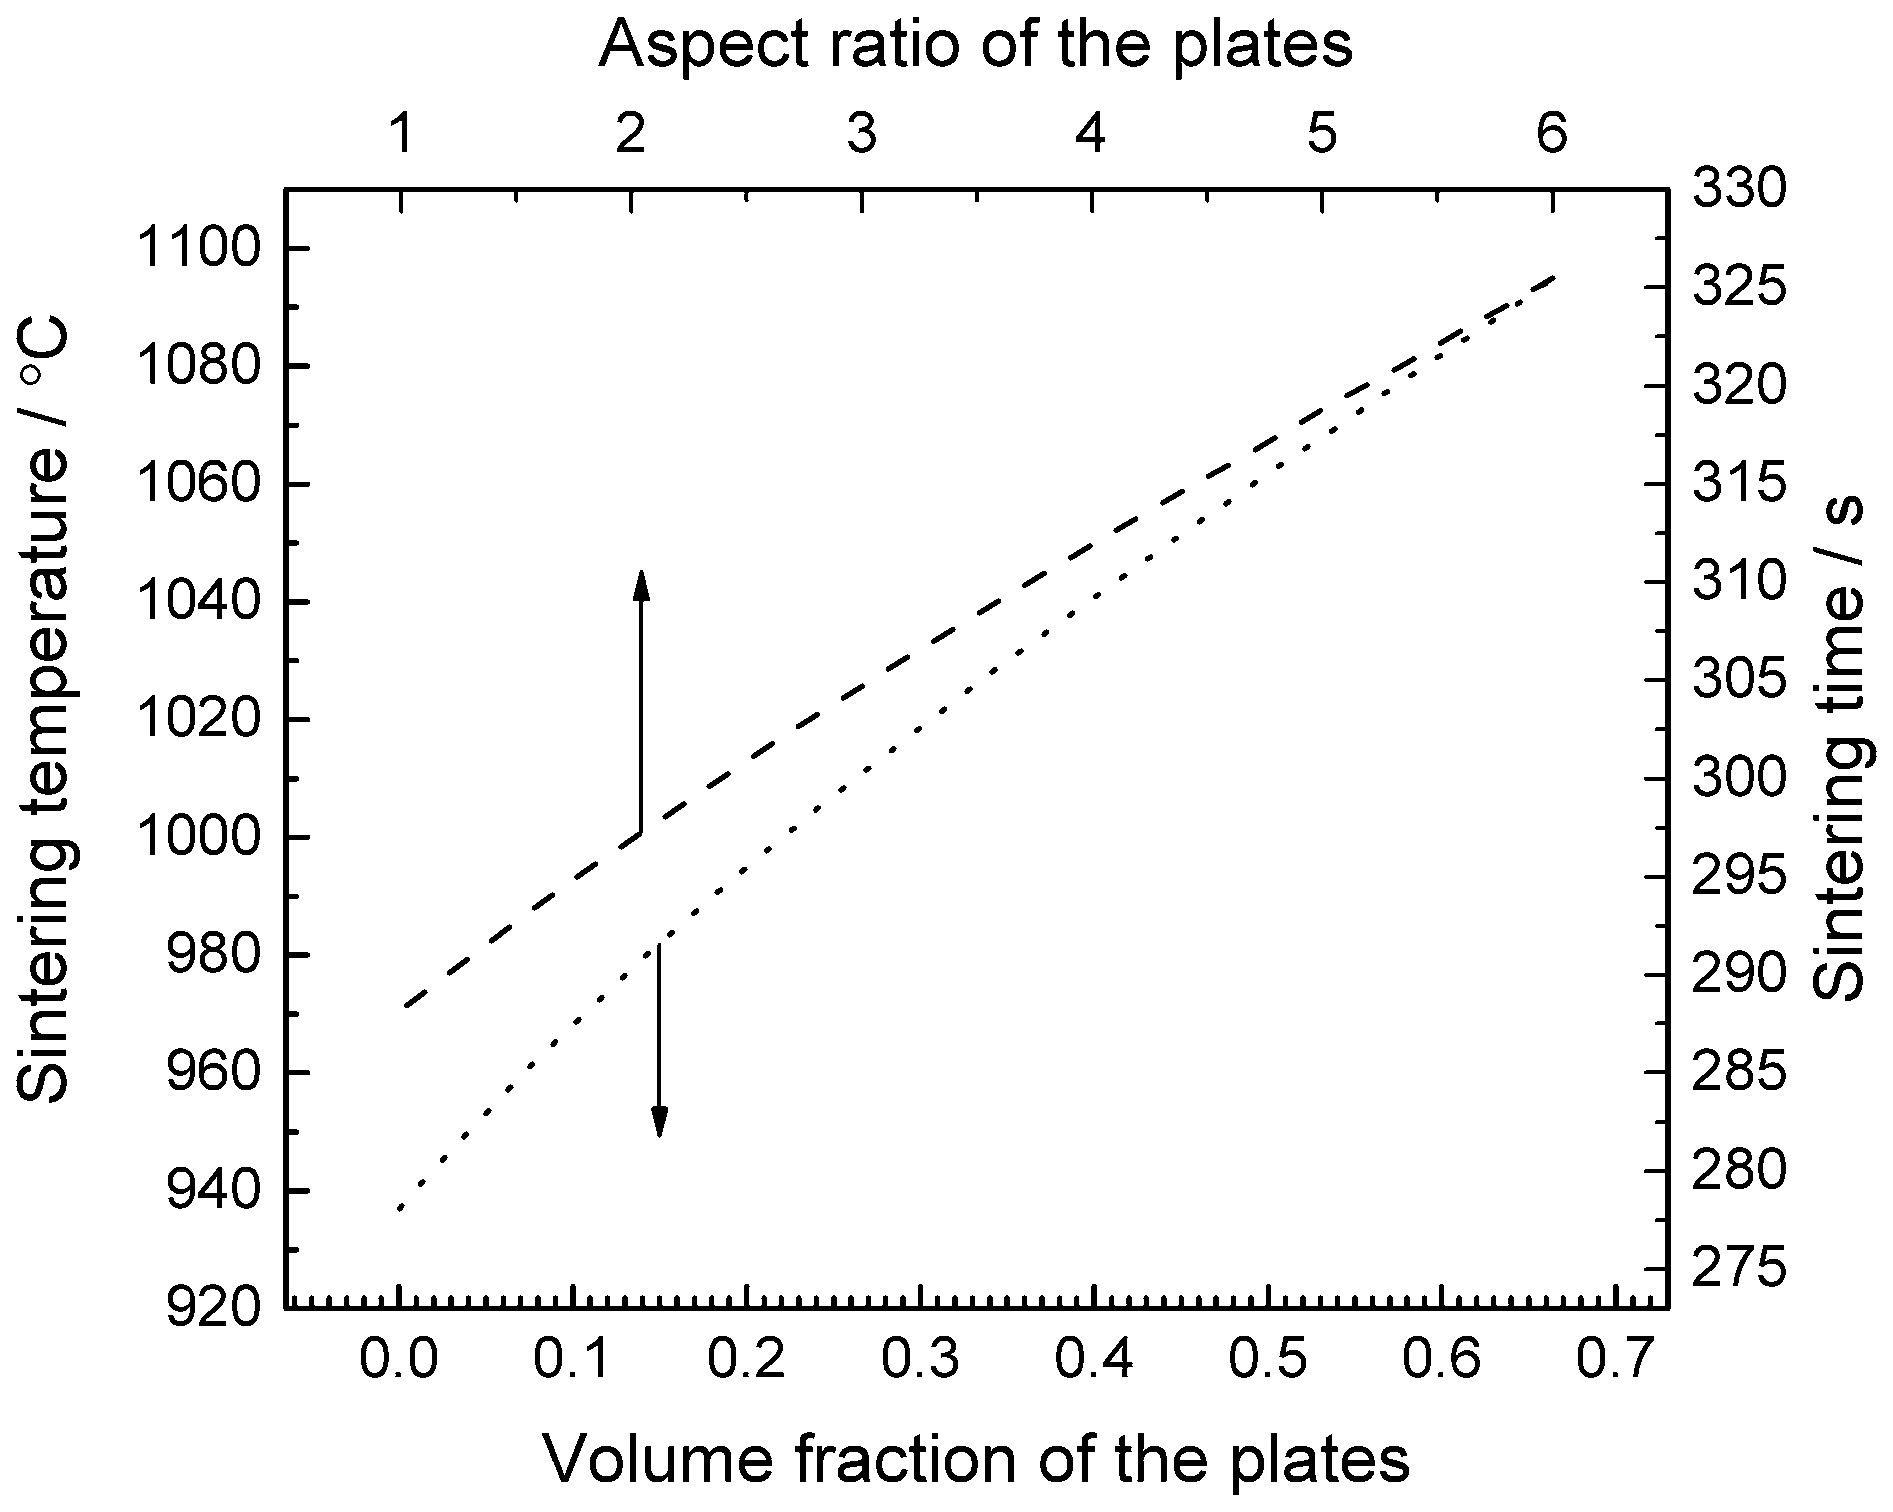
Full densification sintering temperature and time as function of volume fraction and aspect ratio of reinforcement (Cr,Fe)2B plates
Conclusion
In the present study, the gas atomised Fe–45Cr–5.9B–2Si–0.1C (wt-%) alloy powder was sintered using the SPS process. The microstructure and densification were investigated, and the following conclusions can be drawn. The alloy was fully sintered at temperature lower than solidus temperature for a short period of time. The solidified powder and sintered specimen mainly contained the primary (Cr,Fe)2B plates and the Fe based bcc solid solution matrix composed of Cr and Si. In addition, the alloy contained a small amount of the (Cr,Fe)7C3 precipitate. Because the fraction, shape and aspect ratio of (Cr,Fe)2B did not change as a result of the sintering, the properties were expected to be similar before and after sintering. The accepted constitutive SPS densification model was augmented by including the effect of the hard (Cr,Fe)2B reinforcement to describe the densification evolution of this MMC during the SPS process. The model was in reasonable agreement with the experimental results.
Footnotes
Acknowledgements
The authors would like to thank Liquid Metal (CA, USA) for the powder provided, Sente Software Ltd (UK) for the high temperature strength calculations and Netzsch Instruments North America (LLC applications laboratory, Burlington, MA, USA) for the DSC testing. The authors are grateful to King Fahd University of Petroleum and Minerals (KFUPM, Dhahran, Saudi Arabia) for the scholarship awarded to Ahmad A. Sorour.