
Abstract
The programme for the powder metallurgy (PM) gear rolling process to predict the densification and deformation behaviours was developed through the finite element method. The compression test was carried out to obtain the material parameters for Shima–Oyane model including six parameters with respect to yield surface and workhardening. Those parameters were employed to analyse the densification behaviour of porous material during the rolling process. The simulation results with respect to the plastic deformation and the densification behaviour of the PM gear were confirmed and verified with the experimental results.
Introduction
Powder metallurgy (PM) has been widely used in the manufacturing industry, since it has several advantages including shape complexity, low cost and high productivity. The PM gear produced by compaction and sintering is one such example. However, because the PM gear has low density and a porous surface, it has not been used in highly stressed situations. The density must be increased when the PM gear is applied to heavy load, because the density is strongly correlated with the mechanical properties of PM products. Local surface densification can improve the performance of the product. Various processes have been developed for surface densification, and the PM gear rolling process is considered to be a simple promising technology.1,2
The PM gear rolling process contains two kinds of gears: the PM gear and the rolling gears. The PM gear has ∼90% relative density. On the other hand, the rolling gears have full density and should be made of a hard material such as tool steel. The rolling gears rotate and move slightly, narrowing the gap between themselves. As a result, the PM gear is deformed and the surface density increases. The rolling gears are considered to be rigid and do not deform during the process. Figure 1 shows the schematic diagram, with the PM gear at the centre and the rolling gears beside it.
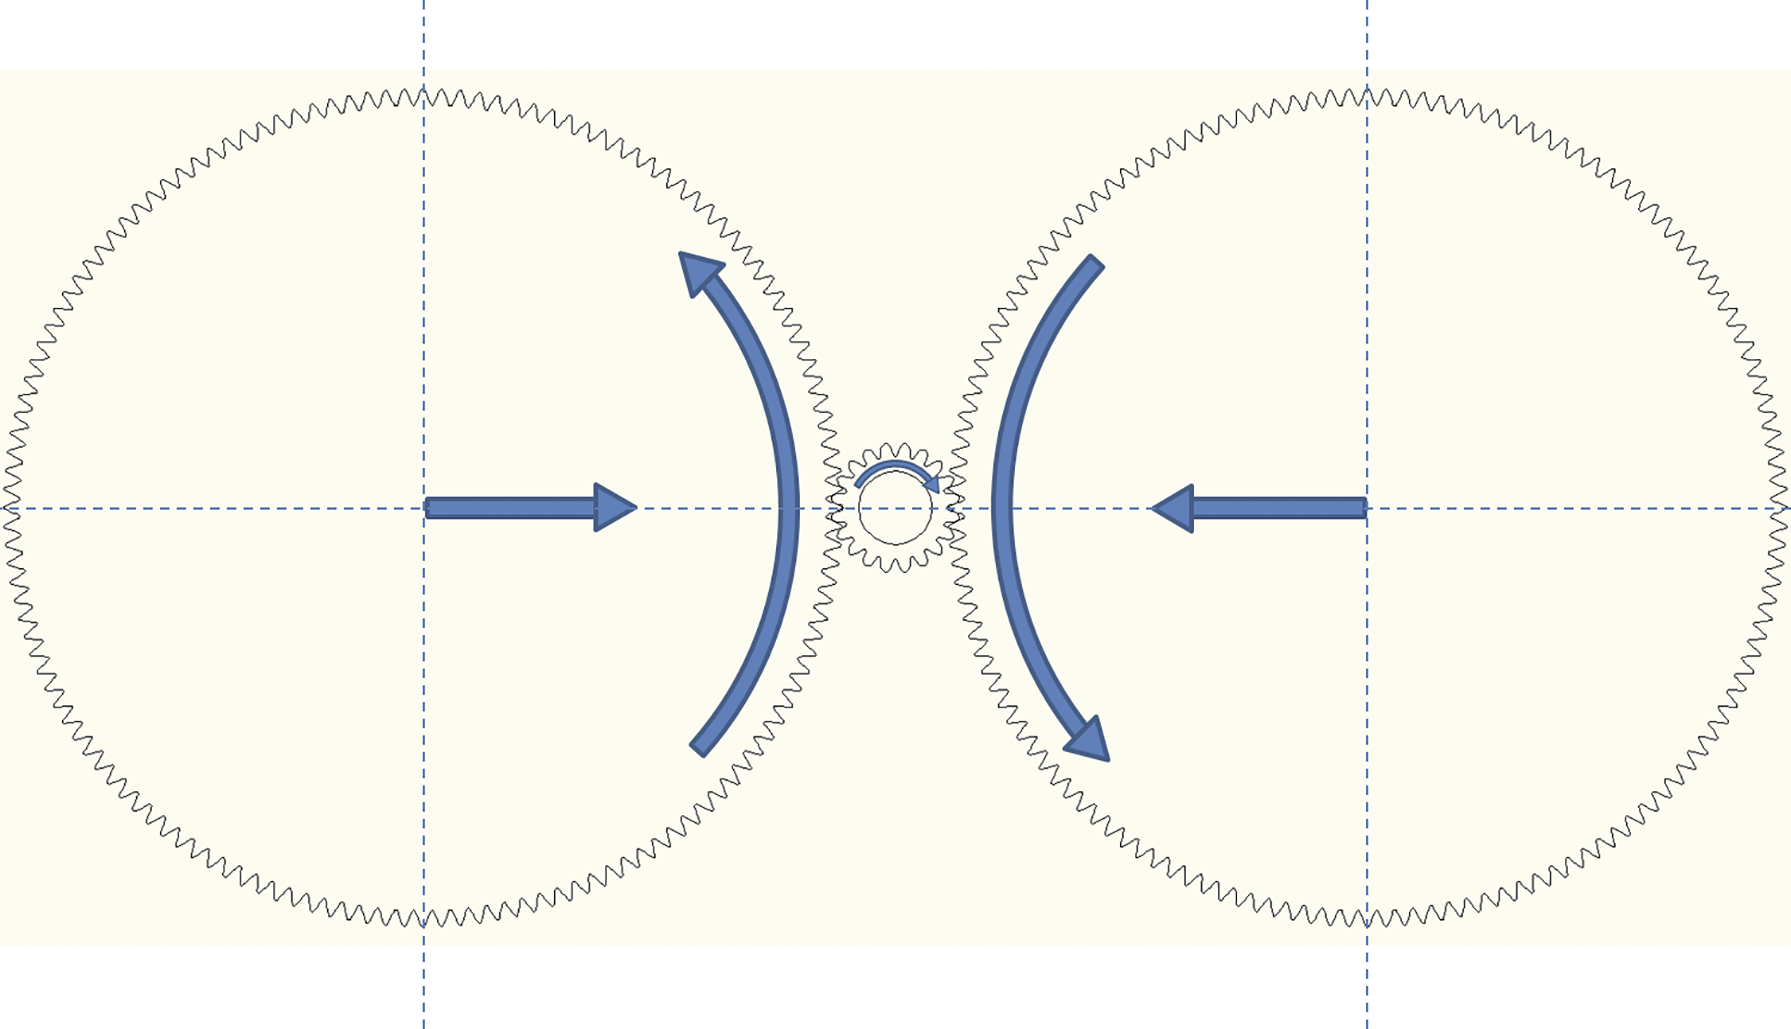
Schematic diagram of PM gear and rolling gears. Powder metallurgy gear is at centre, and others are rolling gears. Rolling gears rotate and move slighltly, narrowing gap between themselves
Finite element method simulation can predict the plastic deformation and surface densification. It can be an effective tool to design the rolling gears so that the PM gear can have the required specification after the rolling process. This study introduces a simulation programme that can be applied to the actual manufacturing process and verifies its performance.
Theoretical background
The gear rolling process improved the mechaincal properties of gear teeth with high density and fabrication precision. The constitutive model, which can predict the densification and the deformation behaviour of the sintered compacts, is necessary to numerically describe the process. Many models such as the Cam–Clay model,
3
the Drucker–Prager model
4
and the Shima-Oyane model
5
were developed. Both Cam–Clay and Drucker–Prager models focus on the behaviour of powder during the compression and tension tests. On the other hand, the Shima–Oyane model is based on uniaxial compression test, so it may be difficult to predict the densification behaviour of metal powder under multiaxial and hydrostatic stress during the multilevel die compaction and cold isostatic pressing.
6
However, the Cam–Clay model and the Drucker–Prager model are not suitable to pridict the crack posibility, because those constitutive models do not allow stress of sintered compacts under the tensile force to exceed failure line. In addition, those models can affect the convergence of numerical analysis, because the constitutive models are not continuous between failure line and cap surface. The yield surface Φ of porous materials originally suggested by Shima and Oyane can consider these issues. Many researchers have applied the model to various types of powders.7–9 The yield surface Φ can be expressed as

 and p represent the effective stress and the hydrostatic stress respectively. ρ is the relative density and σm is the flow stress of matrix material respectively. Equation (2) shows the workhardening behaviour.
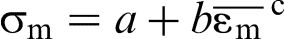
 is the effective strain of matrix material, and a, b and c are the material parameters that can be determined by the uniaxial compression test of fully densified specimen.
7
is the effective strain of matrix material, and a, b and c are the material parameters that can be determined by the uniaxial compression test of fully densified specimen.
7
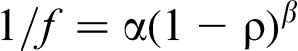
Shima et al. introduced two functions, f and f′, which represent the degree of the influence of the hydrostatic stress component and the ratio of the apparent stress applied to the porous bodies and the effective stress applied to the matrix respectively. When the uniaxial compression occurs, σ2 = σ3 = 0 and σm = σ1/3, so f and f′ can be expressed as
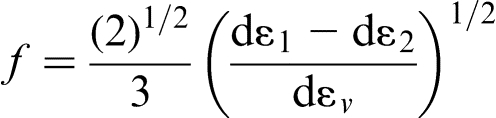
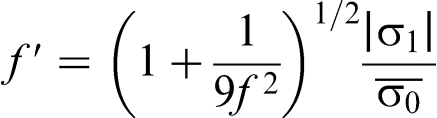
 represents the yield stress of the matrix material, and ε1, ε2 and εv are the compressive strain, the radial strain and the volumetric strain respectively. Then, when the yield stress is plotted against the relative density, f′ is determined.
When 1/f is plotted, it can be assumed to be
The function f′ is only dependent to the relative density of the material.
2
Then, we can assume that
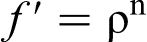
Obtained f and f′ for each relative density can determine the material parameters, which are α, β and n.
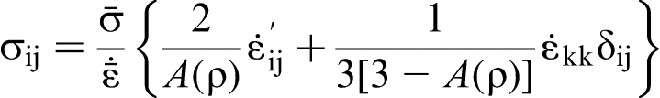
When associated flow rule is applied to the equation (1), the following stress–strain rate relationship is derived
10
 and
and
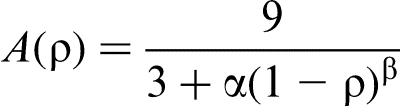
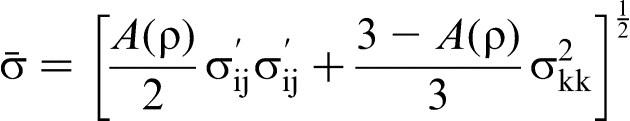
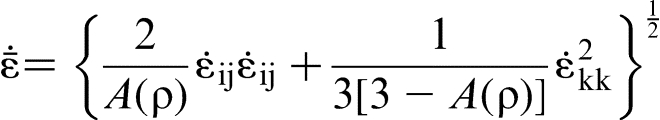
 represent the stress tensor, the deviatric strain rate and the volumetric strain rate respectively. A(ρ) is a function of the density expressed as
Moreover, the effective stress
 and the effective strain rate
 are expressed as
Experimental
Specimen preparation
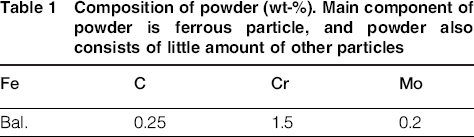
Iron based alloy powder was used to this research. The base powder is prealloyed with chromium and molybdenum leading to good response for heat treatments. Table. 1 shows the composition of the powder. Tap density of the powder is 3.48 g cm− 3 (∼0.44 relative density). When the powder is sintered, the sintered the density is from 7.45 to 7.55 g cm− 3 (∼0.95 relative density). The powder was produced by water atomisation. The particle size is from 100 to 250 μm. Figure 2 shows the powder has irregular shape.
Composition of powder (wt-%). Main component of powder is ferrous particle, and powder also consists of little amount of other particles
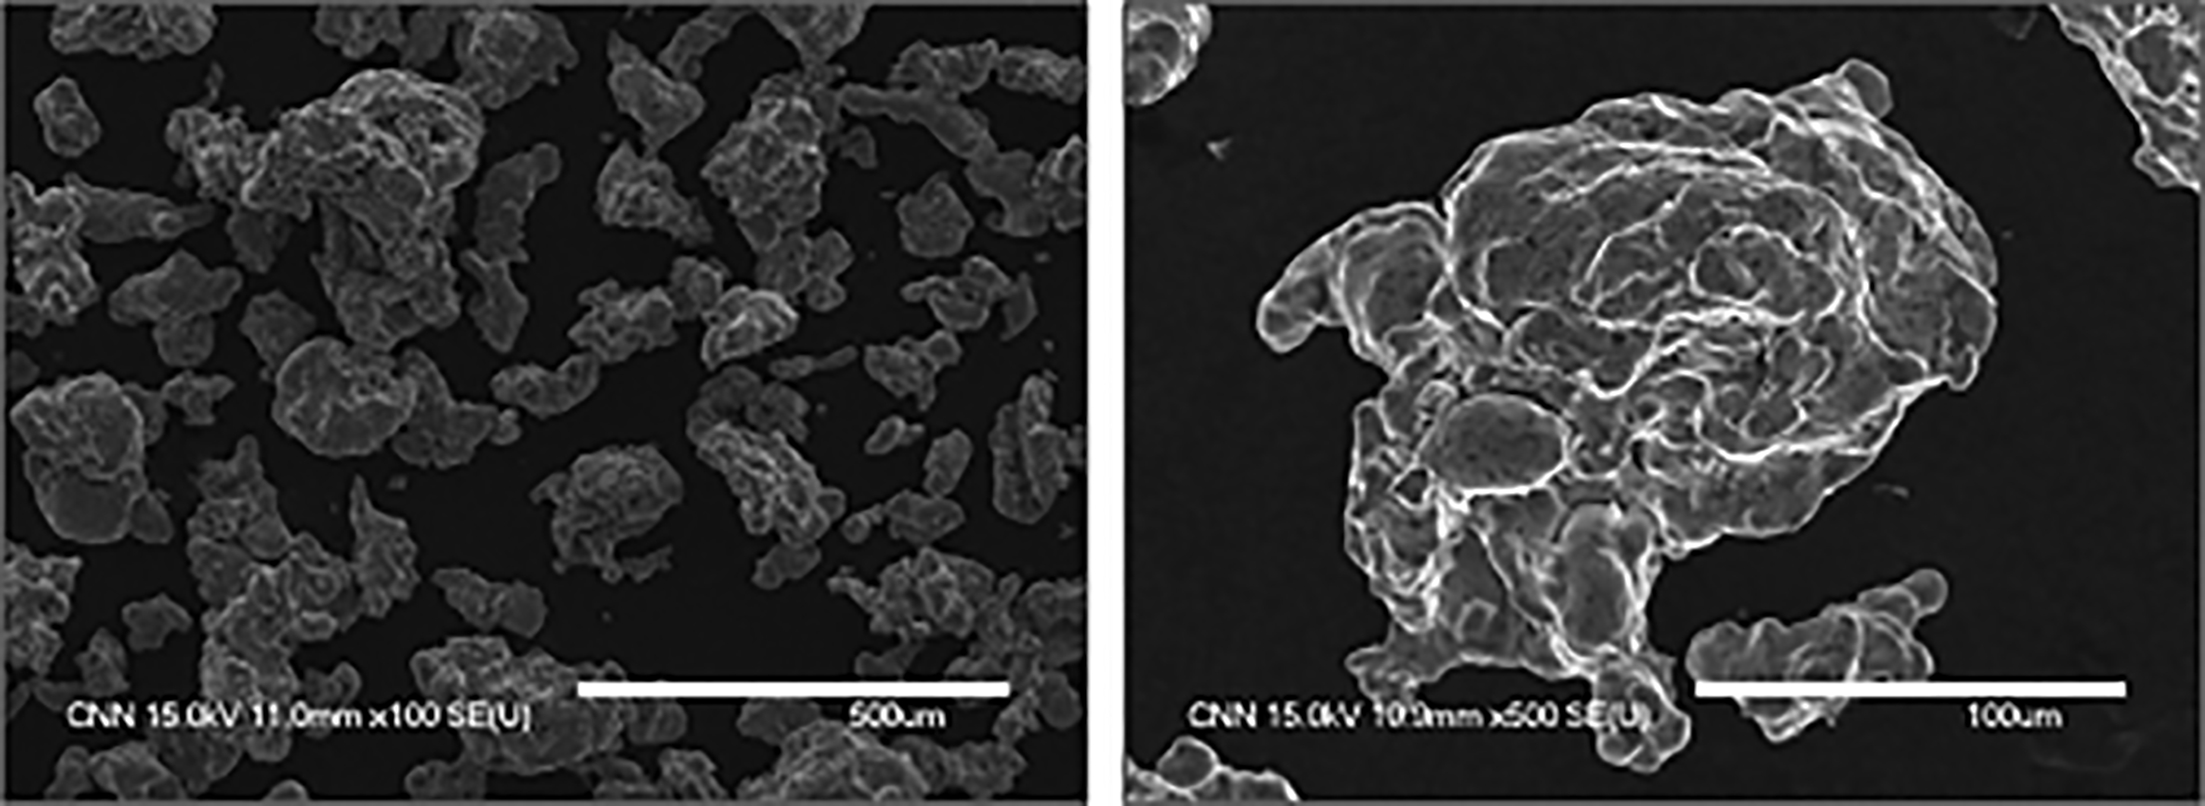
Images (SEM) of powder material. This figure shows particles' shape used in this research is irregular
The compression test was conducted to find the six unknown material parameters, which are α, β and n from equation (1), and a, b and c from the equation (2). The specimens were made by die compaction, sintering and hot isostatic pressing (HIP). Finally, the unkown parameters were obtained by fitting the data.
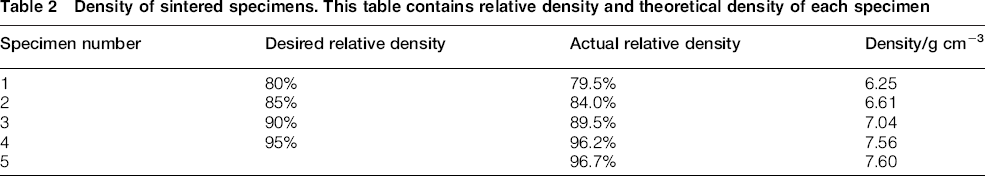
Specimens were prepared as cylinders with 10 mm diameter and 13 mm height. Their size was kept suitable for the compression test and the HIP process. Five specimens were prepared by just compaction and sintering with different relative densities, and the other specimen was prepared by additional HIP to reach full density. Table 2 shows the density of the specimens.
Density of sintered specimens. This table contains relative density and theoretical density of each specimen
Compression tests
The specimens have been immobilised by platen and Teflon sheet in order to prevent the bulging effect of the specimens and reduce the friction between the specimen and the die. The compression was conducted using the universal testing machine (UTM UDH-50, Shimadzu) suitable for the tension/compression/bending test. The tests were conducted with small increases of the load. The diameter and the height were simultaneously measured during the test.
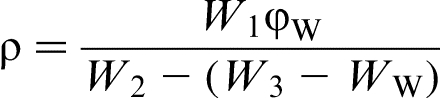
Measuring the density of specimens except the hot isotropic pressed (HIPed) specimen needs an additional step, because the specimens have pores in their surfaces. Wax was used to cover the pores before the density measurement. The density was obtained by equation (10)

For the HIPed specimens (at 1200°C, 100 MPa for 1 h), the entire compression tests and measurements except waxing were performed.
Results and discussions
Material parameters
The five sintered specimens with different relative densities give required data for three material parameters, which are α, β and n, and the HIPed specimen is used for the other three parameters, which are a, b and c.
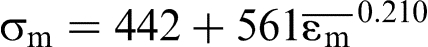
Figure 3 shows the flow stress and the plastic strain resopnse of the HIPed specimen during the uniaxial compression test. A 441.6 MPa yield stress was obtained from the test. The fitted values for a, b and c are 442 MPa, 561 MPa and 0.210 respectively. The fitted curve can be expressed as
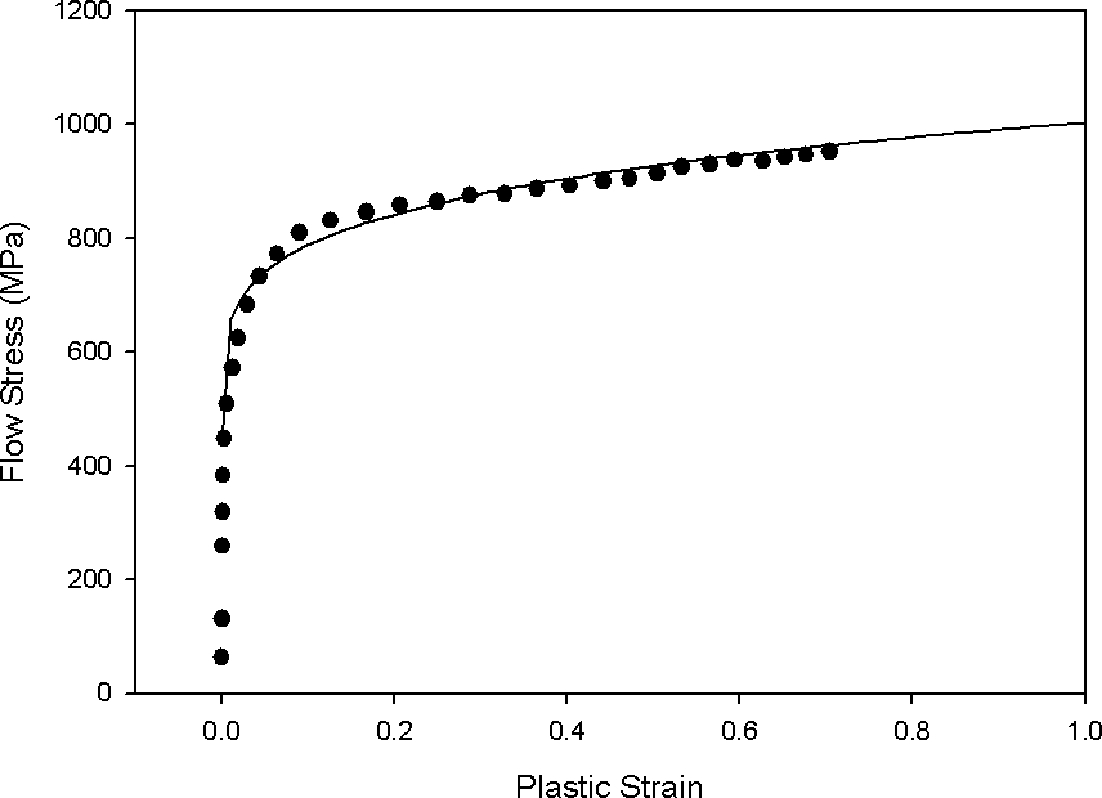
Relationship between uniaxial stress and plastic strain for
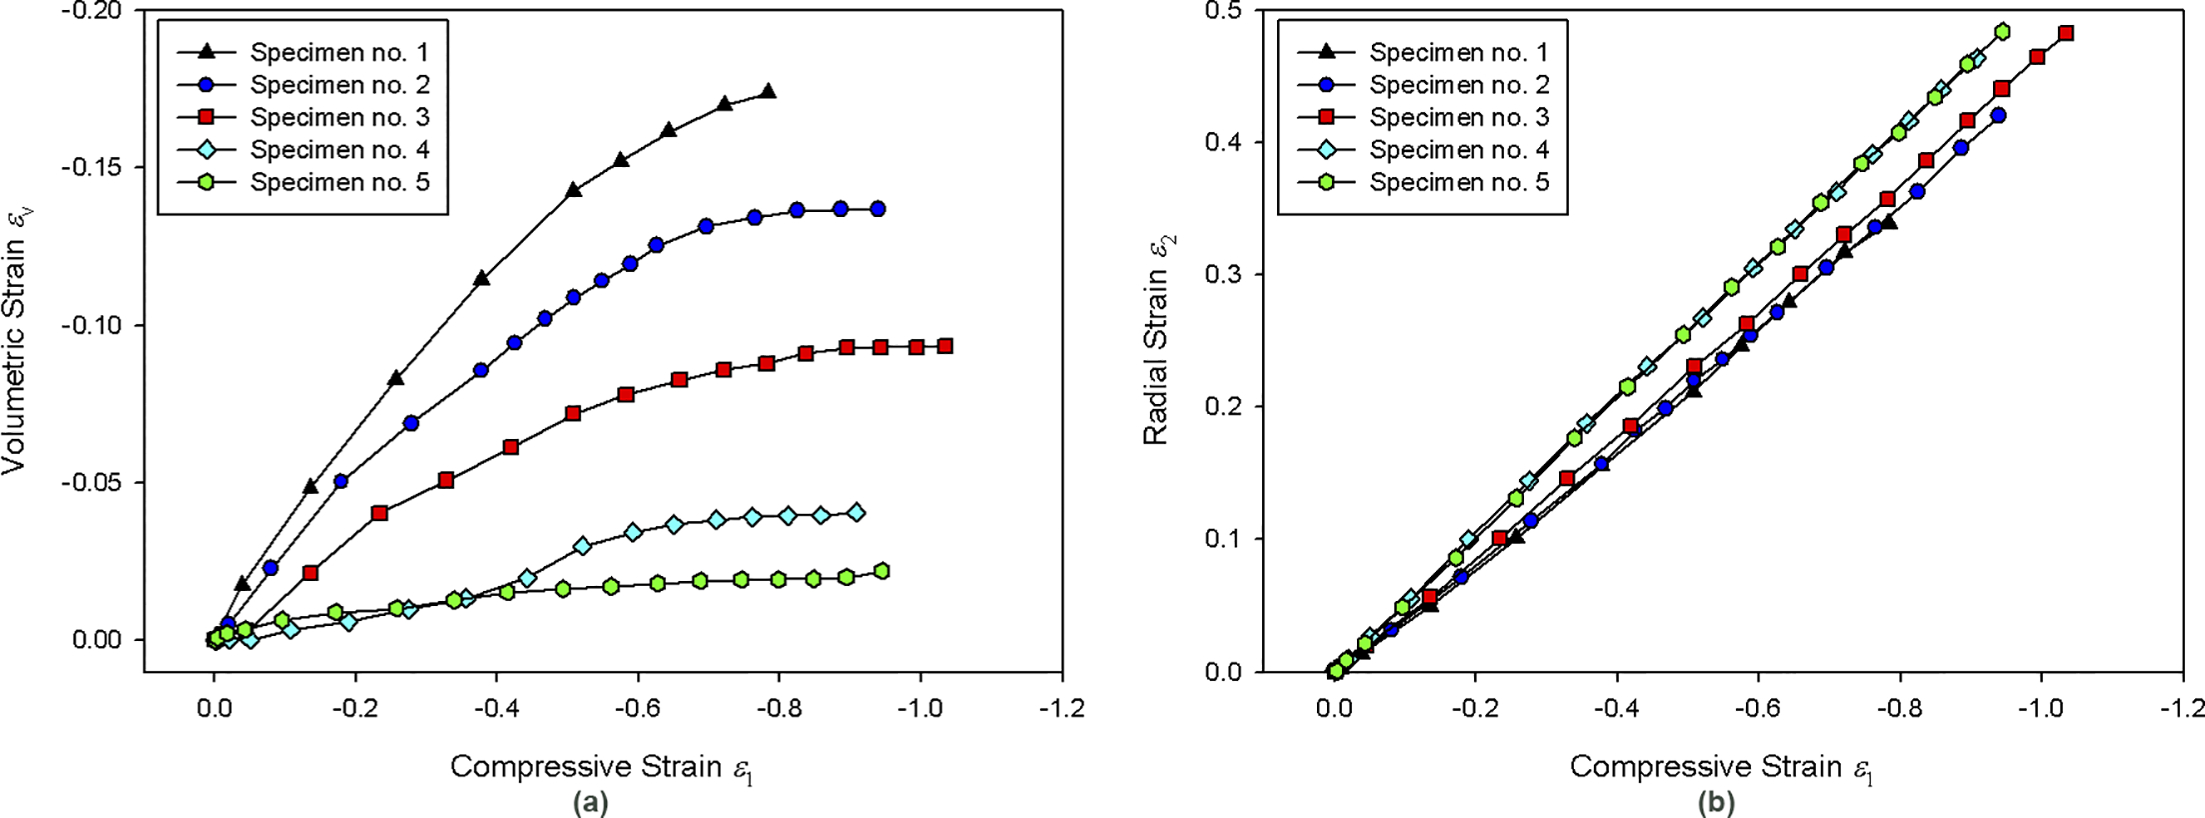
Figure 4a shows the relationship between the volumetric strain and the compressive strain, and Fig. 4b shows the relationship between the radial strain and the compressive strain for the five sintered specimens. These curves determine the values of f in equation (3). After that, we can determine the values of α and β through curve fitting using the relative densities for each compressive strain shown in Fig. 5a. Figure 5b gives the relationship between 1/f and the relative density for each specimen. The determined values for α and β are 6.55 and 0.971 respectively. Then, equation (5) is expressed as
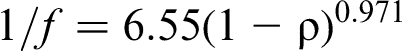
a relationship between volumetric strain and compressive strain; b relationship between radial strain and compressive strain
a relationship between relative density and compressive strain; b relationship between value of 1/f and relative density
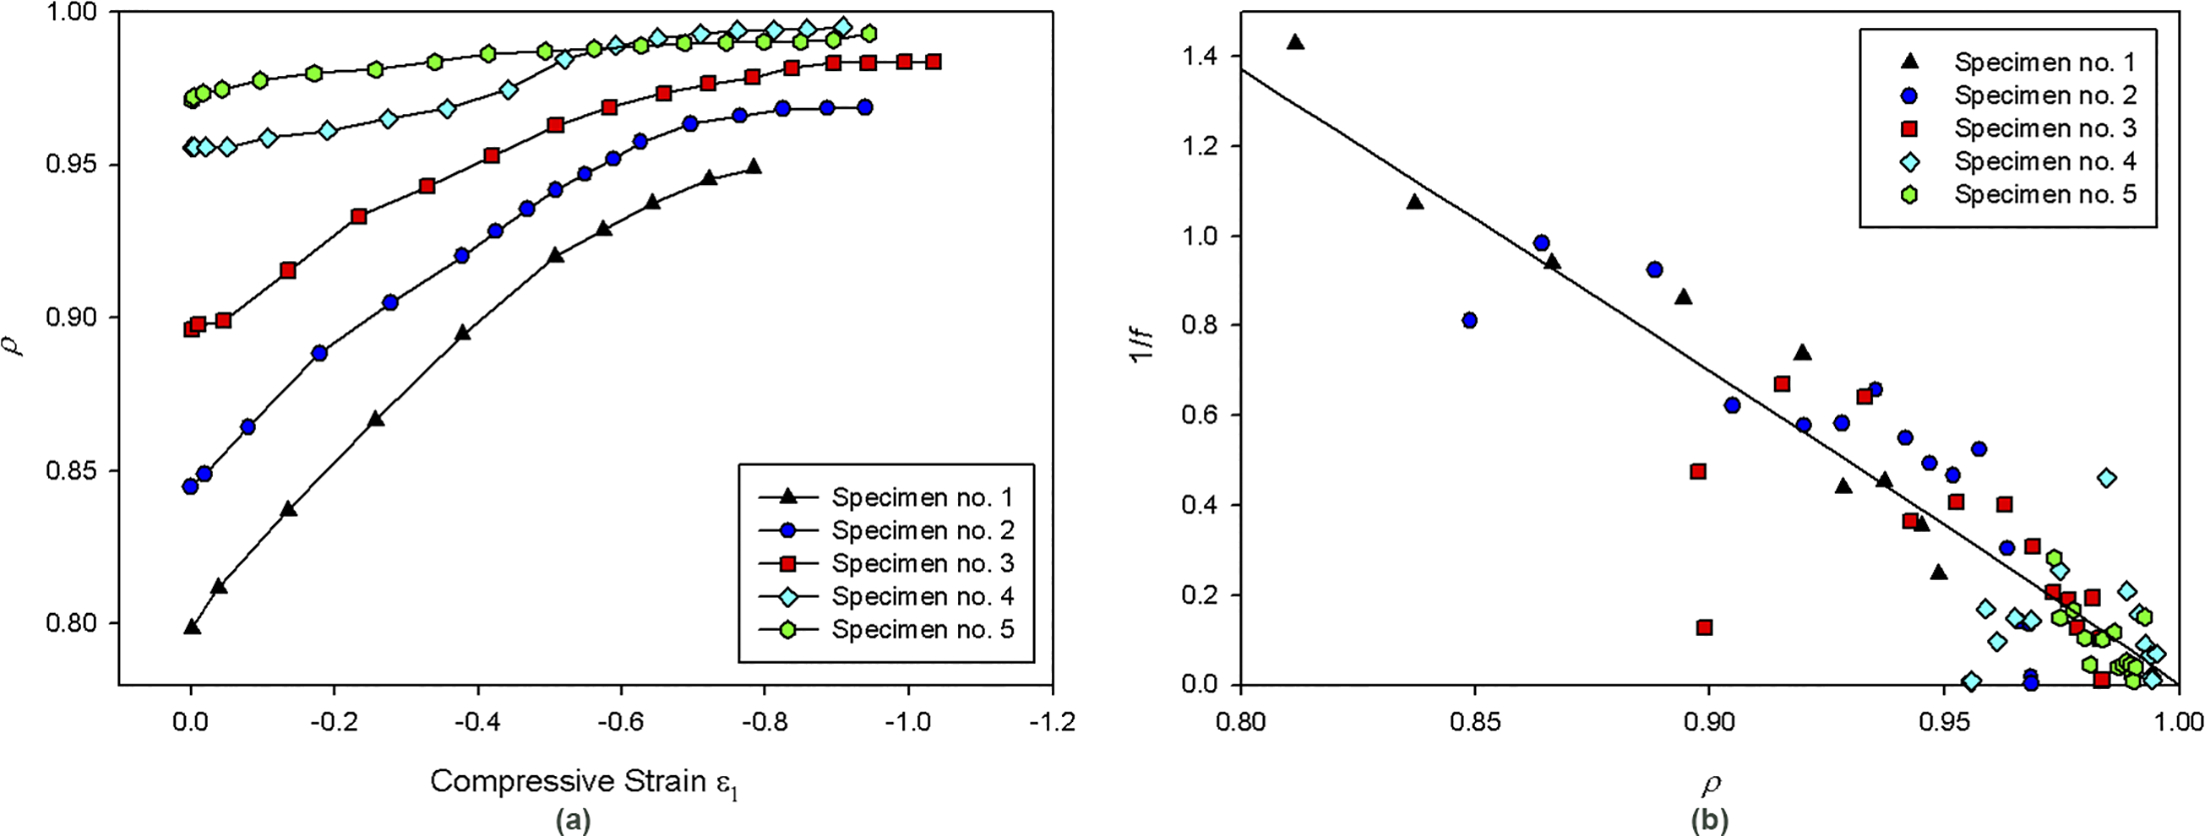
The last parameter n is determined from equation (6). Substituting equations (13) and (6) into equation (4) makes the yield stress of the HIPed specimen a function only dependent to parameter n. Figure 6 shows the relationship between the yield stress and the relative density of the HIPed specimen. As a result, n is determined as 6.50.
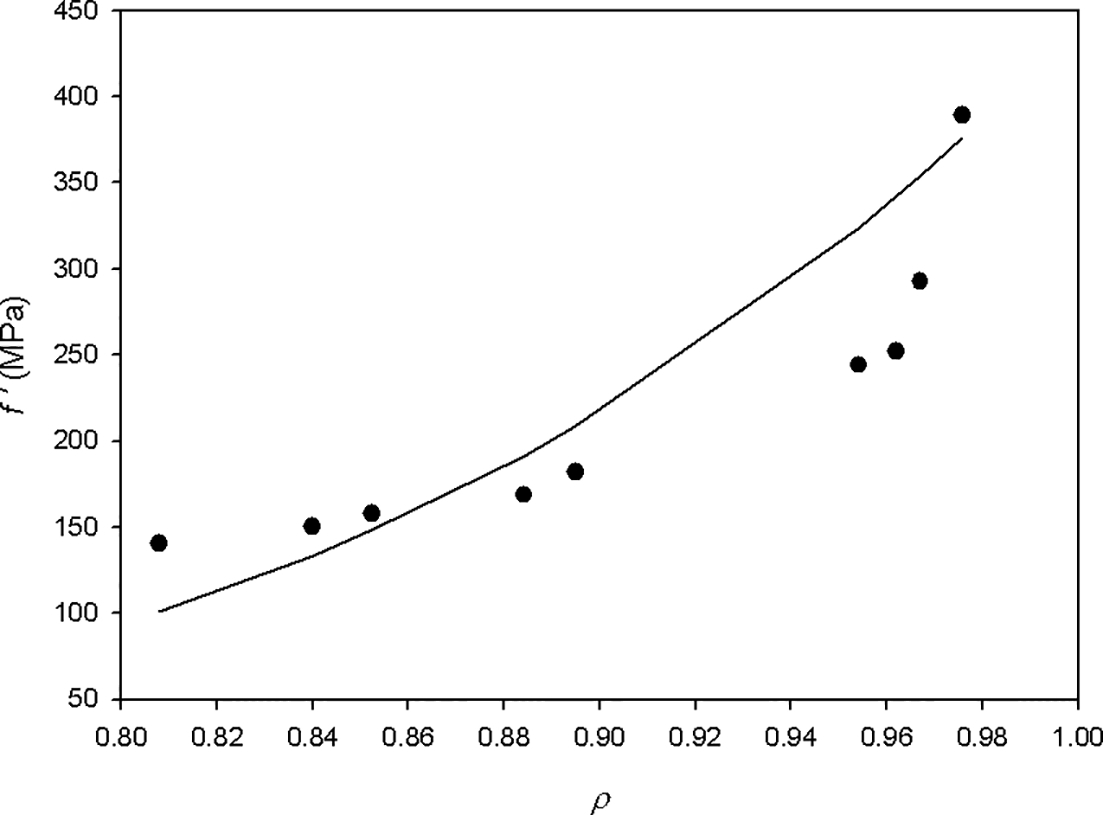
Relationship between the yield stress and the relative density of the HIPed specimen. This figure also includes the fitted curve about the relationship, and n is determined as 6.50 from the curve
Simulation
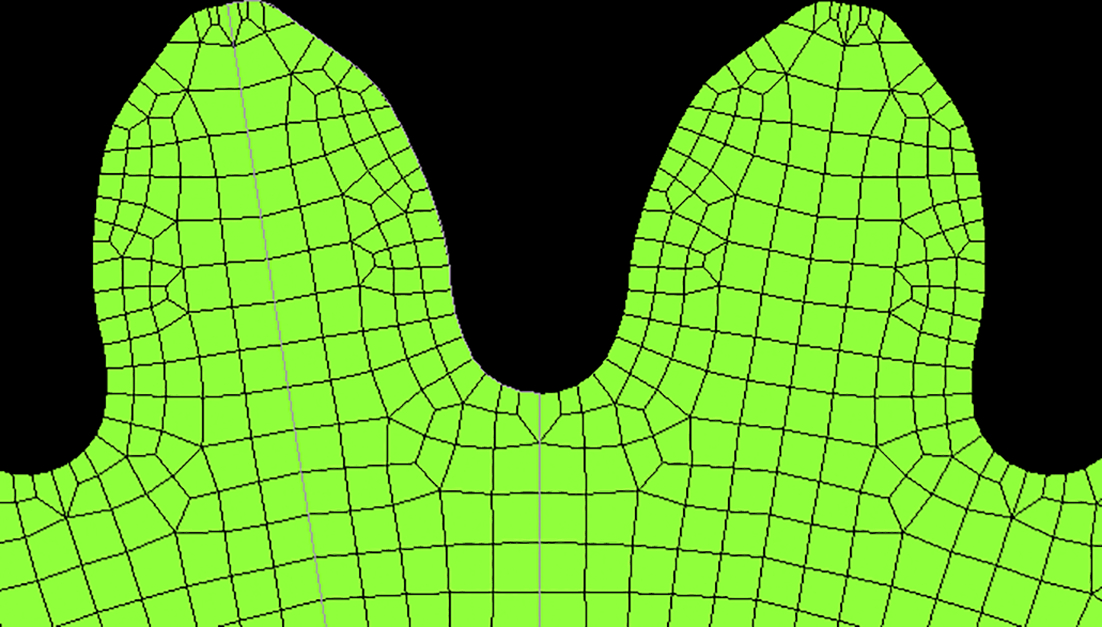
The simulation was based on the constitutive equation derived from equation (7), and performed under the assumption of plane strain. Implicit method was applied to enhance the simulation accuracy. The gear rolling process includes inserting the sintered PM gear between profile manufactured rolling gears like Fig. 7. Then, the densification of the sintered PM gear is induced by narrowing the gap between the two rolling gears. The PM gear is immobilised on a rotational centre axis and rotates when the rolling gears are rotating oppositely to each other like the real manufacturing process. Table 3 shows the specific velocity profiles of the rolling gears. The Coulomb friction model with 0.1 friction coefficient was used in order to describe the friction between the PM gear and the rolling gears. However, when the process is simulated as explained above, the tangential velocity component to the rolling gear is generated at the nodal point, which is in contact with the centre axis. When the node is moved to the surface of the rolling gear in the next step to modify the contact condition of the PM gear and the rolling gear, the volume increases as the PM gear rotates. The problem is solved with the immobilised PM gear and the rotating rolling gears along the circumferential direction of the PM gear.
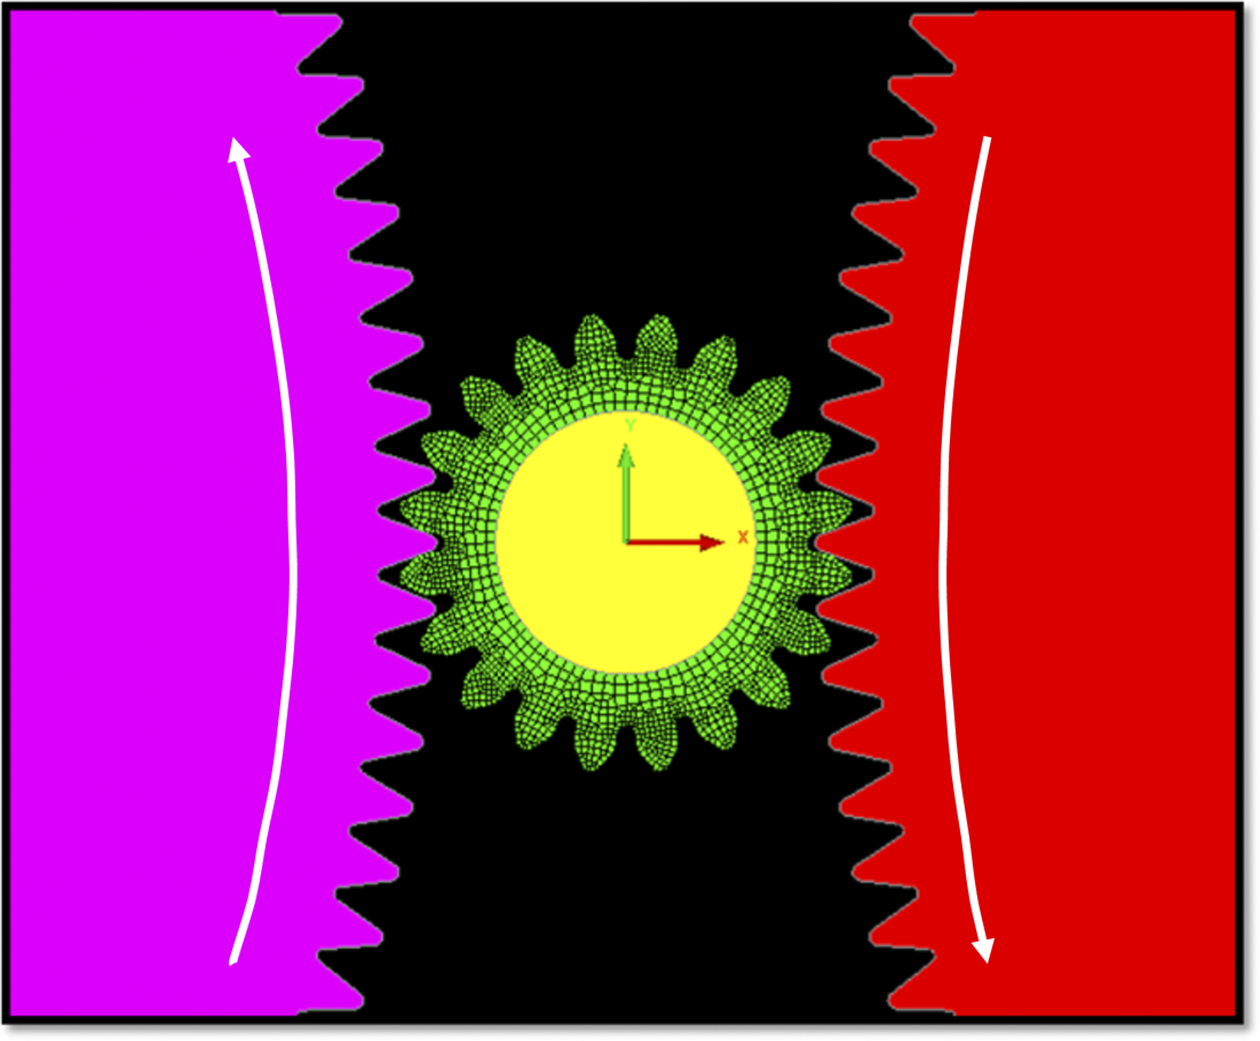
Arrangement of gears. Porous PM gear is at centre, and rigid rolling gears are located next to PM gear
Velocity profiles of right rolling gear
The table shows the velocity profiles of the right rolling gear. Negative sign of the gap narrowing velocity means the moving direction of the right gear is left. The left rolling gear has same velocity profiles except the direction of gap narrowing velocity.
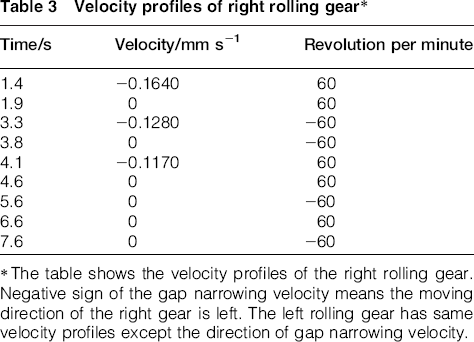
Since the compressive deformation only occurs at the contact point between the PM gear and the rolling gears, two conditions are applied to reduce the calculation time. At the first, the region within 20° from the centre of the two rolling gears is considered to be the only deformable region like Fig. 8. Moreover, when the relative density is higher than 0.9999, the non-compressive condition was applied.
Limitation of deformable region. Region within 20° from centre of two rolling gears is considered to be only deformation region
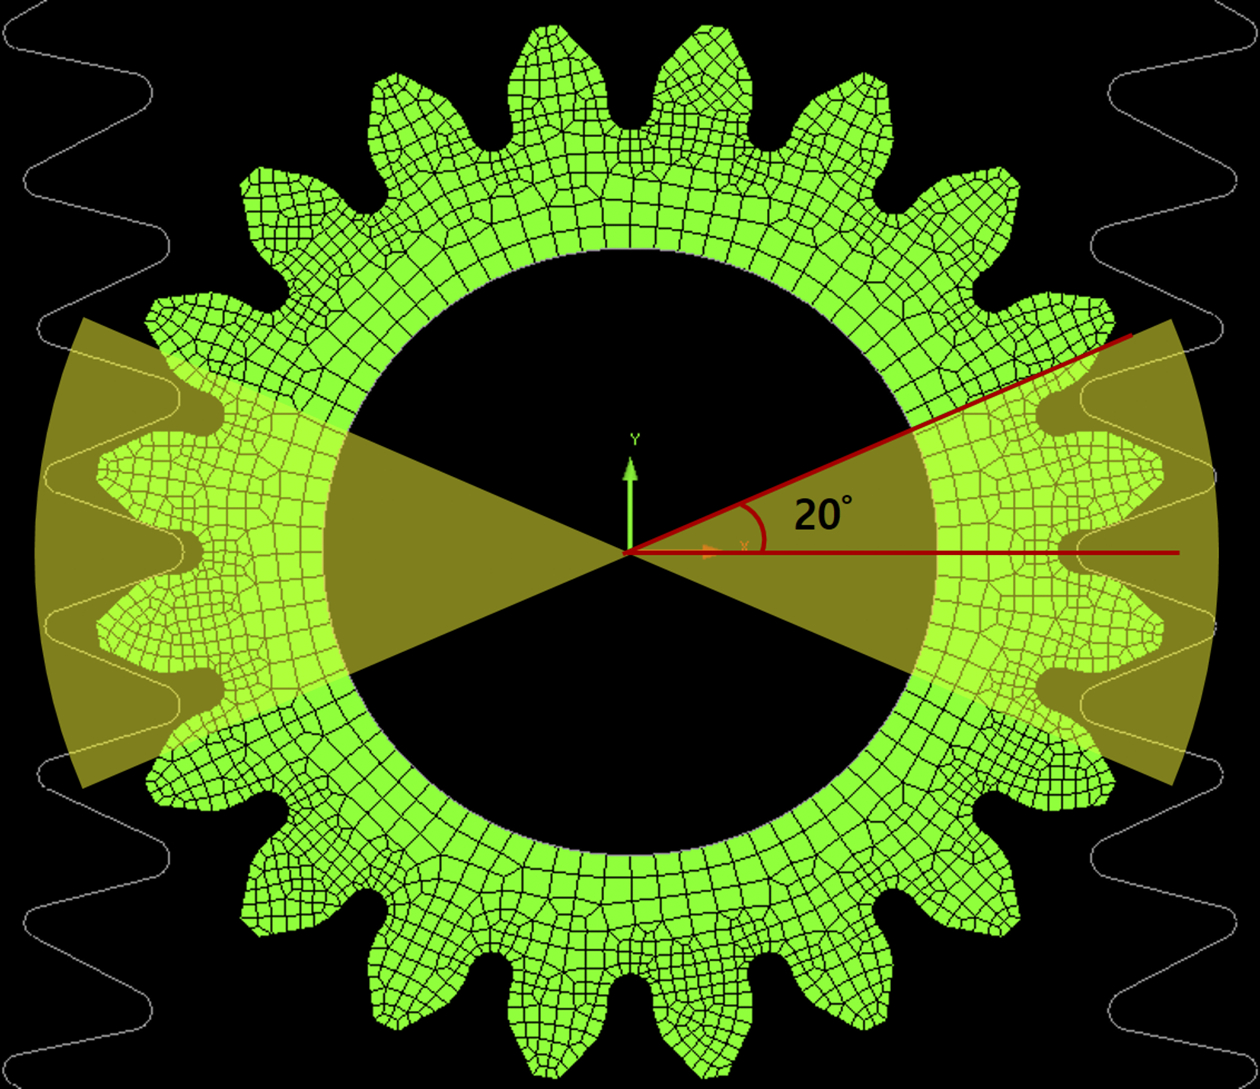
The PM gear has the 23.78 mm inner diameter and the 29.95 mm outer diameter. The number of teeth is 20, and its detailed shape with meshes is shown in Fig. 9. The relative density of the PM gear before rolling simulation was set as 0.90. The PM gear was divided into 4000 elements, and the number of total incremental steps was 40 000. The actual rolling process time is 7.6 s, and the rolling gear rotates with 60 rev min− 1. The rolling gears narrow the gap in several steps and change its direction of rotation several times during the process.
Detailed shape of gear teeth and its mesh. This figure shows some teeth of undeformed PM gear and its mesh
Figure 10 is the simulation result and shows the shape of the final product and its relative densty. The intial shape and the final shape of the PM gear are shown in Fig. 11. The PM gear produced by the actual rolling process is shown in Fig. 12. The outer area of the red line indicates the densified region for the PM gear. When Fig. 12 is compared with Fig. 13, which shows the simulated density contours, it can be clearly seen that the densified regions match well with each other. Moreover, the final shapes of the simulation and the actual rolling process are shown in Fig. 14. The difference of the two final results is measured as 0.0698 mm, which confirms the credibility of the simulation.
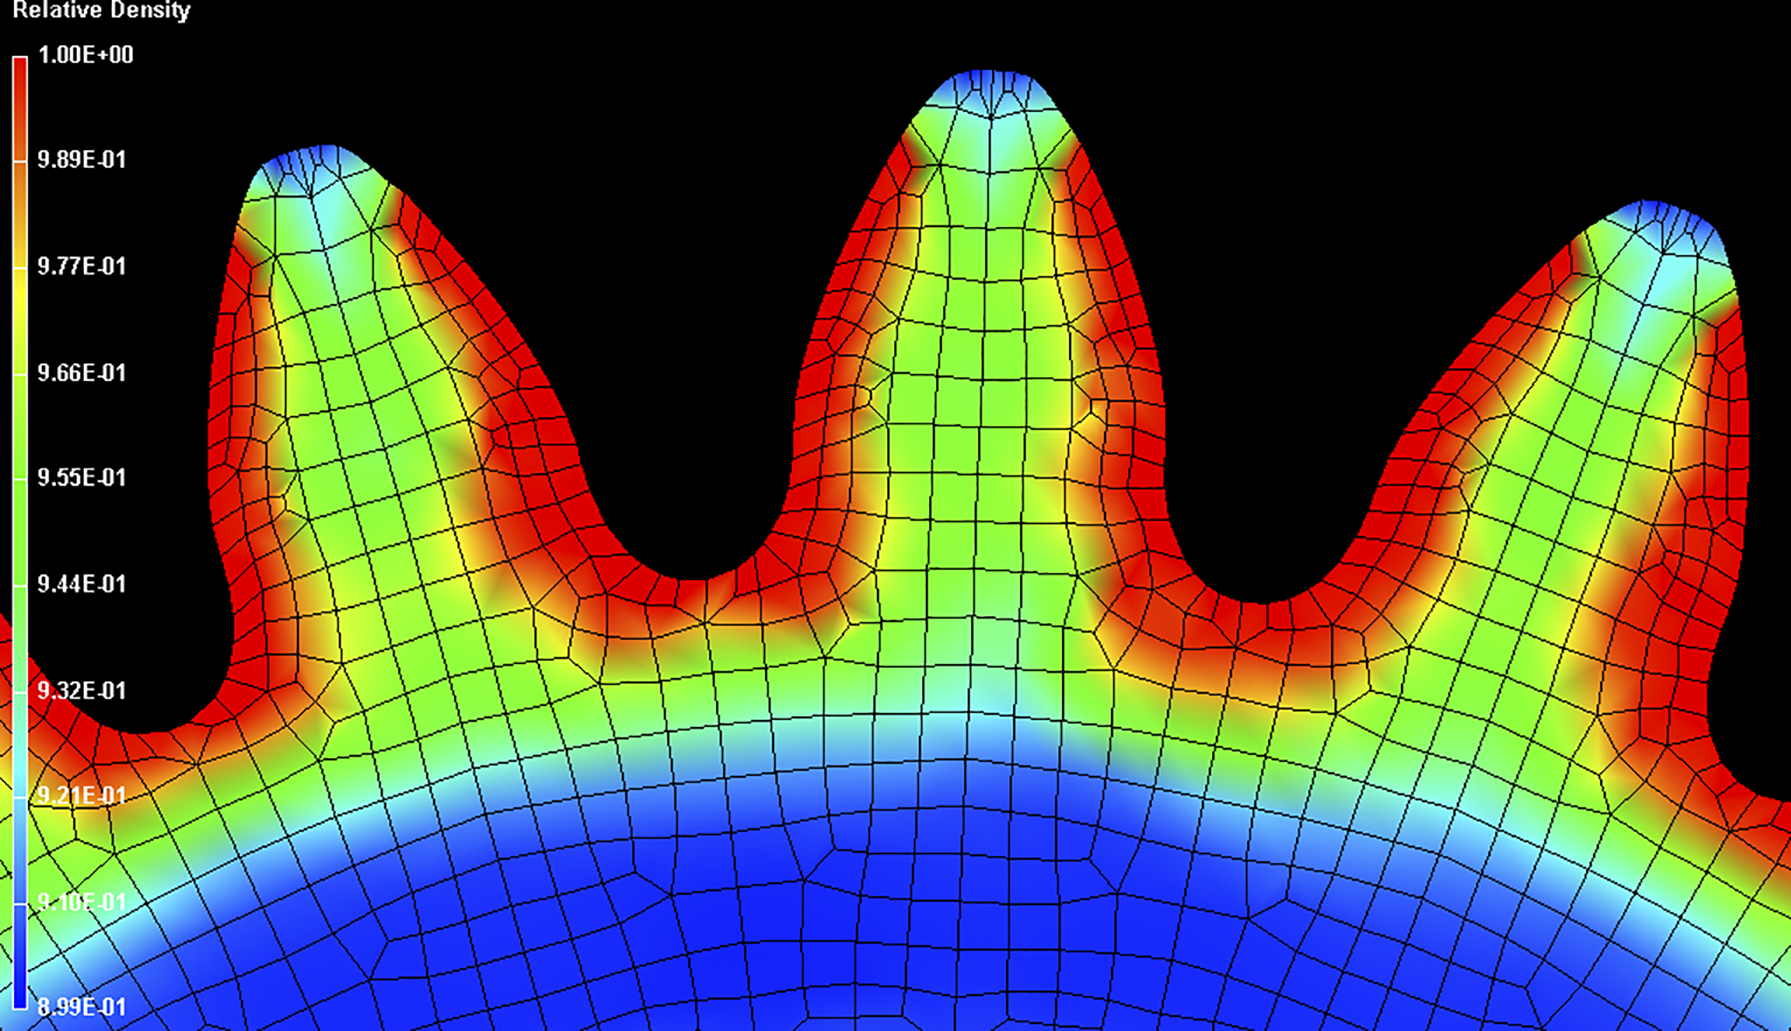
Simulation result of PM gear rolling. This figure shows result of simulation. Red region is densified fully
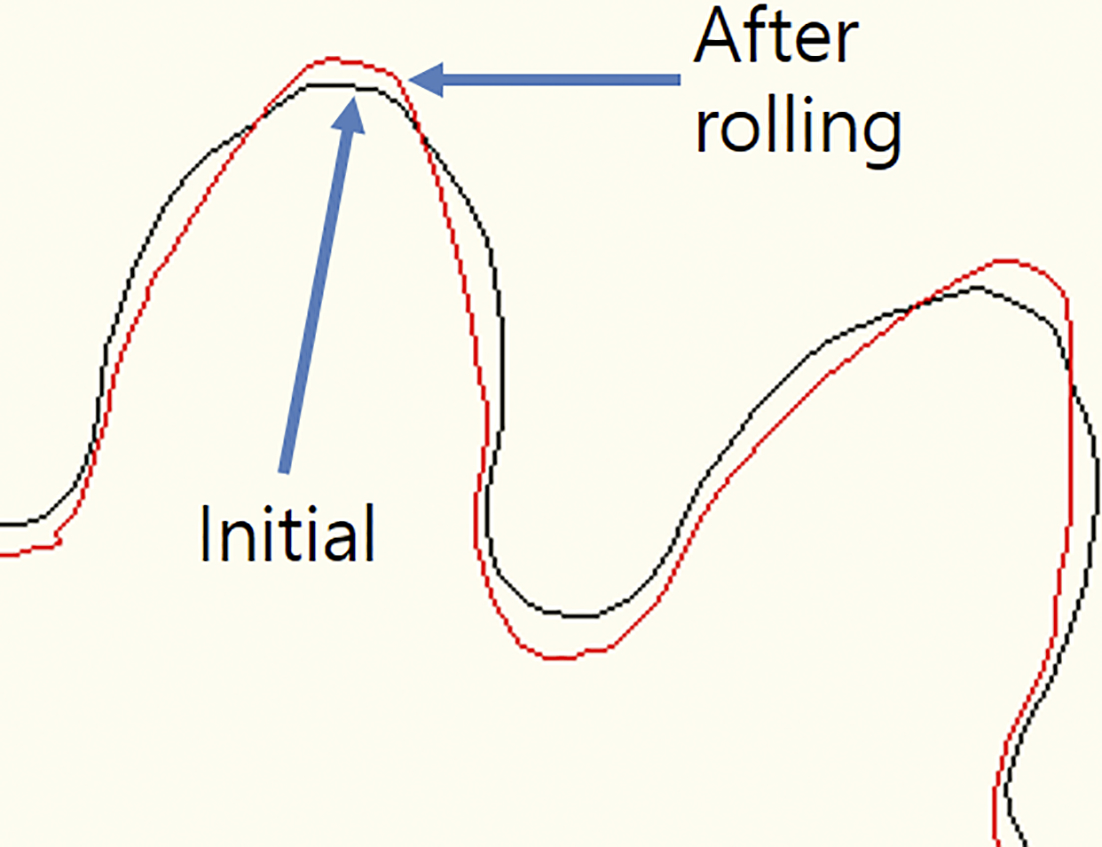
Comparison of initial and final shape of
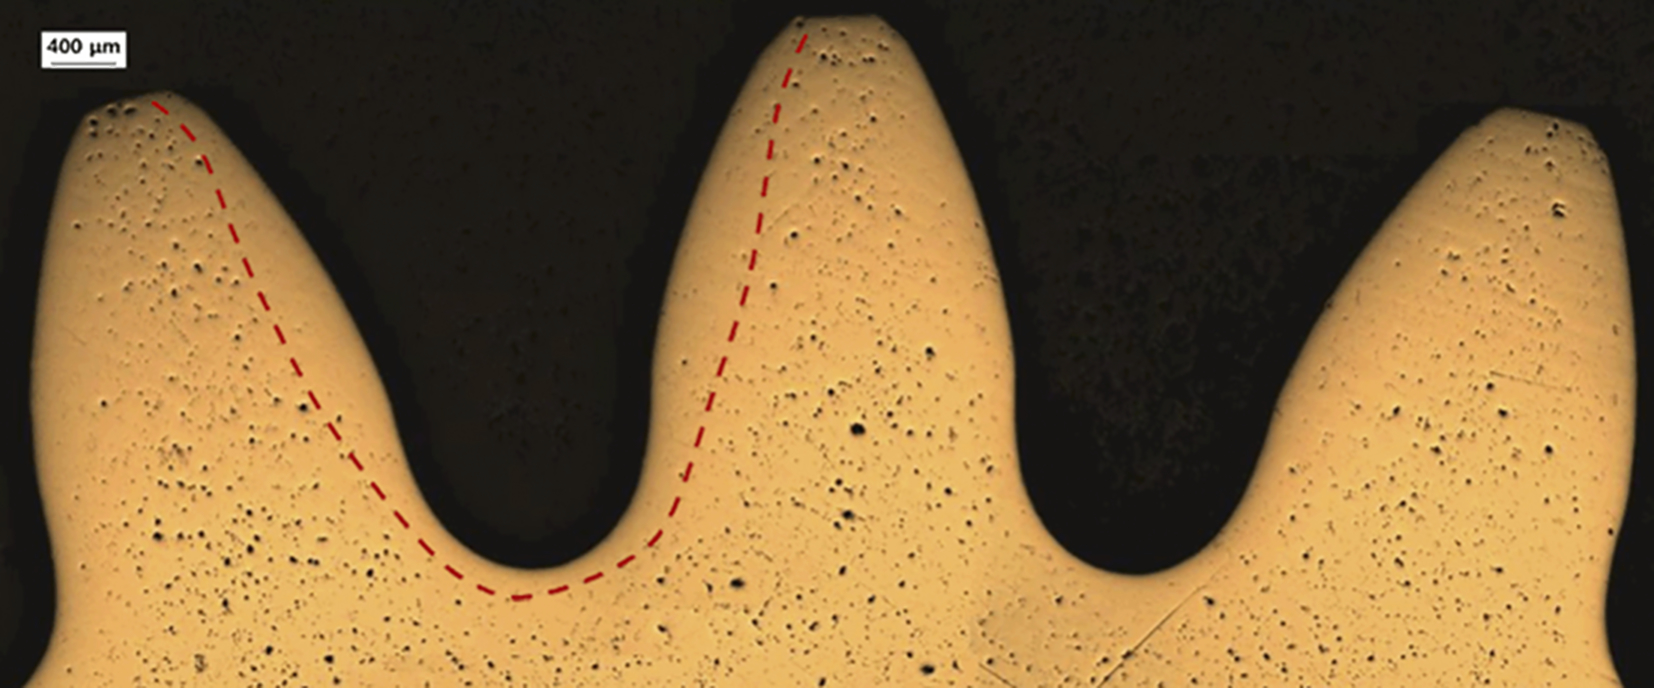
Produced gear by actual rolling process and its densified region. This figure shows actual PM gear resulting from rolling process. Red dotted line shows boundary of densified region
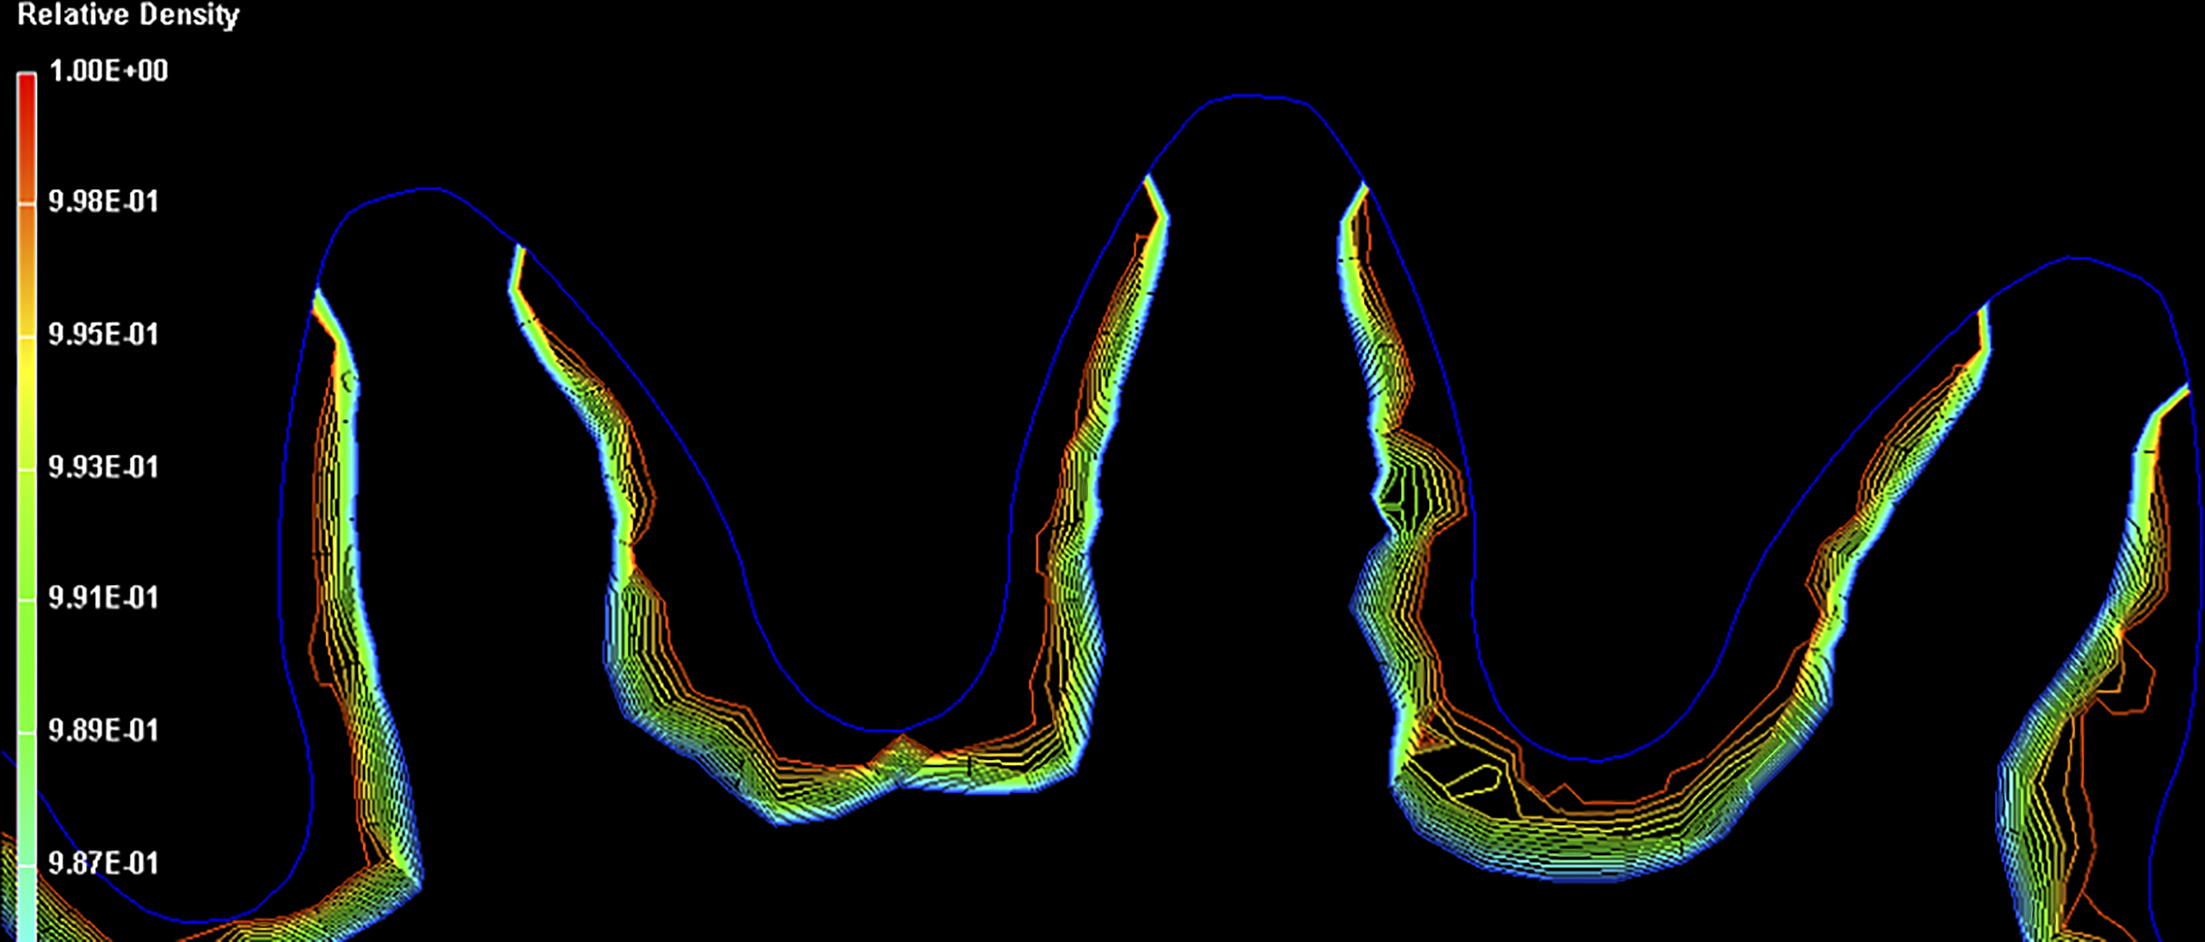
Density contours of simulation result. This figure shows density contours of simulation result. Outside region of most outer line indicates full densified area
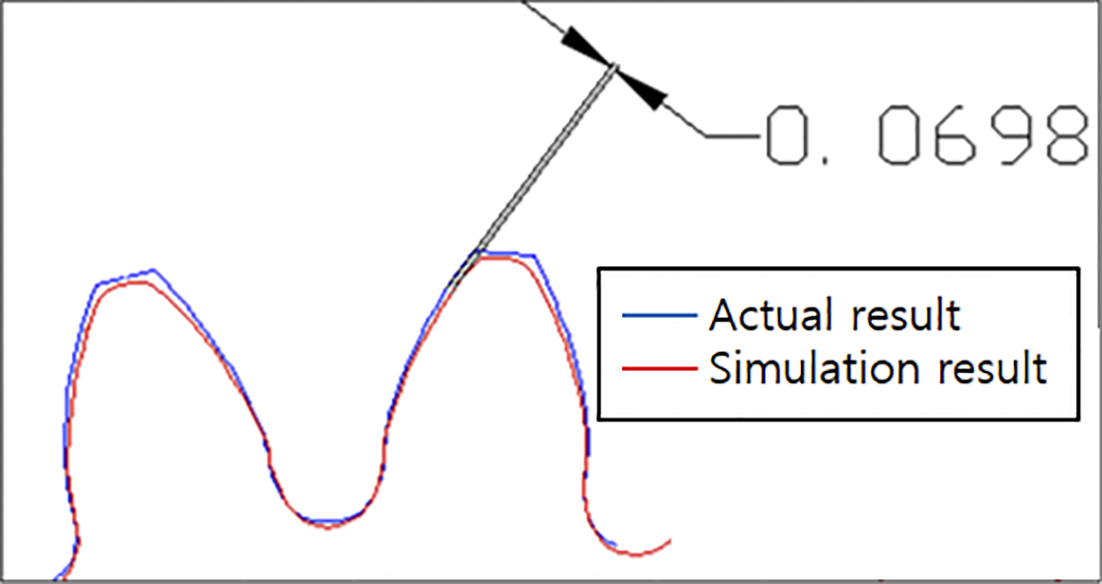
Final shapes of actual rolling process and simulation. This figure shows difference between actual result and simulation result. Difference is small enough
Conclusions
The purpose of this research is to develop a simulation programme for the gear rolling process. The gear rolling process can improve the precision and the density of the surface of the PM gears. The simulation programme that can be applied to the actual manufacturing process can reduce the required time and cost, since the gears are produced in the real industry based on the result from experiments with trial and error.
The models to describe the powder behaviours under compressive and tensile load were used previously, such as the Cam–Clay and Drucker–Prager models. However, such models have a disadvantage to predict the crack possibility and affect the convergence of numerical analysis because of the discontinuity between failure line and cap surface. The Shima–Oyane model was applied in this research as a constitutive model in order to solve these issues. The required material parameters for the simulation are obtained by the compression tests of sintered or HIPed specimens. The results with respect to the densification behaviour and de deformation of the gears are very similar between the simulation and the experiment. It confirms the credibility of the simulation.
It is expected that this research will make a contribution to develop better simulation based on plastic behaviour model of sintered powder compact and reduce time and cost required in designing the present rolling process.
Acknowledgements
This work was supported by the National Research Foundation of Korea grant funded by the Korea government (MSIP) (no. 2011-0030075).