
Abstract
Hot dip galvanised steels with thermal treatment or galvannealed steels are used in automotive industries because of their properties of weldability, workability and corrosion resistance. The galvannealed steels show three iron–zinc phases: zeta, delta and gamma. The distribution and concentration of iron–zinc phases affect the quality of the zinc layer and can produce stamping and welding problems. In the present work, the optimisation study of the electrochemical stripping process of industrial galvannealed steel was performed. The effect of electrolyte, pH, current density and scan rate was evaluated. The best resolution of the potential levels in the electrochemical dissolution curves was obtained for the zinc sulphate heptahydrate and sodium chloride aqueous solution, with a current density of 2 mA cm−2 and pH 4·5. Each sample surface obtained by using electrochemical stripping was analysed using X-ray diffraction and scanning electron microscopy.
Introduction
Electrogalvanised and hot dip galvanised steels without thermal treatment show one phase, η (zinc), in the zinc layer, and the processes of stamping, welding and painting of these steels were developed in order to prevent operation problems.
Hot dip galvanised steels with thermal treatment, or galvannealed steels, are used in automotive industries because of their properties of weldability, workability and corrosion resistance.1 – 3 The quality of the zin nc layer is related to the chemical composition, microstructure and surface condition of steel as well as the chemical composition, the temperature of the zinc bath and the operational conditions, such as immersion time and thermal treatment of the galvanised steel.
The galvannealed steels show three iron–zinc phases: ζ (5–6 wt-%Fe), δ (10–13 wt-%Fe) and Γ (20–22 wt-%Fe).4 The presence of these phases can produce stamping problems (such as powdering and flaking) and welding problems.5 The powdering and the flaking are phenomena related to the loss of adherence of the coating. When the steel strip is submitted to compression strength, fracture of Γ phase occurs, producing powdering. The thickness of Γ phase is decisive in the occurrence of powdering. In the case of flaking, a layer of ζ phase is gripped in the stamping matrix during the pressing process. Spalling occurs when the friction forces overcome the adhesion forces on the material surface and produce flaking.
The characterisation of the zinc–iron layer is important to optimise the industrial process in order to control the formation and growth of the Fe–Zn phases.
Techniques such as electron probe microanalyser,6 X-ray diffraction (XRD), transmission electron microscopy, secondary ion mass spectrometry and inductively coupled plasma optical emission spectrometry (ICP-OES) have been used in order to evaluate the iron content and thickness of the galvanneal coating.7
Electrochemical stripping has been used to obtain each intermetallic iron–zinc phase from the galvanised steels.4,5 The basic principle of this technique is that the different phases have different potentials. At a specific current density, each phase dissolves at one potential. In the literature, different researchers8,9 used different electrolytes to perform the electrochemical stripping of the galvanneal coating. In the present work, the optimisation study of the electrochemical stripping process of industrial galvannealed steel was realised by using three solutions reported in the literature,4,8,9 i.e. varying the pH, current density and scan rate. Cyclic voltammetry was used as an auxiliary technique to obtain the optimal conditions of the electrochemical stripping. The electrochemical stripping provides an indirect compositional profile of the galvanneal coating. The results obtained by using electrochemical stripping are similar to the results using the glow discharge optical emission spectroscopy and Auger electron spectroscopy. Each plateau of the electrochemical stripping curve corresponds to a compositional range and to one predominant Fe–Zn phase. Each metallic surface obtained after the electrochemical stripping stage was analysed by using XRD and scanning electron microscopy (SEM).
Experimental
Materials
The steels were obtained from industrial reels, degreased in the laboratory and submitted to the electrochemical stripping.
The chemical composition of the steels was determined. The carbon and sulphur contents of the steel were analysed by using combustion with detection by infrared, with a LECO 444 LS equipment (Leco Corporation). The aluminium concentration was evaluated by using ICP-OES (Spectroflame Modula; Spectro GmbH). Manganese, silicon, phosphorus, niobium, titanium and nitrogen were analysed by using the SRS 3000 Sequential X-Ray Spectrometer (Siemens).
The mass, chemical composition, phases and morphology of the zinc–iron layer were evaluated.
The mass and the chemical composition of the galvanised steels were evaluated in five samples (40×80 mm in dimension). The samples were degreased, cleaned, weighed and immersed in a solution for the removal of the zinc layer. The removal solution used was aqueous solution water: hydrochloric acid (1∶1, v/v) with the addition of hexamethylenetetramine (3·5 g L−1) as a corrosion inhibitor. The immersion time was considered until the end of the hydrogen evolution. Samples without the zinc layer were cleaned with distilled water, dried with nitrogen and weighed. The mass of the galvanised layer was determined by calculating the mass difference between the galvanised sample and the same sample after the removal of the layer.
The chemical composition of the zinc–iron layer was evaluated by using ICP-OES (Spectroflame Modula; Spectro GmbH). The contents of zinc, iron, aluminium and silicon were determined by analysing the removal solution.
The morphology of the zinc–iron layer was determined before and after each stage of electrochemical stripping by using SEM (EVO 50, Zeiss equipment), 20 kV of acceleration tension, coupled with the energy dispersive spectrometer (INCA 350 model) and the wave dispersion spectrometre (model INCA 500i; Oxford Instruments).
The zinc–iron phases were analysed before and after each stage of electrochemical stripping by using XRD. The equipment used in the XRD technique was a Rigaku, Geigerflex series, copper radiation with a step time of one second and a step size of 0·02°.
The transversal sections of the galvannealed steels were obtained after ionic polishing or acid attack. The ionic polishing is an alternative technique to polishing by using abrasion, which is performed by using an argon ions smasher Jeol SM-09010. The steel samples were cut into 9×11 mm in dimension. The ionic polishing was performed for 120 min with a tension of 5 kV and a current of 100 μA.
Electrochemical stripping
The 100×75 mm samples were degreased using an aqueous solution of 20 g L−1 of a commercial alkaline degreasing at 60°C, cleaned in distilled water and dried with nitrogen.
The electrochemical cell has a capacity of 300 mL, and the sample has an exposed area to the electrolyte of 19·63 cm2.
The galvanostatic measurement of the electrochemical potential of each phase was carried out by using three solutions reported in the literature: 4 8 4,8,9 solution 1, an aqueous solution of 2·73M sodium chloride+0·27M zinc chloride, pH = 5·0±0·10;8 solution 2, an aqueous solution of 1M sodium sulphate+0·35M zinc sulphate heptahydrate, pH = 5·5±0·1;9 and solution 3, an aqueous solution of 3·42M sodium chloride+0·35M zinc sulphate heptahydrate, pH = 4·5±0·1.4 The current density values of 1, 2, 4 and 7·5 mA cm−2 were studied using the three solutions. 8 8,9
The equipment used was an EG&Princeton Applied Research potentiostat/galvanostat (model 273).
Cyclic voltammetry
The curves of anodic voltammetry were obtained by using an aqueous solution of 3·42M sodium chloride and 0·35M zinc sulphate heptahydrate (solution 3),4 pH = 4·5±0·1, in a potential range from −1·0 to −0·5 V(CSE). Scan rates of 0·1, 0·02 and 0·01 mV s−1 were studied.
Solution 3 was chosen because the best resolution of the potential levels was obtained for this solution by using electrochemical stripping.
Results and discussion
Characterisation of materials
The steel used was an ultralow carbon steel interstitial free stabilised with titanium and niobium (with a chemical composition of 0·0019C–0·12Mn–0·01Si–0·013P–0·009S–0·034Alsol–0·019Nb–0·022Ti, wt-%).
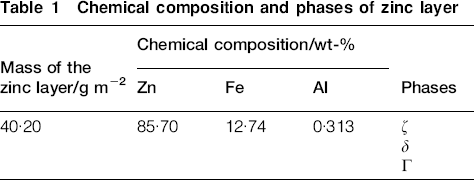
Table 1 shows the chemical composition of the zinc–iron layer and the phases identified by using XRD. The zinc layer of the galvannealed steel showed the presence of aluminium, zinc and iron. Aluminium is added to the zinc bath to inhibit the reactions between the zinc and the iron, and in this case, iron–aluminium and not iron–zinc intermetallic compounds are produced in equilibrium with the liquid. Aluminium additions of 0·135 wt-% at 723 K are sufficient to precipitate an iron–aluminium phase on the steel surface. In this work, the aluminium content of the zinc bath was 0·10 wt-%. The literature reports that the inhibition layer10 is constituted by one or more phases of iron–aluminium with or without zinc.
Chemical composition and phases of zinc layer
The coating thickness estimated by using SEM analysis was in the range of 9–12 μm.
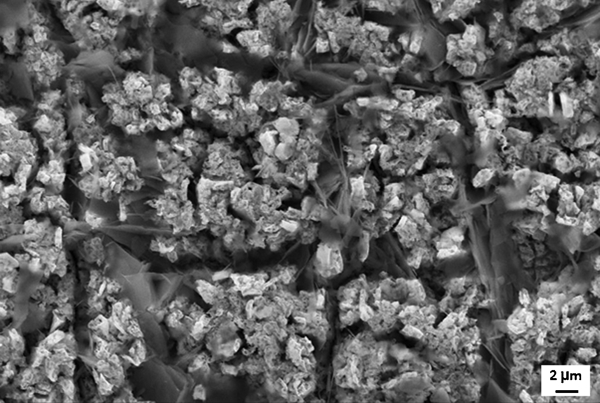
Figure 1 shows the morphology of galvannealed coating. The presence of rod-like crystals, which is characteristic of the ζ phase, and columnar crystals, which is typical of the δ phase, can be observed in Fig. 1.
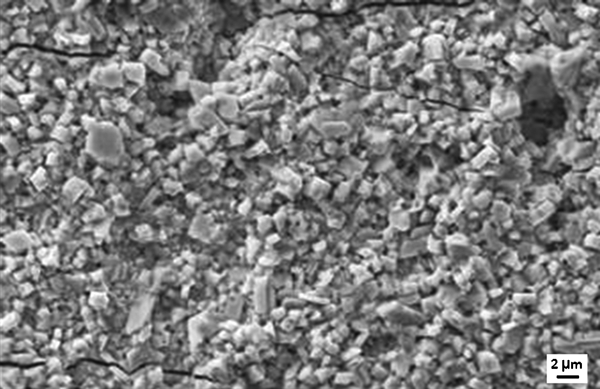
Morphology of surface of galvannealed steel (SEM image)
The main diffusion path of zinc is the grain boundary. When a sufficient zinc concentration reaches the grain boundary, the gamma phase precipitates under the inhibition layer. The volumetric expansion produces the failure of the inhibition layer. A fast atom exchange between the iron of the substrate and the liquid zinc occurs, generating outbursts and ejecting liquid zinc. The zinc concentration is limited, and the precipitation of iron–zinc intermetallic compounds occurs along the grain boundaries.11 The reaction on the surface of grains is slow. This mechanism explains the occurrence of holes and cracks on the surface of galvannealed steels, as shown in Fig. 1.
Electrochemical stripping
Curves of electrochemical stripping of hot dip galvanised steel are shown in Fig. 2 for the three solutions tested in this work and for the values of current density of 1, 2, 4 and 7·5 mA cm−2.
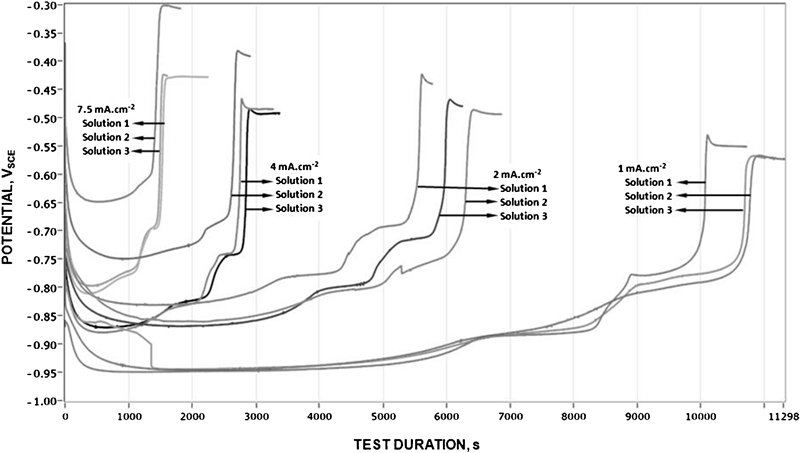
Curves of galvanostatic dissolution of galvannealed steels in three electrolytes with current densities of 1, 2, 4 and 7·5 mA cm−2
The best resolution of the potential ‘plateaus’ was obtained for the 0·35 mol L−1 zinc sulphate heptahydrate and 3·42 mol L−1 sodium chloride aqueous solution (Fig. 2).
According to Zhang and Bravo,8 the presence of chloride ions in the solution is fundamental to improve the definition of ‘plateaus’ of zinc–iron phases. The authors report that the difference of electrochemical potential of phases increased with the content of chloride ions in the electrolyte. For values of the current density of 1, 2, 4 and 7·5 mA cm−2, the curves of dissolution obtained by using the solution 2 without chloride ions did not show well defined ‘plateaus’ of potential (Fig. 2).
The selected current density was 2 mA cm−2 according to the results shown in Fig. 3. The electrolyte attacks selectively the zinc–iron phases, and the current density accelerates the dissolution. At a low current density, the dissolution time and the length of ‘plateau’ were higher. The dissolution time for the current density of 1 mA cm−2 was 11 000 s, and the testing time for the current density of 2 mA cm−2 was 6000 s. A high definition of the potential ‘plateaus’ depends on the adequate selection of the current density. Several current density ranges were proposed in the literature for the dissolution of hot dip galvanised steels. Xhoffer et al.5 optimise the current density in the range from 2 to 20 mA cm−2 for a good resolution and reduced test time, reporting the ideal value of 7·5 mA cm−2. Zhang and Bravo8 report a good definition of ‘plateaus’ in tests performed at 40°C with current densities lower than 25·4 mA cm−2. For tests realised at room temperature, values of the current density lower than 10 mA cm−2 were proposed in the literature in order to obtain a good definition of the potential ‘plateaus’. 5 5,8 In this work, a current density of 2 mA cm−2 produced a better definition of the potential ‘plateaus’ and a reduced testing time.
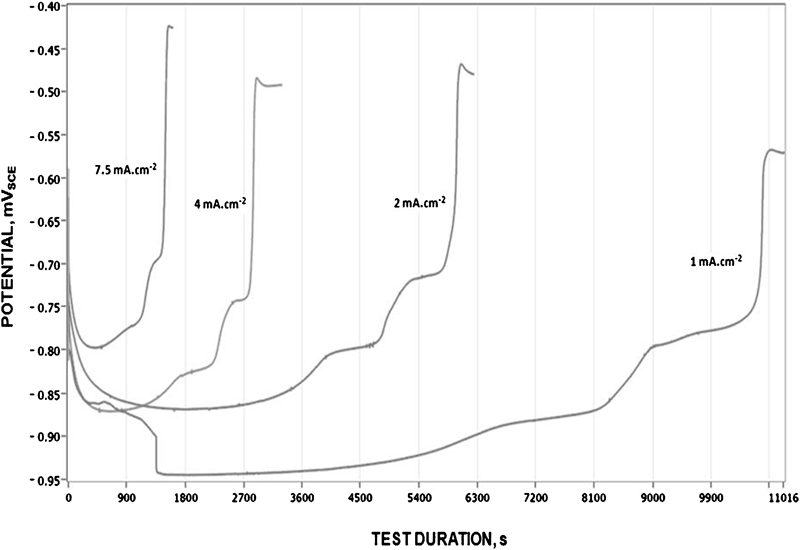
Curves of galvanostatic dissolution of galvannealed steels in electrolyte of 3·42M NaCl and 0·35M ZnSO4.7H2O, pH 4·5, at current densities of 1, 2, 4 and 7·5 mA cm−2
The lowest time for dissolution was obtained for pH 4·5 (Fig. 4). At a lower pH, the dissolution of zinc is inhibited due to the high hydrogen overpotential of zinc. The adsorption of hydrogen atoms on the zinc surface inhibits zinc dissolution.
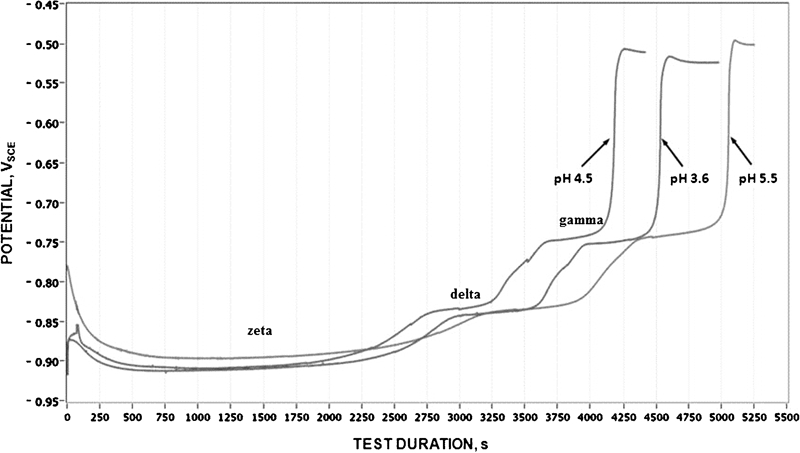
Curves of galvanostatic dissolution of galvannealed steel, with pH values of 3·6, 4·5 and 5·5, at current density of 2 mA cm−2 and electrolyte of 3·42M NaCl and 0·35M ZnSO4.7H2O
At a higher pH, the acidity is not sufficient to promote zinc dissolution. According to the Pourbaix diagram for the zinc–water system at 25°C,12 the equilibrium line between the corrosion region and the passivation region is near pH 6 for a content of 0·35M zinc cations. As the pH value was increased to 5·5, the dissolution time increased (Fig. 4).
Anodic voltammetry
Scan rates of 0·1, 0·02 and 0·01 mV s−1 were studied. The dissolution at a potential scanning rate of 0·1 mV s−1 displaced the current density–potential curves towards a higher value of potential, and some peaks, related to the zinc–iron phases, were hidden (Fig. 5). At high scan rates, the answer time of the system submitted to a change in potential is very short, and the current density did not stabilise. At high scan rates, high values of the current density of potential peaks were obtained. Nogueira et al.13 report that the scan rate of the anodic potential must be sufficiently low in order to conclude the dissolution of one phase before the potential of the next phase is reached.
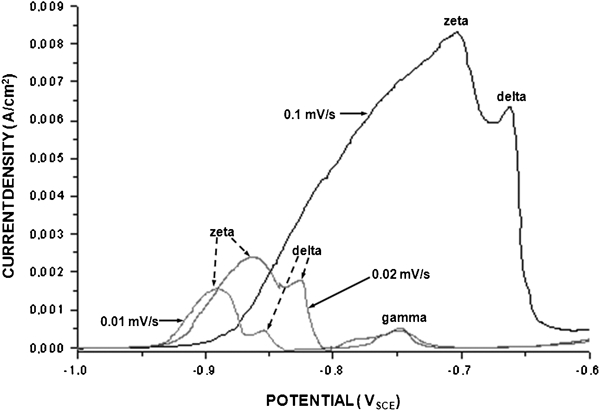
Cyclic voltammograms of hot dip galvanised steels with thermal treatment obtained in electrolyte of 3·42M NaCl and 0·35M ZnSO4.7H2O, pH 4·5, at scan rates of 0·1, 0·02 and 0·01 mV s−1
The anodic dissolution performed at a rate of 0·02 mV s−1 identified four potential peaks, and the analysis carried out at 0·01 mV s−1 identified three peaks (Fig. 6). The selected scan rate was 0·02 mV s−1.
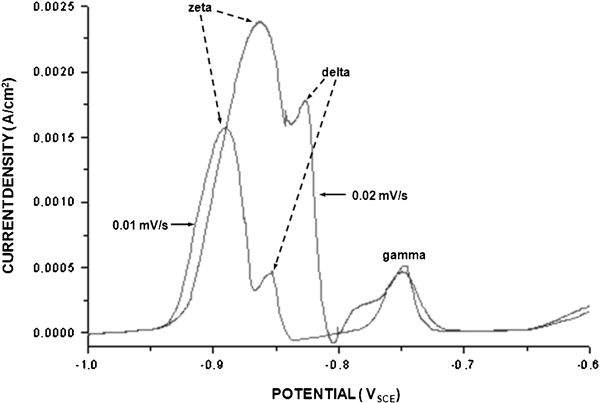
Cyclic voltammograms of hot dip galvanised steels with thermal treatment obtained in electrolyte of 3·42M NaCl and 0·35M ZnSO4.7H2O, pH 4·5, at scan rates of 0·02 and 0·01 mV s−1
Figure 7 shows the voltammetric curves obtained at pH values of 3·6 and 4·5. At a lower pH, the lower current densities were measured due to the inhibition of zinc dissolution in electrolytes with a high H+ concentration. The adsorption of hydrogen atoms on the zinc surface inhibits zinc dissolution at low values of pH.
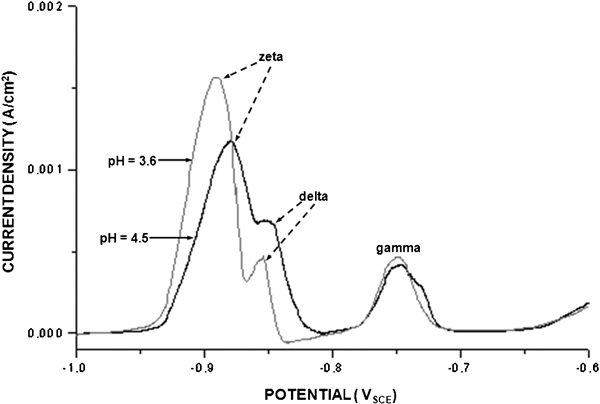
Cyclic voltammograms in electrolyte of 3·42M NaCl and 0·35M ZnSO4.7H2O at pH values of 3·6 and 4·5
Characterisation of surfaces obtained after each stage of electrochemical stripping
Each metallic surface obtained after each stage of the electrochemical stripping technique was characterised by using SEM, EDS and XRD analyses.
The diffractogram shows the presence of zeta, delta and gamma phases in the galvanneal coating. The delta phase is predominant, followed by the gamma and zeta phases. Mössbauer spectroscopy14 also showed that the metallic coating of the galvannealed steels is made up predominantly by the δ phase (FeZn7). Mössbauer spectra were obtained at room temperature with source of iron 57 isotopes immersed in cobalt matrix. The measurements were performed in back scattering configuration by using the conversion electron Mössbauer spectroscopy.14
The results shown in Table 2 indicate that when galvanostatic dissolution occurs, there is a removal of the three phases of the coating. It is not possible to dissolve one phase at each time, as there is an interpenetration of iron–zinc phases in each surface layer. The semiquantification by using XRD analysis of each phase present on the surface obtained after each potential plateau of the electrochemical curve is shown in Table 2 and is not found in the literature. The predominant phase in the galvanneal coating was the delta phase. When the stripping started, the zeta and delta phases dissolved, the delta phase was dissolved preferentially, and the fraction of gamma phase increased. After the second stage of electrochemical stripping, more delta phase was dissolved, and the fraction of gamma phase increased. After the third stage of electrochemical stripping, only the gamma phase was identified.
Results of counts per second obtained by using XRD analysis
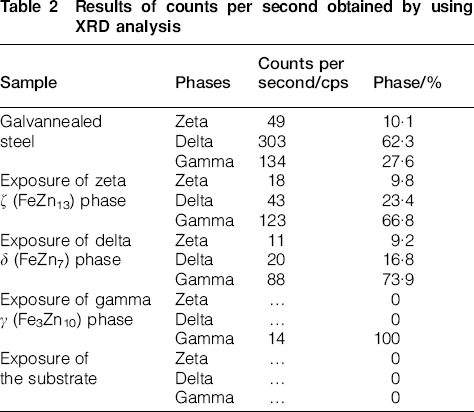
Figures 8 and 9 show transversal sections of the galvannealed steels after ionic polishing. Figure 8 shows the outer phase eta and the inner phase gamma near the steel substrate. The delta phase is predominant according to the XRD results. The zeta and delta phases interpenetrate each other, and regular horizontal layers do not form.
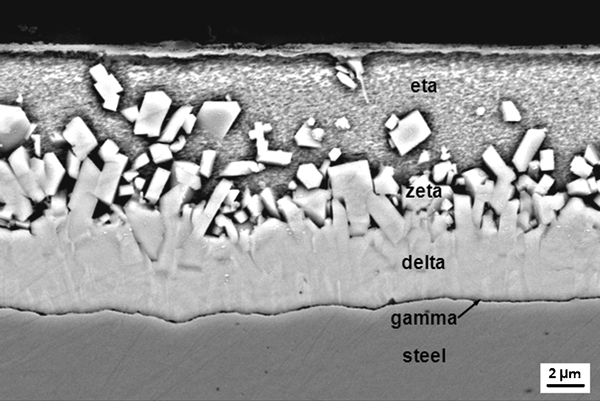
Transversal section of galvannealed steel analysed by using SEM technique: preparation of sample by using ionic polishing
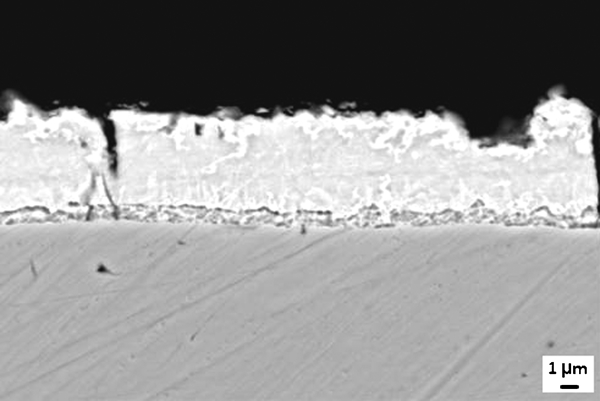
Transversal section of galvannealed steel analysed by using SEM technique: preparation of sample by using acid attack
Figure 9 shows the occurrence of outbursts within a galvanised layer. Interstitial free steel sheets were galvanised in a bath containing aluminium additions. An iron–aluminium layer10 is formed on the substrate steel sheet, which leads to desirable transient inhibition of iron–zinc reactions. Thus, the more protective (eta) phase rich in zinc is favoured. However, an appreciable intergranular diffusion and a gradual formation of internal and surface oxide particles influence the growth and stability of the inhibition layer.15 The location of some oxide particles on the iron–aluminium phase surface or inside this inhibition layer led to the conclusion that the oxide particles cause the growth of the iron–zinc outburst. The reason is that zinc diffuses along the oxide particle/iron–aluminium interface. Moreover, the mechanism of oxide formation causes a local depletion of the atom concentration in the zinc bath in the vicinity of the formed oxide. This, in turn, diminishes the probability of the formation of the iron–aluminium layer. The mechanism provides a fast diffusion of zinc, which reacts with iron atoms, forming iron–zinc phases.10
Each phase revealed by using electrochemical dissolution was analysed by using XRD (Table 2) and SEM. The surface of the galvannealed steel showed several morphologies of crystals: columnar crystals, which is characteristic of the delta phase, and rod-like crystals, which is characteristic of the zeta phase4 (Fig. 1). According to XRD results, the crystals of the zeta, delta and gamma phase were present in this surface. The delta and gamma phases were predominant.
Figure 10 shows the zeta phase obtained after dissolution. Columnar, hexagonal, rod-like and platelet crystals were identified. According to XRD analysis, the surface of the zeta phase showed a higher content of gamma, followed by the delta and zeta phases (Table 2).
Morphology of zeta phase of coating of galvannealed steel obtained after electrochemical dissolution
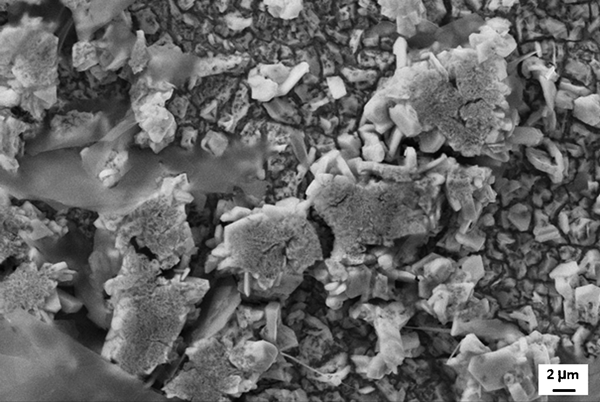
Some columnar crystals were identified on the surface of the delta phase (Fig. 11). X-ray diffraction results showed that the delta phase is formed by the association of the delta and gamma phases.
Morphology of delta phase of coating of galvannealed steel obtained after electrochemical dissolution
On the surface of the gamma phase, no well defined crystals were identified, and the surface seems melted.
Conclusions
The best result of the electrochemical dissolution of galvannealed steel was obtained for the 0·35 mol L−1 zinc sulphate heptahydrate and 3·42 mol L−1 sodium chloride aqueous solution. In this work, a current density of 2 mA cm−2 at pH 4·5 produced a better definition of the potential levels and a reduced testing time.
The galvannealed layer before the electrochemical dissolution showed the presence of stick crystals, which is a characteristic of the ζ phase, and columnar crystals, which is typical of the δ phase. According to XRD results, the delta phase is predominant, followed by the gamma and zeta phases.
Columnar, hexagonal, stick and platelet crystals were identified on the surface of the zeta phase obtained by using the electrochemical dissolution technique. According to XRD analysis, the surface of the zeta phase showed a higher content of gamma, followed by the delta and zeta phases.
Some columnar crystals were identified on the surface of the delta phase. X-ray diffraction results showed that the delta phase is formed by the association of the delta and gamma phases.
On the surface of the gamma phase, no well defined crystals were identified, and the surface seems melted.
The quantification by using XRD analysis of each phase present on the surface obtained after each potential plateau of the electrochemical curve is carried out and is not found in the literature.
When galvanostatic dissolution occurs, there is a removal of the three phases of the coating. It is not possible to dissolve one phase at each time.
Footnotes
Acknowledgements
The authors of this work would like to thank the National Council of Scientific and Technological Development (CNPq), the Coordination of Improvement of Superior Level Staff (CAPES) and the Foundation of Research Support of the State of Minas Gerais (FAPEMIG), as well as USIMINAS, an Industrial Group, for supporting this research.