
Abstract
Fluorine doped tin oxide films were deposited using a simplified spray technique. The concentration of the host precursor (SnCl2.2H2O) in the starting solution is varied between 0·2 and 1·0M. The critical doping level of fluorine for which the sheet resistance Rsh acquires a minimum value is observed for each host precursor concentration (HPC). It is found that for a 0·2M solution, Rsh is minimum (42·59 Ω sq−1) when the fluorine doping level is 40 at-%, and the critical doping level gradually increases as the HPC increases. This variation in the critical doping level is correlated with the increase in the number of oxygen sites in the SnO2 lattice caused by the increase in the HPC. The transmittance in the visible range is 80% when the HPC is 0·2M, and the transmittance decreases as the HPC increases.
Introduction
One of the important applications of thin film technology is the development of transparent and conducting oxide (TCO) coatings that serve as window layers as well as electrical contacts in solar cells. Among these TCOs, fluorine doped tin oxide (FTO) film is one of the most promising materials for photovoltaic cells, gas sensors, electrochromic devices and e-windows.1 – 3 Its high reflectivity in the infrared (IR) band makes it suitable for coatings on energy saving windows, lamps and furnace windows.4 TCO films have been prepared using various techniques, such as chemical vapour deposition (CVD), metal organic CVD, plasma enhanced CVD sol–gel, pulsed laser deposition and spray pyrolysis.5 – 15 Among these techniques, spray pyrolysis is well suited for the preparation of TCO thin films because of the ease of adding various doping materials, simplicity, commercial viability and mass production capability for uniform large area coatings. 5 5,7 In the present study, FTO films are fabricated by employing a further simplified spray technique using a perfume atomiser. In spray pyrolysed FTO films, the process parameters which affect the electrical properties are host precursor concentration (HPC) in the starting solution, fluorine doping level, 16 16,19 substrate temperature,18 solvent,19 thickness of the film,20 growth rate,21 etc. Among these control parameters, the doping level and the HPC in the starting solution are crucial in determining the electrical characteristics of the FTO films. The combined effect of these two parameters is seldom discussed in detail in the literature. Hence, in the present study, the combined effect of the HPC and the fluorine doping level in the starting solutions on the electrical properties is studied in detail.
Moreover, many researchers 16 16,22 reported that in sprayed FTO films, Rsh decreases initially as the fluorine doping level in the starting solution increases, attains a minimum value at a particular doping level (critical doping level) and again increases for further doping. However, all the related reports have not shown the same value for the critical doping level of fluorine, i.e. different researchers reported different values16,17,22 – 28 for the critical doping level. However, the reason for this variation in the critical doping level is not discussed in the literature. Hence, in the present work, the analysis of the critical doping level of FTO films for different concentrations of the host precursor is carried out with the support of the observed results and the reported values.
Materials and methods
SnO2:F films were deposited using precursor solutions having different molar concentrations (0·2–1·0M in steps of 0·2) of SnCl2.2H2O, and the fluorine doping level was varied between 0 and 100 at-% in steps of 10 at-% by adding suitable proportions of NH4F with the precursor solutions for each molar concentration. The precursor solution is prepared by dissolving high pure SnCl2.2H2O with a very small amount of HCl (0·1 mol L−1) and then diluting it by doubly deionised water. The substrates are maintained at a temperature of 320±5°C using a temperature controller and a chromel–alumel thermocouple. The intermittent spray deposition followed in this study is a two-step procedure: a spray and a 10 s interval. The experiment is repeated several times to confirm the reproducibility of the films.
The sheet resistance values were observed with the use of a four-point probe with van der Paw configuration. X-ray diffraction (XRD) patterns were recorded using an X-ray diffractometer (PANalytical, PW 340/60 X'pert PRO). Atomic force microscopy (AFM) images and optical transmission spectra were obtained using an atomic force microscope (Veeco-di CPII) and a UV–Vis–NIR double beam spectrophotometer (Lambda-35) respectively.
Results and discussion
Analysis of critical doping level of FTO films
Sheet resistance Rsh is one of the crucial characteristics which determine the quality of the TCO films. The Rsh values of FTO films are observed by keeping the fluorine doping levels at 0–100 at-% for various molar concentrations (0·2–1·0M) of precursor solution. The variation in Rsh as a function of fluorine doping level is shown in Fig. 1. The plot for 0·2M is presented as an inset for convenience, as the scale for this case is different from the others. In FTO films, at lower doping levels, when the fluorine doping level increases, the sheet resistance Rsh decreases (Fig. 1), as the incorporation of F− ions in the oxygen (O2−) sites causes the creation of free electrons in the SnO2 lattice. This decreasing trend ceases to continue at a particular doping level (critical doping level), and Rsh is found to increase for further doping. The reason for this phenomenon is that beyond the critical doping level, the interstitial incorporation of F− ions starts, which accepts the existing free electrons in the SnO2 system and thereby causes a decrease in the carrier concentration, which in turn causes an increase in Rsh.
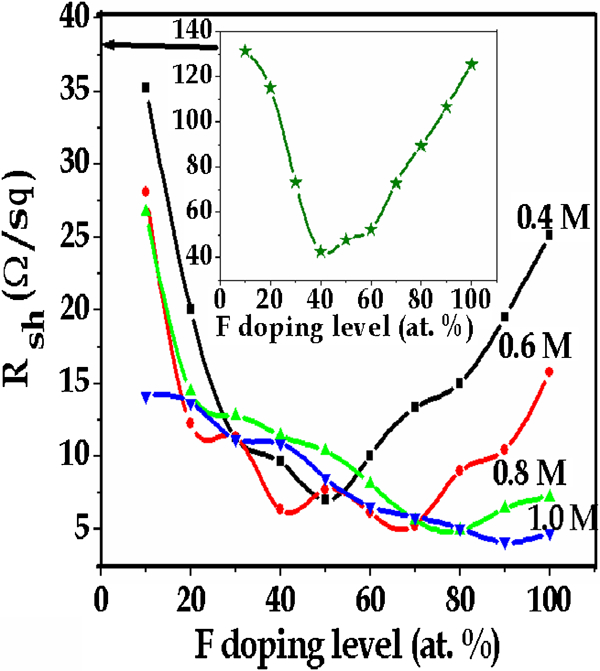
Variation in Rsh as function of fluorine doping level
From Fig. 1, it is obvious that the critical doping level is not the same for all HPCs. The reason for this variation in critical doping level can be explained as follows. In lower molar concentrations, as the number of available Sn atoms in the sprayed solution is relatively lesser, the corresponding pairs of oxygen sites for building the SnO2 lattice are also lesser. As the number of available oxygen sites is lesser, the interstitial incorporation of F− ions begins to take place at relatively lesser fluorine doping levels themselves, i.e. at 40 at-% in the case of a 0·2M solution and 50 at-% in the case of a 0·4M solution. However, as the molar concentration of the starting solution increases, the number of available oxygen sites also increases, and hence, the interstitial incorporation begins only at relatively higher doping levels (70 at-% for 0·6M, 80 at-% for 0·8M and 90 at-% for 1·0M). From the above observations, it can be concluded that the increase in the critical doping level with the increase in HPC is governed by the number of available oxygen sites in the SnO2 lattice. The variation in critical doping level as a function of HPC is shown in Fig. 2. The critical doping levels reported by other researchers (Table 1) are also marked in the plot (Fig. 2). It is seen that only one of the reported values16 deviated much from the plotted curve, and the positions of all the other points showed that the authors’ results agreed well with the reported values.16,17,22 – 28 From the plot, one can directly find the critical doping level corresponding to any concentration of his/her interest. The critical doping levels of the FTO films reported by various researchers along with the corresponding electrical parameters, such as sheet resistance, resistivity, carrier concentration and mobility, are presented in Table 1.
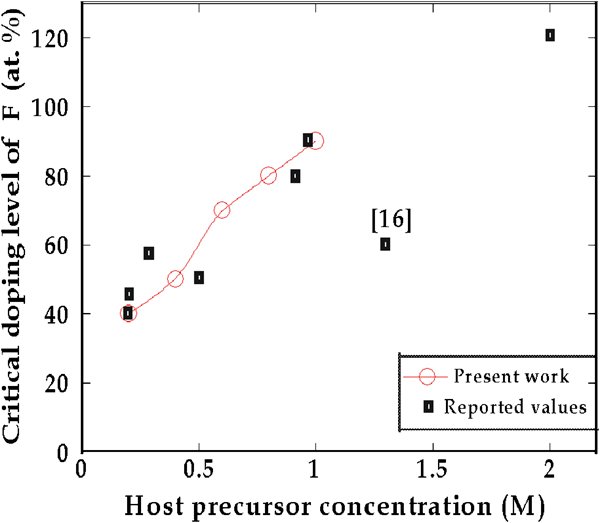
Variation in critical doping level as function of host precursor concentration
Critical doping levels and electrical parameters reported by various researchers
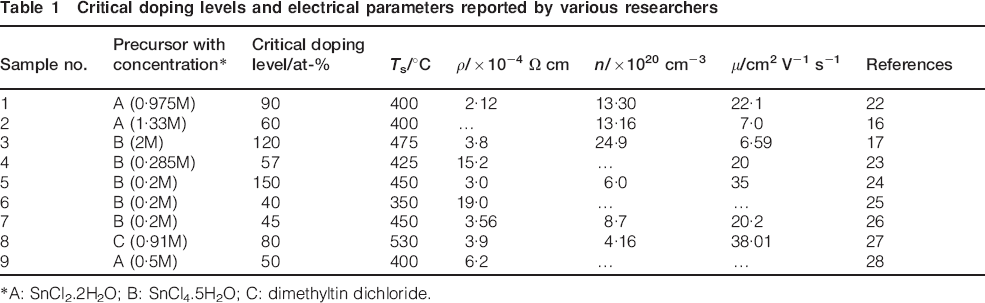
A: SnCl2.2H2O; B: SnCl4.5H2O; C: dimethyltin dichloride.
The electrical and electro-optical parameters of FTO films corresponding to the critical doping levels obtained in the present study are given in Table 2. The variations in resistivity ρ, carrier concentration n and mobility μ of the FTO films corresponding to the critical fluorine doping levels for different molar concentrations are presented in Fig. 3. Generally, there are three types of incorporation of doped fluorine atoms in the SnO2 lattice and hence in FTO films, the value of carrier concentration is governed by these three types of incorporation of fluorine atoms:
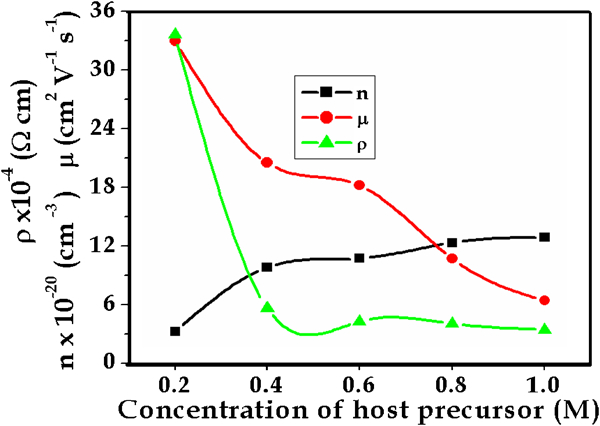
Variation in resistivity ρ, carrier concentration n and mobility μ as function of host precursor concentration
Electrical parameters of FTO films for different molar concentrations of host precursor and corresponding critical doping levels*
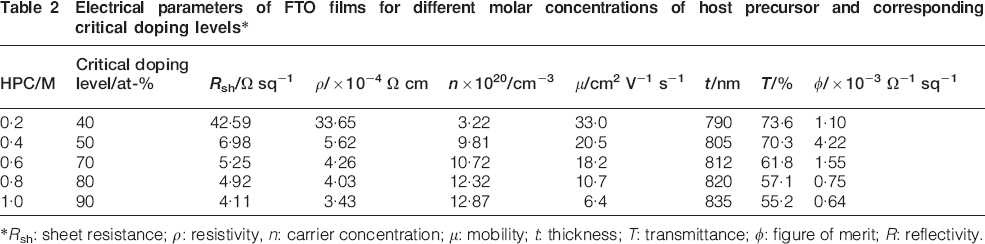
Rsh: sheet resistance; ρ: resistivity, n: carrier concentration; μ: mobility; t: thickness; T: transmittance; φ: figure of merit; R: reflectivity.
if the dopant is incorporated at an oxygen vacancy, one expects a drop in the carrier concentration
if it replaces oxygen (substitutional incorporation), an increase in ‘n’ is expected
in the case of excess fluorine doping, interstitial incorporation takes place, which results in a drop in ‘n’, as the interstitial fluorine atom acts as an acceptor.
In the present study, the carrier concentration increases as the HPC increases, indicating that the substitutional incorporation is predominant over the other two cases. The variation in carrier concentration is found to have an opposite trend as that of the resistivity. This result is an expected one, as the decrease in resistivity is mainly due to the increase in carrier concentration, and the results imply that the carrier concentration in the FTO films is controlled by the molar concentration of the starting solution and the fluorine doping level. The carrier mobility is found to decrease as the carrier concentration increases, as shown in Fig. 3. The reduction in carrier mobility for high HPC may be due to the ionised impurity scattering.29
Structural, optical and surface morphology studies
The XRD patterns of the FTO films deposited from starting solutions having different HPCs (0·2–1·0M) and having the corresponding critical doping levels are shown in Fig. 4. The XRD profile reveals that the films are polycrystalline with tetragonal structure (Joint Committee on Powder Diffraction Standards card no. 41-1445). It is obvious from the figure that the preferential orientation is (110) for all the films irrespective of the HPC. However, several researchers 4 15 29 4,15,29,30 reported (200) as the preferential orientation for the FTO films. The reason for this disagreement can be understood easily from the studies of Smith et al.31 and Shanthi et al.32 They analysed the differences in the preparation of starting solutions and found that the preferred orientation is (110) when the amount of HCl in the starting solution is low (<0·2 mol L−1). In the present study, as the amount of HCl is <0·2 mol L−1, the (110) plane is obtained as the preferential plane, as expected. The other peaks observed in the XRD patterns are (200), (211), (101), (220) and (310). However, these peaks have comparatively lesser intensities than the (110) peak. The intensity of the (110) peak increases as the HPC increases, indicating the gradual enhancement in the crystallinity of the films. The optical transmission spectra of the FTO films deposited from starting solutions having different HPCs (and the corresponding critical doping levels) are shown in Fig. 5. It is seen that all the plots have a sharp absorption edge in the range of 320–340 nm. The transmittance T in the visible range is nearly 80% for the film deposited from 0·2M HPC, and the value of T decreases as the HPC in the starting solution increases. Moreover, in all the cases, the value of T decreases in the near IR range. This decrease in transmittance in the IR range is due to the IR reflectivity of the films.11 This decreasing effect is more in the case of FTO films deposited from starting solutions having high precursor concentrations. This phenomenon is attributed to the higher concentration of charge carriers in these films.
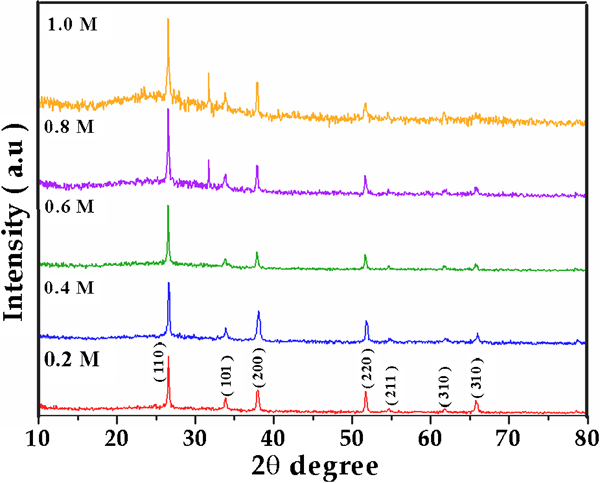
Patterns (XRD) of FTO films deposited from starting solutions having critical doping level
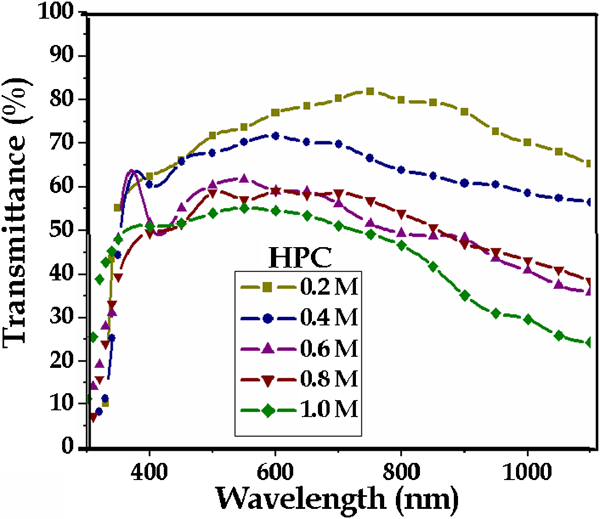
Variation in transmittance as function of wavelength for films deposited from starting solutions having critical doping level
Both low resistivity and high transmittance are equally important for TCO layers, especially in the case of solar cell applications. Because a TCO must necessarily represent a compromise between electrical conductivity and optical transmittance, careful balance between these properties is required. The Haacke's figure of merit φ = T10/Rsh is a good criterion to define the quality of highly transparent and conductive thin films.33 The FTO films prepared in this study were found to have desirable φ values (Table 2) suitable for solar cell applications. Especially, the films prepared from starting solutions having 0·4M HPC have very good figure of merit [4·22×10−3 Ω−1/sq−1] compared with other films.
The surface morphology of the FTO films is investigated using the AFM images. The AFM images (Fig. 6) depict that the surface of the films is uniform with good packing density up to 0·6M. It is also seen that the grain size increases as the HPC increases, and for the 0·8 and 1·0M cases, the shape of the grains slightly changes. The increase in grain size with the increase in HPC shows the enhancement in the crystallinity of the films, which in turn confirms the results obtained from the XRD patterns.
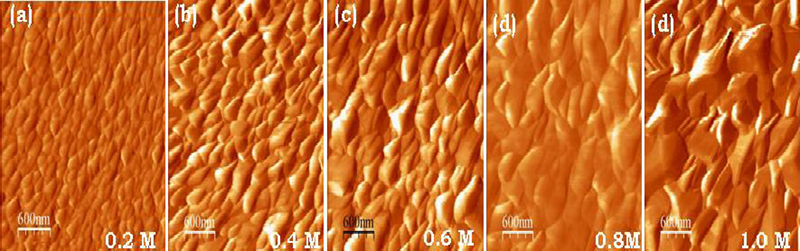
Images (AFM) of FTO films deposited from starting solutions having critical doping level
Conclusion
Fluorine doped tin oxide films were fabricated using a simplified spray pyrolysis technique, and the critical doping level at which the sheet resistance acquires the minimum value is analysed for various concentrations of host precursors. It is found that the critical doping level gradually increases from 40 at-% (for 0·2M solution) to 90 at-% (for 1·0M solution) as the concentration of the host precursor in the starting solution increases and the obtained values are found to agree with the reported values. From this study, one can directly find the critical doping level corresponding to any concentration of his/her interest.
Footnotes
Acknowledgements
The authors would like to acknowledge Dr C. Sanjeeviraja, Head, Department of Physics, Alagappa University, Karaikudi, Tamil Nadu, India, for the XRD measurements. One of the authors, Dr K. Ravichandran, acknowledges the financial support by the Tamil Nadu state council for science and technology (TNSCST/S&T Projects/PS/AR/2009-2010·1016).