
Abstract
In this work, the adsorption and reactivity of Zn and ZnO on Pd(111) have been investigated using scanning tunnelling microscopy, temperature programmed desorption, density functional theory and reflection absorption infrared spectroscopy. Using this approach, it was shown that an ordered PdZn surface alloy already forms at room temperature. The electronic structure of this surface alloy resembles that of copper. Depending on the preparation method and temperature, different surface alloys and Zn layers can be formed. The ZnO growth on Pd(111) forms different ZnO structures. Both a (4×4) and a (6×6) structure are formed depending on the oxygen pressure during ZnO growth. The (4×4) structure is most likely a hydrogen terminated Zn6O5 structure. In an attempt to verify the hydrogen termination, this structure and the (6×6) structure, which corresponds to a graphite-like Zn6O6 structure, were investigated using reflection absorption infrared spectroscopy. The results show a vibrational feature that could correspond to the O–H stretch vibration of the hydrogen terminated structure.
Introduction
During the last few years, research has been carried out to develop an effective catalyst for the methanol steam reforming (MSR) reaction (CH3OH+H2O→CO2+3H2) because of its use in direct methanol fuel cells. Methanol is a highly suitable liquid due to its high hydrogen/carbon ratio, low sulphur content and ease of handling.1 In addition, MSR has a low reforming temperature (523–623 K).2 One of the most widely used catalysts for MSR is based on Cu supported on ZnO3 – 5 because of its high selectivity and activity.6 However, deactivation occurs above 573 K due to sintering of the Cu particles. An alternative is to use catalysts based on Pd on ZnO. Iwasa et al.7 have shown that a Zn modified Pd/CeO2 catalyst has good thermal stability as well as high activity and selectivity to CO2. This is all the more important because CO is a poison for the electrode used in polymer exchange membrane fuel cells. In addition, it was found that no deactivation occurred when the reaction was conducted at 623 K,7 which is the temperature where Cu/ZnO has already lost its activity.
Chen et al.8 studied the surface structure and stability of PdZn alloys using density functional theory. They concluded that the Pd partial densities of state at the Fermi level are reduced and the PDOS of the alloy resembles those of Cu. This statement was proven by Bayer et al.9 using X-ray and ultraviolet photoelectron spectroscopies.
The adsorption and desorption of Zn on Pd(111) have been studied in detail using temperature programmed desorption (TPD) and scanning tunnelling microscopy (STM).10 In this study, it was shown that the PdZn 1∶1 surface alloy has a (2×1) structure seen in the STM. The surface alloy is already formed at room temperature. However, further Zn exposure leads to a layer by layer growth of Zn.10 The TPD results showed clearly that the first four layers of Zn on the PdZn surface alloy desorb with distinct desorption energies, and only from the fifth layer onwards, the Zn desorbs with a single desorption energy.10
The growth of ZnO on Pd(111) has been studied using STM in a recent study.11 There, it was found that at a coverage of up to one monolayer, ZnO forms well ordered (4×4) and (6×6) structures, depending on the oxygen pressure during Zn evaporation. At low oxygen pressures (10−8 mbar), the hydrogen terminated Zn6O5 (4×4) structure forms predominantly, while at high oxygen pressures (10−5 mbar), only the graphite-like Zn6O6 structure (6×6) is formed.11 The graphite-like (6×6) structure is stable up to four monolayer ZnO. With higher coverage, the structure transforms into the bulk wurtzite structure of pure ZnO.11
A short review of the Pd/Zn and Pd/ZnO systems will be given in this paper. The (4×4) and (6×6) structures will be compared based on infrared spectroscopy in an attempt to proof the hydrogen termination of the (4×4) structure.
Experimental
Scanning tunnelling microscopy experiments have been carried out in an ultrahigh vacuum (UHV) chamber equipped with crystal cleaning, metal evaporation, low energy electron diffraction (LEED) and STM facilities. The STM (Omicron, microSTM) was operated in the constant current mode at room temperature. The STM tips were fabricated from 0·3 mm W wire by electrochemical etching and cleaned in situ by electron bombardment heating. Clean Pd(111) crystal surfaces were prepared by cycles of Ar+ ion bombardment (1·5 kV) and UHV annealing to 1000 K. To remove residual carbon, the crystal was annealed at temperatures between 400 and 900 K in an oxygen pressure of 2×10⁻⁷ mbar, followed by a final flash to 1100 K in UHV.10
The thermal desorption kinetic experiments with Zn were carried out in a second UHV chamber with a base pressure of 2×10⁻¹⁰ mbar. The chamber was equipped with an Auger electron spectrometer, a LEED optic and an Ar+ ion sputtering gun. A quadrupole mass spectrometer (QMS) was installed in the main chamber for residual gas analysis and monitoring of the preparation steps. In a differentially pumped detector chamber (with a base pressure of 7×10⁻¹¹ mbar), a second QMS was mounted in a line of sight configuration for TPD.10
The reflection absorption infrared spectroscopy (RAIRS) experiments were carried out in a third UHV apparatus described in detail previously.12 Briefly, the UHV chamber is equipped with an Auger electron spectrometer, an X-ray photoelectron spectrometer and a QMS. The RAIRS measurements were carried out using a Bruker IFS 66v/S Fourier transform infrared spectrometer and an external liquid N2 cooled mercury cadmium telluride detector. A grazing incidence of ∼83° and a sum of 1000 scans were used for one spectrum with a resolution of 4 cm−1 and a mirror velocity of 60 kHz. The sample was held at 25°C during the RAIRS experiments. The clean Pd(111) surface at 25°C was used as reference. The details of the RAIRS set-up were described in an earlier publication.13
The Pd sample for RAIRS and TPD was a (111) oriented single crystal disc with a diameter of 10 mm and a thickness of 1·5 mm. The sample was mounted on a sample holder by tantalum wires (diameter, 0·25 mm), which could be heated resistively. The sample holder was attached to a manipulator, which allowed positioning in front of all the analytical devices. The whole assembly could be cooled by liquid nitrogen. Sample cleaning was performed by several cycles of Ar+ ion bombardment at an ion energy of 0·6 keV and a surface temperature of 150°C. Subsequently, the sample was annealed by flashing it up to 1180 K with a heating rate of 1 K s−1.
For Zn deposition, home built Knudsen cells were used in all the UHV systems by resistively heating molybdenum or BN (STM system) crucibles filled with pieces of Zn wire (99·98%, Goodfellow). The rate of deposition was tuned by varying the temperature of the cell and monitored by a quartz microbalance. Given the difficulties in applying the quartz microbalance for a reliable thickness control of the Zn films, as described in previous work,14 the Zn deposition rate has been cross-calibrated by monitoring the Zn QMS signal (mass 64) in the isotropic gas phase or by measuring in STM the area of two-dimensional Zn islands at coverage above 2 ML, where the metallic Zn grows at room temperature in a layer by layer mode.10
Results and discussion
The structures of PdZn surface alloys prepared by deposition of different amounts of Zn on Pd(111) have been debated in the literature as the observed (2×2) LEED pattern can also be interpreted in terms of three domains of a (2×1) structure. The first STM image of a PdZn alloy surface proved that the structure actually stems from three (2×1) domains.10 This surface alloy was shown to be thermodynamically stable. Owing to a large decrease in surface energy, it was shown that two layers of the PdZn 1∶1 alloy are more stable than one layer.15 It was also shown that the surface corrugation changes from Pd sticking out of the surface to Zn sticking out of the surface when going from one layer of surface alloy to two layers, respectively. 10 10,15 This difference has been experimentally verified later.16 Recently, this difference was used to tentatively explain the different selectivities of the MRS on different PdZn surfaces.17
Further Zn exposure on a PdZn surface alloy leads to Zn layers, which desorb with different desorption energies up to four Zn layers according to thermal desorption spectroscopy.10 This unusual behaviour is due to the electronic structure of the Zn layers, which is influenced by the underlying Pd.15 This leads to an anisotropic binding of the Zn atoms. The interaction between the Zn atoms is higher within the layer than between the layers. This can be seen from the calculated density of states.15
The reactivity of the PdZn alloy surface towards methanol has been studied experimentally, showing that with a medium amount of Zn on the surface, a high temperature formaldehyde desorption is found.18 This formaldehyde species could not be verified theoretically.19 The calculations show that methoxy is bound stronger to the PdZn surface than on the Pd surface, whereas the formaldehyde metal bond is weakened on the surface alloy.19
ZnO on Pd(111) has not been investigated in such detail yet. The structures formed by ZnO on the Pd(111) surface have only been solved very recently.11 The (4×4) structure observed in STM11 is a hydrogen terminated Zn6O5 structure according to the density functional theory (DFT) model shown in Fig. 1.
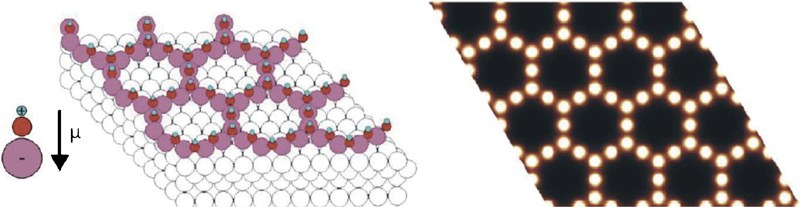
Model (left) and simulated STM (right) of (4×4) ZnO structure on Pd(111): (white) Pd, (pink) Zn, (red) oxygen and (blue) hydrogen (adapted from Ref. 20)
The (6×6) structure is a graphite-like Zn6O6 structure that is stable up to four monolayer ZnO on Pd(111).11 In this structure, no hydrogen termination is necessary for stability according to the DFT results.11 The structure is shown in Fig. 2.
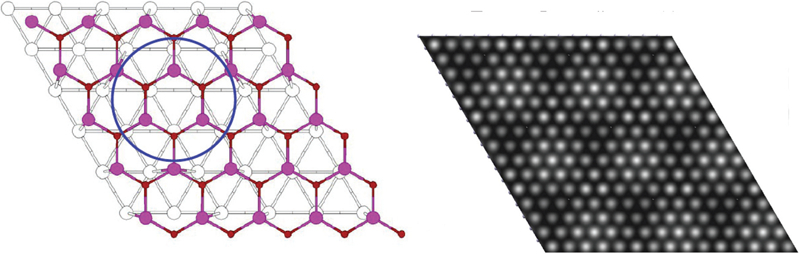
Model (left) and simulated STM (right) of (6×6) ZnO structure on Pd(111): (white) Pd, (pink) Zn and (red) oxygen (adapted from Ref. 20)
From the comparison of the simulated STM with the experimental results, it can be concluded that these structures are solved.11 However, there is no independent experimental proof yet that the (4×4) structure is hydrogen terminated. In order to try to get such an experimental proof, the different structures were investigated using RAIRS in an effort to try to measure the O–H stretching vibration of the OH groups postulated in the model of the (4×4) structure. To do this, a monolayer of ZnO was made under a low oxygen pressure (5×10⁻⁷ mbar), as this ensures a predominantly (4×4) structured ZnO layer on the Pd(111) surface. Then, the RAIR spectrum was measured, and the result is shown in Fig. 3 (black curve). Then, the same measurement was carried out with 1·2 monolayer ZnO prepared under high oxygen pressure (10−5 mbar), which led to a very similar result (red curve in Fig. 3). Finally, a ZnO layer with 2·5 monolayer was prepared under an oxygen pressure of 10−5 mbar. Again, an IR spectrum was measured, which is shown in Fig. 3 (green curve).
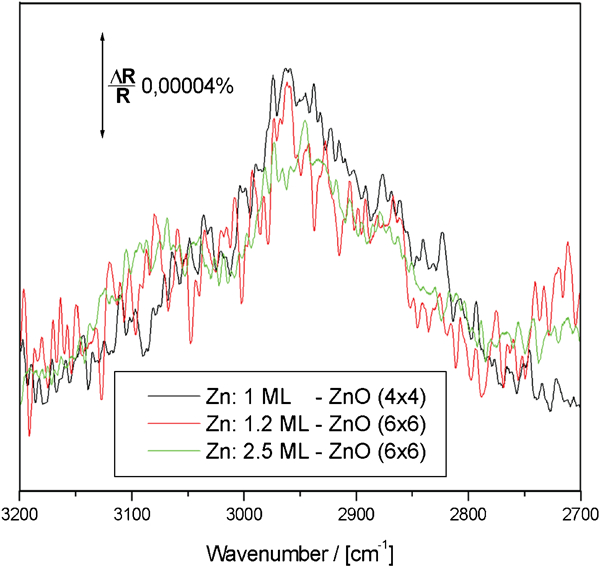
Spectra (RAIRS) of different ZnO layers on Pd(111): see text for details
It is obvious from Fig. 3 that there is a vibrational feature at 2950 cm−1 in all three cases. As OH vibrations are usually found in the range of ∼3000 cm−1, one can assume that these IR peaks stem from OH vibrations on the surfaces.
As no other peaks corresponding to hydrocarbons have been found, this vibration can most likely not be due to CH vibrations, which lie in the same region. Assuming that the vibrational feature at 2950 cm−1 stems from OH groups in the (4×4) structure (black curve in Fig. 3), the result would fit to the proposed structural model. However, with higher oxygen pressure and increasing ZnO thickness, one should only find the (6×6) structure (red and green curve in Fig. 3). However, from Fig. 3, it is clear that OH vibrations are still visible. This might be due to the formation of some OH groups also on the (6×6) structure, which will not necessarily change the STM image, so it was not detected there and not taken into account in the corresponding DFT calculations.11 Therefore, the presented IR data cannot proof the model of the (4×4) structure, but it is an additional hint that the model could be correct.
Conclusion
A short review of the structures of Zn on Pd(111) and ZnO on Pd(111) has been presented, showing that the surface alloy consists of a thermodynamically stable Pd/Zn 1∶1 alloy. ZnO on Pd(111) grows, depending on the oxygen pressure, in a (4×4) or (6×6) structure observed in STM and LEED.11 From the DFT calculations, the (4×4) structure is thought to be hydrogen terminated, as only this model leads to an agreement of the simulated STM picture to the experiment.11 The RAIRS measurements have shown a vibrational feature of ∼2950 cm−1 that might be due to the OH stretch vibration. However, this peak in RAIRS is also found on the (6×6) structure under conditions where no (4×4) is present, according to the STM results. From the STM measurements and the DFT model, a partial hydrogen termination of the (6×6) structure cannot be ruled out. Therefore, the presented data are just a hint that the proposed model of the (4×4) structure11 is correct.
Footnotes
Acknowledgements
This work was funded by the Austrian Science Fund (FWF). H. P. Koch is indebted to the Austrian Science Society (Österreichische Forschungsgesellschaft ÖFG) for the MOEL project ‘Dichtefunktionaltheorie (DFT) Berechnungen der Methanol Zersetzung auf PdZn Oberflächen’. I. Bako is indebted for support from the Hungarian OTKA 168140.