
Abstract
The in situ synthesised TiB2/Fe composite coatings were deposited by plasma transferred arc powder surfacing process. The distribution of TiB2 in the TiB2/Fe composite coatings was investigated in this paper. It is found that there is more TiB2 distributed on the top than at the bottom of the coatings in general. In addition, it is also found that heat input plays an important role in the distribution of TiB2 in the coatings. A small quantity of TiB2 whiskers are obtained in the coating with high energy density. While sufficient TiB2 is produced with appropriate energy density, TiB2 lumps will be obtained with small total energy input, and the concentration gradient of TiB2 will appear with a large total energy input. Finally, the metallurgical model of in situ synthesised TiB2/Fe composite coatings by plasma transferred arc process is extracted.
Introduction
TiB2 contained iron based coatings have recently become a hot spot 1 1,2 due to TiB2's high melting point, high chemical stability, high hardness and excellent wear and corrosion resistance. Conventional production methods, such as high temperature sintering, often add the TiB2 phases into the metal matrix directly, 3 3,4 but this often leads to poor wetting behaviour between ceramic phase and metal matrix and segregation of reinforcing phases. To overcome these drawbacks, the in situ technique has been extensively investigated recently. First, laser cladding was used to obtain in situ synthesised TiB2/Fe composite coatings on steel.5 – 8 More attention was then paid to plasma transferred arc (PTA) powder surfacing process, which is much simpler and cheaper. The in situ synthesised TiB2 whiskers by PTA are known to possess good distribution, excellent wettability and favourable interface characteristics for strengthening the Fe base metal matrix. The microstructures, hardness, cracking resistance and performances at high temperature of such TiB2 whisker reinforced PTA powder surfacing composite Fe–Ti–B coatings were investigated in the previous work.9 – 11
However, full attention has not been given to the application of the in situ synthesised TiB2/Fe coatings. The distribution of TiB2 is not stable with different heat inputs and has not been paid attention to. In view of the problem, the effects of heat input on the distribution of TiB2 in the composite coatings are analysed in this paper. Finally, the metallurgical model is extracted.
Experimental
Materials
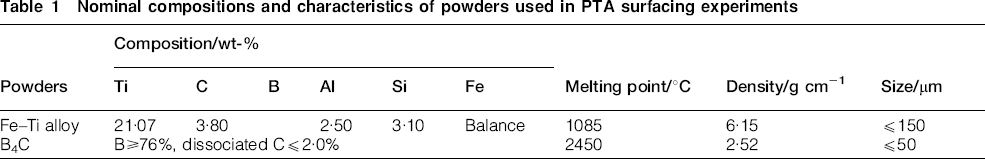
Mild steel, with a composition of Fe–0·18C–1·32Mn–0·53Si (wt-%), was used as substrate. Specimens were cut to the dimensions of 200×40×8 mm, polished with 200 grit SiC abrasive paper and degreased in acetone before coating. The powder used in this investigation was a mixture of commercial Fe–Ti alloy powder (Jinzhou Alloy Factory, Jinzhou, China) and B4C powder (Mudanjiang Boron Carbides Factory, Mudanjiang, China). The nominal compositions and characteristics of these powders are given in Table 1, according to the manufacturers.
Nominal compositions and characteristics of powders used in PTA surfacing experiments
Plasma transferred arc powder surfacing processing
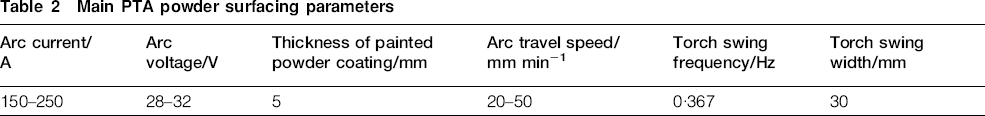
A PTA powder surfacing equipment made in China was used in the coatings treatment. Ensuring a good interface fusion, a smooth coating surface and a minimum dilution, the PTA depositing parameters were optimised in Table 2. The powders were weighed in desired proportions and mixed in a ball mill for 20 min without any addition. Subsequently, the powder mixture was painted on the sample substrate using a water glass to ∼3 mm thick before processing. Argon was blown coaxially to protect the processing area. All of the test coatings for the microstructural examinations were deposited with a 0·367 Hz torch swing frequency and 30 mm track width (swing width).
Main PTA powder surfacing parameters
Microanalysis
Microstructural examinations were carried out using a Hitachi field transmission type scanning electron microscope (SEM) and a Siemens X-ray diffractometer (XRD) with Cu Kα radiation. In addition, a Leitz microhardness testing machine was used in the coatings analysis.
Results and discussion
It is known that heat input is closely related with several parameters, such as arc voltage, arc current, surfacing speed, surfacing time, etc. Owing to the complicated effects of the parameters on the forming of the coatings, two key factors, i.e. total heat input Q (J) and energy density qS (J s−1 cm−2), are introduced in the paper to analyse the comprehensive effects of all the parameters. The two concepts are similar in ordinary welding process, while they are different in PTA powder surfacing process. In PTA powder surfacing process, the total heat input means the whole energy absorbed by the powders and substrates during the welding process, while the energy density means the power input per unit area. They are defined as follows


In order to analyse the effects of heat input on the distribution of TiB2 in the composite coatings, four groups of different heat input parameters are used, as shown in Table 3. The energy density and the total energy input are calculated respectively in the table.
Groups of different heat input parameters used in PTA surfacing experiments
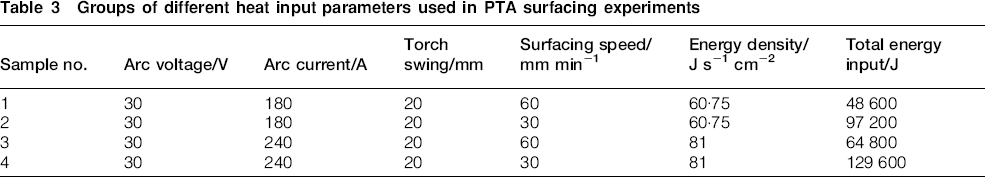
The microstructures and XRD analysis of the four groups of coatings are shown in Figure 1 Figure 2 Figure 3 Figs. 1–4. As the TiB2 obtained has the shape of strip in the microstructures, it can be seen that no. 1 coatings have slender TiB2, and a lump structure forms at the bottom of the pool. The no. 2 coatings have strip-like TiB2, and TiB2 is distributed more densely on top of the coating. The SEM image of TiB2 in no. 2 coatings is shown in Fig. 2b. However, from Figure 3 Figs. 3 and 4, we can see that hardly any TiB2 whiskers were obtained. The reason is that under 81 J s−1 cm−2 energy density, the dilution rate is so large that the densities of the main alloying elements (Ti, B, etc.) are greatly reduced. The small quantity of TiB2 whiskers are distributed mainly near the surface of the pool due to the long time allowed for them to float.
a microstructures and b XRD diagram of no. 1 coatings (energy density of 60·75 J s−1 cm−2 and total energy input of 48 600 J)
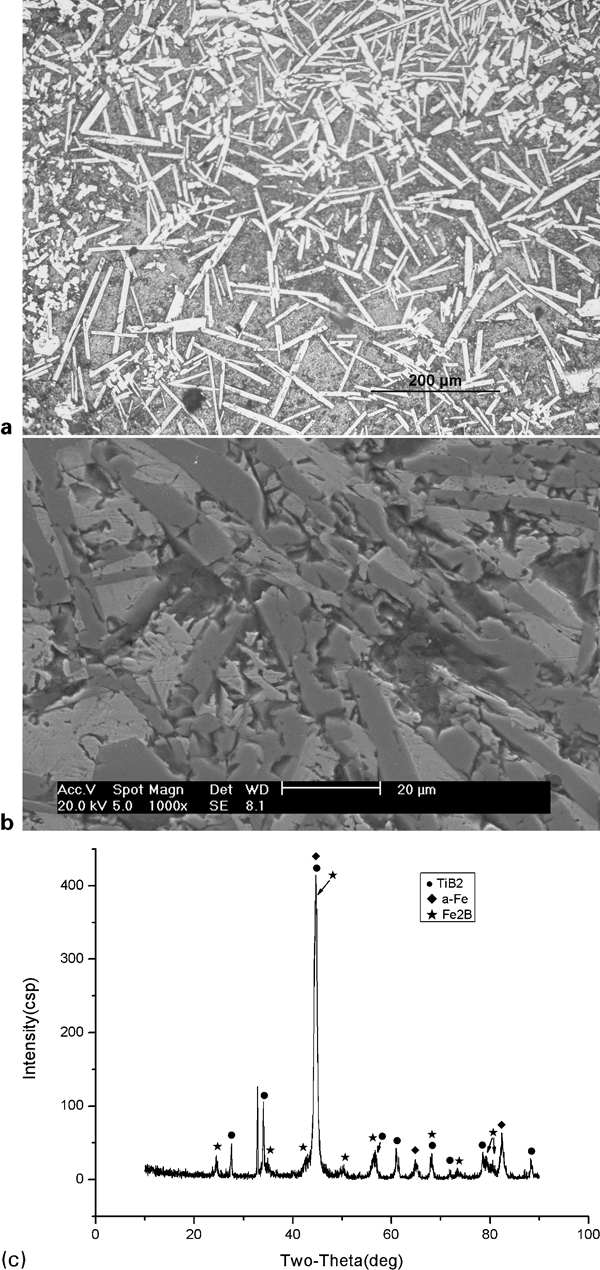
a microstructures, b SEM image and c XRD diagram of no. 2 coatings (energy density of 60·75 J s−1 cm−2 and total energy input of 97 200 J)
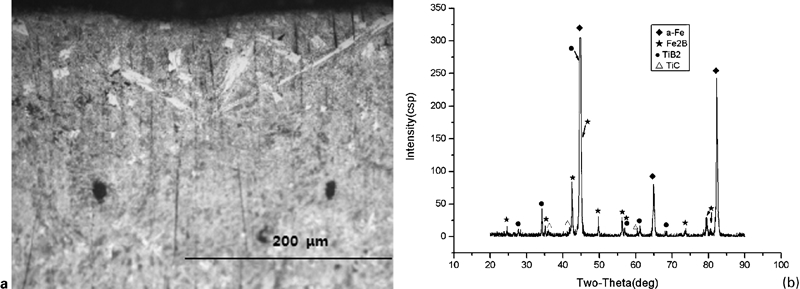
a microstructures and b XRD diagram of no. 3 coatings (energy density of 81 J s−1 cm−2 and total energy input of 64 800 J)
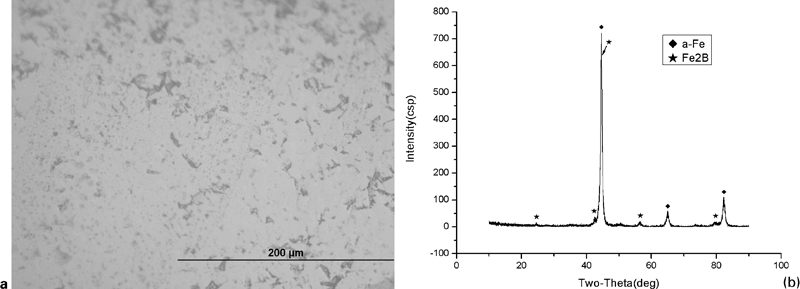
a microstructures and b XRD diagram of no. 4 coatings (energy density of 81 J s−1 cm−-2 and total energy input of 129 600 J)
The distribution curves of these coatings’ microhardness are shown in Fig. 5. From the curves, it can be found that there is more TiB2 distributed on the top than at the bottom of the coatings in general. The no. 2 coatings have an approximately constant microhardness gradient, and the gradient of the no. 1 coatings is not so regular. The numbers 3 and 4 coatings have a much lower hardness because there is much less TiB2 obtained, and the higher hardness mainly converges on the surface.
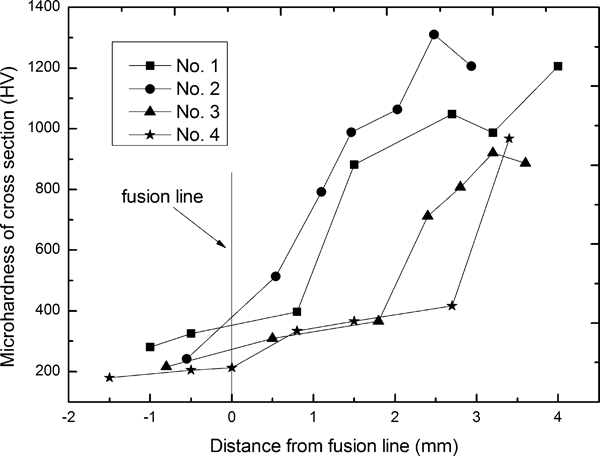
Distribution curves of microhardness of nos. 1–4 coatings
The nos. 1 and 2 coatings are analysed for the different distributions of the coatings’ hardness. Their microstructures are shown in detail in Figure 6 Figs. 6 and 7 respectively.
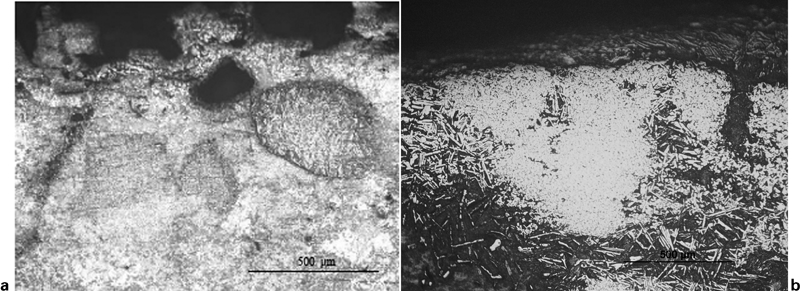
Lump microstructures of no. 1 coatings (energy density of 60·75 J s−-1 cm−2 and total energy input of 48 600 J):
Gradient microstructures of no. 2 coatings (energy density of 60·75 J s−1 cm−2 and total energy input of 97 200 J):
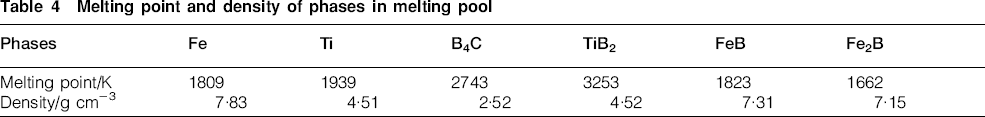
It is known that TiB2 is difficult to form under low energy density, and the energy density of 60·75 J s−1 cm−2 of nos. 1 and 2 coatings is high enough to form the pool. In addition, when the total energy input is small, there are some lump structures in no. 1 coatings, as shown in Fig. 6. That is because B4C will gather up to minimise the surface tension before being fused. As we know, TiB2 is mainly synthesised by the reaction between Ti and B4C. Ti can react with B4C before B4C is fused. However, the reaction rate is very low since the reaction is between the solid phase and the liquid phase. Therefore, a little TiB2 with high melting point (as shown in Table 4) is synthesised at first around B4C lumps, and the lump structures are difficult to be broken up by the fluid in the pool. When the temperature is raised to the melting point of B4C, B4C lumps begin to be fused from the surface. The semifused B4C lumps will stay in a certain time, and then a great deal of Ti rushes into the B4C lumps and reacts with them. Since the convection of the pool is weak due to the small total energy input, the lumps are difficult to be broken up. As a result, a lot of compact TiB2 lumps are obtained. As the total energy input is small, the TiB2 lumps are rapidly cooled down to the melting point. Hence, TiB2 lumps can be easily kept. That is the reason why TiB2 lumps are found in the coatings.
Melting point and density of phases in melting pool
Generally, low density B4C and TiB2 would float in the pool, so the lumps can often be found on top of the coatings, as shown in Fig. 6a. However, on account of convections in the pool, the floating lumps might be rushed to other places and then be cooled down instantly. Figure 6b shows the lump structures at the bottom of the coatings. That just explains the inhomogeneous distribution of the hardness of the no. 1 coatings.
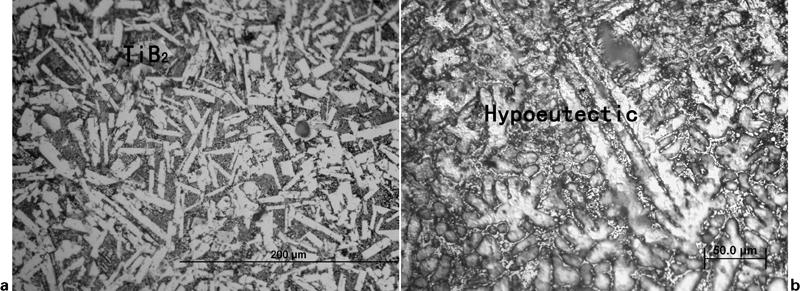
When the total energy input is raised to 97 200 J, as shown in Fig. 7, it can be seen that a dense bar-like TiB2 gather up on the top of the coatings. However, at the bottom, less TiB2 can be found. Instead, many hypoeutectic dendritic austenites are obtained. Figure 5 shows the microhardness gradient of the no. 2 coatings, the nearer the distance is to the surface, the higher the hardness is obtained. This absolutely reveals the concentration gradient of the TiB2 whiskers.
The concentration gradient can be explained as follows. As is discussed above, before the temperature reaches B4C's melting point, B4C lumps float to the surface and react slowly with Ti at the same time. After the temperature reaches B4C's melting point, many Ti rush into the semifused B4C lumps and react with them intensely. However, as the total energy input is large, the convection of the pool is strong. Thus, the B4C lumps are broken up easily. In addition, at this moment, B4C have floated to the upper part of the pool. What is more, the duration of the melting pool is long, and then there is sufficient time for the low density B4C and TiB2 to float to its surface. As a result, the concentration gradient of TiB2 appears.
As a conclusion of what has been discussed above, the metallurgical model of in situ synthesised TiB2/Fe composite coatings by PTA is extracted, as shown in Fig. 8. First, assume that the melting pool is generated and sufficient TiB2 is produced. When the temperature is low, B4C lumps (A shown in Fig. 8) appear to minimise the surface tension, and the lumps float in the pool due to its low density. A few lumps are washed to other places by the convection of the pool (B shown in Fig. 8). Before B4C is fused, TiB2 can be synthesised by the reaction between Ti and B4C very slowly. After the temperature reaches B4C's melting point, many Ti rush into the semifused B4C lumps and react with them intensely. When the total energy input is small, the convection of the pool is weak, and then the B4C lumps are difficult to be broken up. Consequently, compact TiB2 lumps are kept during the pool's fast cooling. When the total energy input is large, B4C lumps can be broken up easily. As the duration of the melting pool is long, there is sufficient time for TiB2 to float. Hence, a certain concentration gradient is obtained.
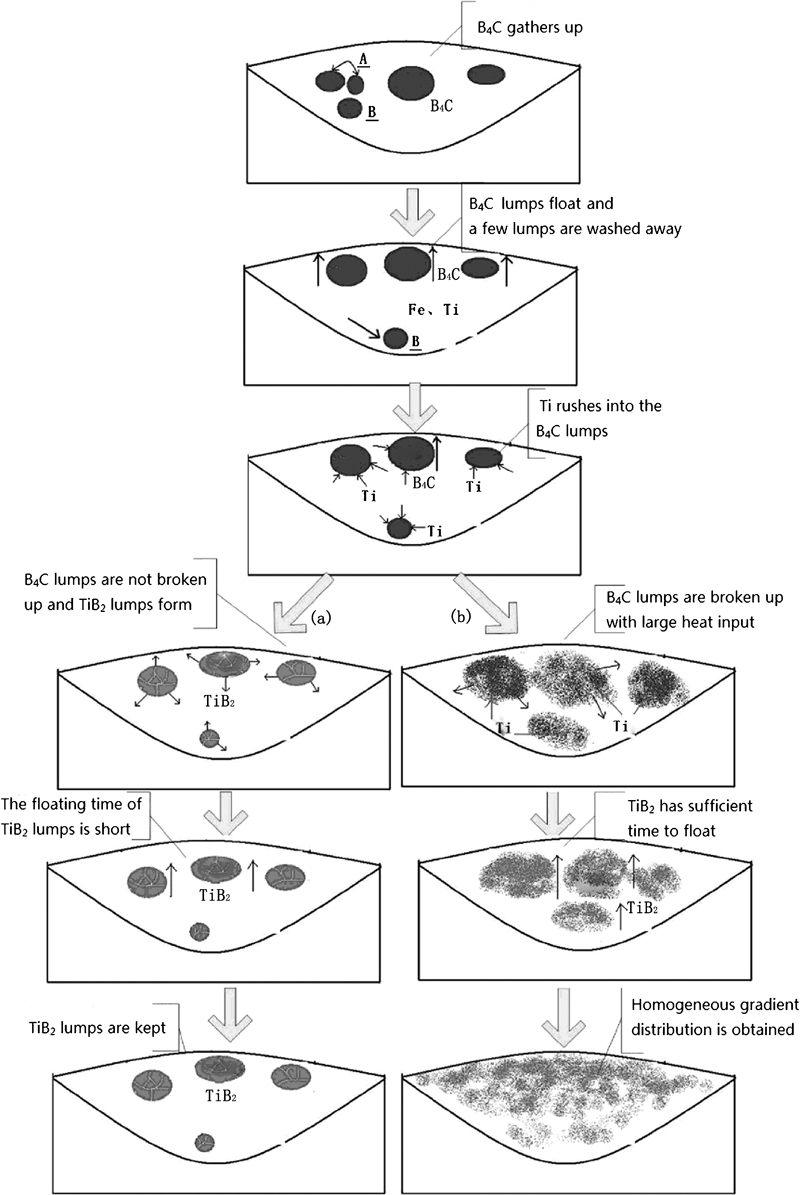
Diagrammatic sketch of metallurgical model of melting pool:
Conclusion
Based on all the experimental results and the discussion above, the following conclusions could be drawn.
Generally, there is more TiB2 distributed on the top than at the bottom of the coatings.
A small quantity of TiB2 whiskers are obtained in the coating with high energy density.
When sufficient TiB2 is produced with appropriate energy density, TiB2 lumps will be obtained with small total energy input, and the concentration gradient of TiB2 will appear with a large total energy input.
The metallurgical model of the in situ synthesised TiB2/Fe composite coatings by PTA process is extracted.
Footnotes
Acknowledgements
We wish to thank the National Nature Science Foundation of China for the financial support for this research project (grant no. 50574068).