
Abstract
In many previous studies, it was stated well that acid pickling could improve the density and adhesive strength of plating. In this work, it focused on the relationship observed between the pickling time and the porosity of plating. A group of field emission SEM, EDX and profilograph detections showed that the parent metal surface profile and chemical constituent were both changed after the pickling process. Two kinds of electrochemical tests were adopted and gave a quantitative analysis to the porosity of plating. A three-dimensional nucleation model was established to explain how the porosity of plating was influenced by overvoltage and three kinds of interfacial tension. Coupled with previous investigation, it finally revealed that the pickling time should be restricted in a proper condition or the plating porosity would be increased.
Introduction
Because of the outstanding cost performance ratio, acid pickling is widely used in the plating industry to make substrate rough and to clean the contaminants, e.g. scale cinder.1, 2 At present, there are many researches focusing on the improvement of pickling on plating density and adhesive strength, but few pay attention to the negative effect.3, 4 However, in the actual production process, the definition of proper pickling is neither claimed clearly in standards nor in factory norms but only judged by experience or visualising in practice, which might make a negative effect, especially to the porosity. For now, all the common porosity tests are virtually based on an unstable mechanism: the parent metal could react with acid or salts, and the products could be discharged through the pores. This process is easily influenced by many factors. Therefore, in this work, to shed light on the relationship between pickling and porosity, a kind of mild steel was used under different pickling conditions in a large scale time range, and two kinds of electrochemical methods had been adopted to assess the porosity, coupled with the field emission SEM (FESEM), EDX and profilograph detection.
Experimental
Specimen preparation
Fe360A (ISO) steel sheets (as received) were employed as the substrate material in this research, and their composition is Fe–0··2C–0··35Mn–0··22Si–0··033S–0··03P (wt-%). Square samples of 10×10×2 mm were machined for the test.
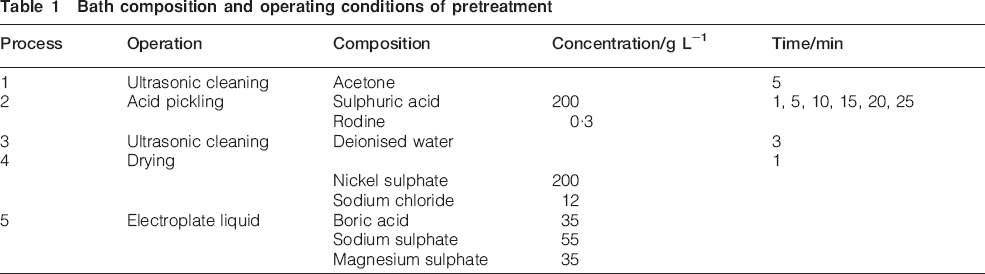
Before the plating, the samples were pretreated following the parameters shown in Table 1, which were adjusted from the ASTM-B183 standard. The nickel plating was processed under a current density of 0··8 A dm−2 with cathode revolving at 300 rev min−1 for all the samples at last.
Bath composition and operating conditions of pretreatment
Microstructure analysis
The surface roughness and the remaining contamination on the surface of all specimens were tested before and after the plating step by an HSR200-3 (Shanghai, China) profilograph and a LEO 1530 (Germany) FESEM with EDX and an S-360 SEM with operating voltage of electronic beam at 25 keV for morphological observation.
Electrochemical measurement
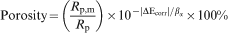
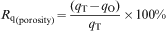
According to the equation being proposed,5,
6 the porosity can be calculated via the formula as follows (all the parameters can be obtained from the polarisation curves)
The second test is a pilot study to assess the porosity, which was used initially in porous electrode research7
Results
Effect on morphology of parent metal
Figure 1 shows the surface topography of the parent metal at various pickling times. The dark place is the steel surface, and the light points are precipitates of carbon. With increasing time, the count of precipitates ascends early and descends later, but the metal phase increases continuously and replaces the scale cinder gradually. Additionally, an overpickling in the form of localised corrosion is shown clearly in Fig. 1d–f.
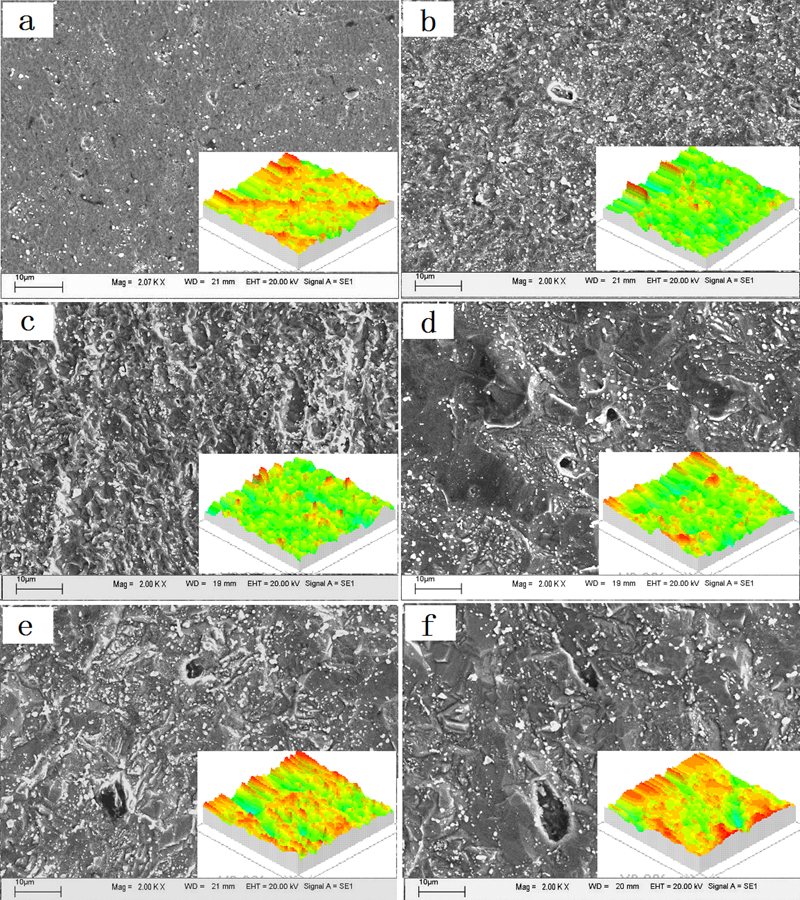
Images (SEM) of surface of parent metal in different pickling times: a 1min; b 5min; c 10min; d 15min; e 20min; f 25min
This tendency could be shown more visually in the profilograph micrographs at the corners. At the prime period, the surface is bumpy and covered by a scale cinder. In ∼10 min, the acid ions break the layer of the scale and make the surface sharp, so precipitates can adhere to the broken edge. Finally, there are many peaks and pitting spots caused by overpickling, as shown in Fig. 1d–f.
Effect on porosity of plating
An electrochemical polarisation curve test had been carried out to measure the porosity. Figure 2 shows the test results which are calculated using formula (1).
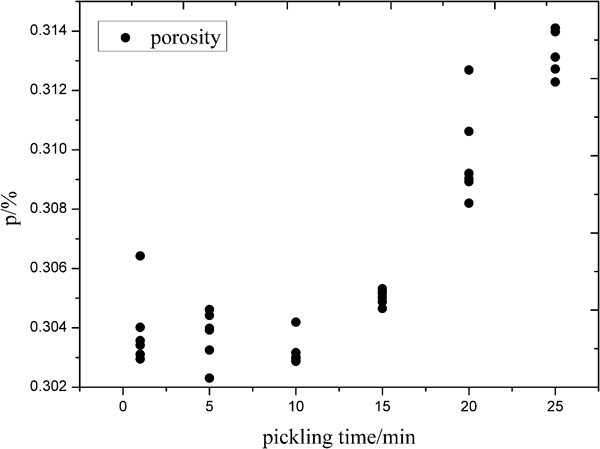
Relationship between porosity and pickling time of Fe360A steel with nickel plating
Base on the scatter plots, the porosity fluctuates in a certain range in ∼10 min and ascends rapidly later. Combined with the discussion before, it can be indicated that the overpickling will influence the porosity of the plating.
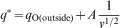
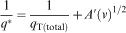
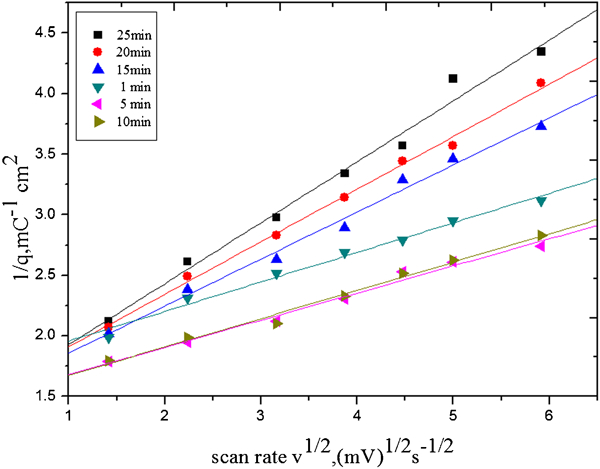
According to equations (2) and (3), Figs. 3 and 4 show the qO and qT calculated by fitting the liners. In Fig. 4, the curves keep a good linear relation in most ranges but not in high scan rates because the response current is larger at high v (mV s−1) and the ohmic potential drop cannot be compensated effectively.
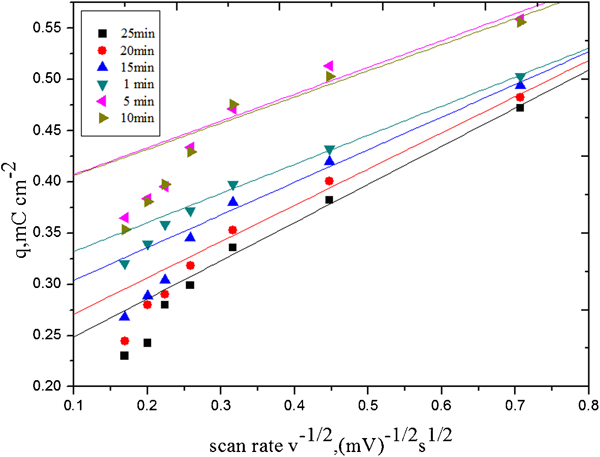
Extrapolation of q to v = ∞ for various cyclic voltammetry scan rates
Extrapolation of q to v = 0 for various cyclic voltammetry scan rates
Figure 5 shows the change of qO, qT and Rq as a function of pickling time. As a difference of the two parameters above, Rq ascends rapidly after 10 min, which means that there is more effective internal surface. In other words, there are more pores in the plating. This result almost meets the conclusion given before in Fig. 2.
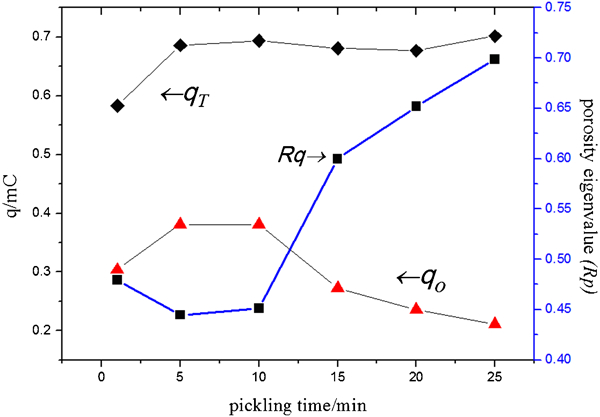
Change of qO(outside), qT(total) and Rq as function of pickling time
It is worthy pointing out that the Rq here is just a characteristic factor but is not equal to the porosity. Because the parent metal has more electrochemical activity than the plating metal, it will provide more charge during the oxidation reduction cycle, which makes Rq much bigger than the regular count of porosity.
Discussion
In order to further reveal the relationship between pickling and porosity, according to relative research, a new nucleation model was presented.8
–
10 It was assumed that the plating metal crystallises in the form of a hemispheroid model, and the energy changes can be expressed as
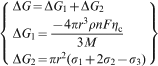
According to the formula above, the relationship between ΔG and r is consistent with a quadratic parabola. Therefore, there is an extremum of r called rc, which makes ΔG have a maximum value. The nucleation will proceed only if r⩾rc, or ΔG will increase and make the new crystal unstable. The rc and nucleation speed v could be expressed as follows
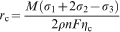
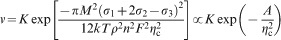
Therefore, there are two variables, ηc and three kinds of tension which control the nucleation driving force and nucleation size.
On the one hand, the effect of tension on plating porosity can be found in Fig. 6. Point A in the picture is a typical nickel grain, and the compositions of the other points were detected by EDX and are shown in Table 2.
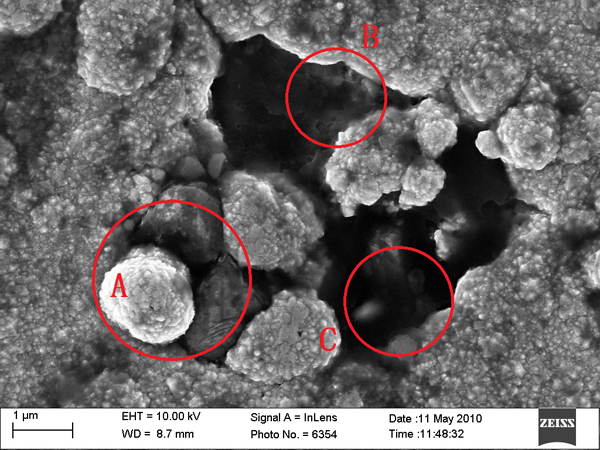
Images (FESEM) of pore caused by different substrate compositions (acid pickling time, 15 min; electroplating time, 30 min)
Energy dispersive X-ray test results of composition in Fig. 6
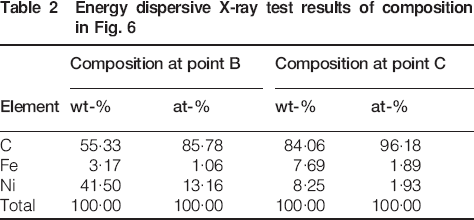
According to the test results, point B is the tiny nickel crystal located at the compound of many carbon precipitates and a few steel phases. The substance at point C is almost entirely composed of carbon precipitates. The different growth driving forces make the nucleation unbalance and leave gaps among them.
On the other hand, as already found, the bigger potential drop will decrease the nucleation size rc and enlarge the nucleation speed v, so the nucleation at pits should be very soon. However, this process will consume the plating ions drastically and restrict the growth step because it is difficult to transport enough ions into the pits. On the contrary, the nucleation at peaks is so limited by higher rc and lower v, but once nucleation is completed, this crystal will be easy to grow up.
Figure 7 shows this phenomenon. The crystals at the pits are too tiny to cover all the substrates, and the big grains all around leave gaps among them. This phenomenon further explains why plating porosity increased after an overpickling.
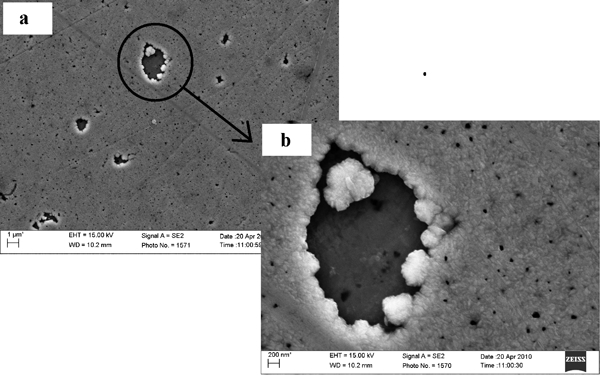
Images (FESEM) of pore caused by different substrate profiles (acid pickling time, 10 min; electroplating time, 20 min)
Conclusion
In this paper, a group of FESEM, EDX and profilograph detections are employed, and they prove that both the parent metal profile and chemical constituent will be changed by pickling. Two kinds of electrochemical test methods show that the porosity will ascend quickly after an overpickling. A three-dimensional nucleation mechanism is presented to explain how height fluctuation and composition change increased the porosity. These clues indicate that the pickling time should be restricted in a proper condition, which should be defined in standards or norms as quickly, or the plating porosity will ascend.